The End Of Price Suppression?


Given that not all the information about the situation of the PM market in early to mid-April 2013 is readily available, it is not possible to explore the reason for the Niagara of all "waterfall” attacks at that time. Now, with the second largest of these attacks still under way, there is more known, or that can be speculated about, to evaluate the degree of panic that might lie behind the 8 week long, still ongoing battle to suppress the prices of gold and silver, which entered a desperation phase last week.
Meanwhile in the US, COVID-19 continues to take its toll. Daily deaths remain near 1000 from Tuesday to Friday, with new cases mostly above 40 000 from Tuesday to Saturday. The weekly cycle now appears to become more extreme between the highs and lows of new daily infections and deaths. On Sunday 20th September, 294 Americans died a COVID-related death; on Wednesday 23rd the number jumped to 1112, a 378% increase. Then fell to 276 on Sunday 27th. The reason for the quite constant cycle and its large variation is still unclear. It nevertheless looks as if the virus will be with us until well into 2021, even with the progress being reported on a vaccine. Now that the number of new cases have stabilised at a high number and even while daily deaths trend lower, life cannot fully return to normal.
The ongoing bull market in gold in terms of the London PM fix effectively began in early October 2018 at $1185.55 and peaked on 6 August at $2067.15 for a gain of 74.4%. Silver, always the laggard, started its rising trend at the end of May 2019 at a London fix of $14.375 to peak at $28.885 on September 1st, having doubled in price. In early 2020, however, so the story goes, a very large number of silver options that were purchased much earlier, were due to mature with a hefty profit.
It stands to reason the sellers of the options were not happy about a prospect of a very large loss. Lucky for them, they apparently were in a position to do something about it. On 24 February silver was fixed at $18.775 and was breaking above long time strong resistance with all indications of extending the bull trend. That was the end of the rally, as the winds of fortune began to blow against the purchaser of the soon to expire options.
On that day the silver OI was 244 705. The silver price nose-dived vertically to be fixed at $12.005 on 19 March, losing 36% along the way. The OI then was at 159 682 for a decline of 85 023 contracts – just more than a third of the open positions in mid February. Starting off that low base in March, the new silver rally achieved a gain of 240% by September 1st in its attempt to catch up with gold.
That was when April 2013 repeated itself. However, the two metal prices differed substantially. The price of gold first fell to a little above $1800, where it fluctuated in a broad range between $1910 and $1970 until last week, when the bear trend accelerated for a gold fix of $1859.70 on Friday; a 10% decline off the high.
Silver had a different experience. When gold had peaked early in August, silver also made a high, at $28.33. It then fell steeply for a fix right at firm support at $25.81 – 10% in one day. The support held and the price bounced to hold around $26 and then spiked higher on September 1st by a $1.50 to hit $28.885. That spike put the fear of a short squeeze on the shorts – much as the options had done 6 months earlier – and they began to make certain they will not suffer a major loss.
For more than 2 weeks the resilient silver longs held firm, and then the pressure mounted; last week the silver fell from a fix of $27.06 the week before to a low of $22.22 (-18%) on Thursday. On Friday there was a minor improvement to $22.63. This is more than 21% down off the high, compared to the 10% of the decline in the price of gold – which is further confirmation that silver is the Big Threat for the shorts, if such is needed.
An analysis of the changes in prices and OI of the metals during the period of the bull market since the end of March reveals the degree of success of the attack on the metal prices to reduce the risk of a short squeeze for the sellers of contracts, which clearly includes other market players than only the big banks. The table below shows how the metal open interest changed from March and the financial exposure of the short positions.
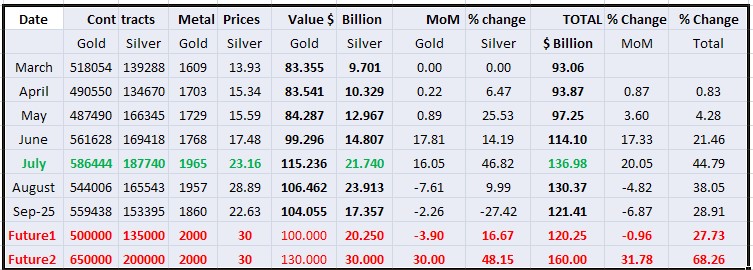
The columns show the metal’s OI and prices at month ends, the associated dollar values of their OI and both their MoM and progressive percentage changes in the value of the OI. Two future scenarios are included; the first assumes that the OI of gold and silver are reduce to about what they were in April and the second has the OI of both the metals at levels where they had held for a long time previously. The values for the end of July are in green as that was shortly before the prices were again attacked.
The severe attack on silver in March had an initial effect on both the metals; their open interest declined during April and in the case of gold even more in May. Silver experienced a sharp increase in OI during May, which presumably is associated with renewed selling to keep the price under control, with good success. During July the bull market was established and open interest jumped while prices also increased substantially – which apparently convinced the Cabal that heavy selling was no longer successful as a means to control prices. Too many new buyers were eager to buy into the PM bull markets.
During August the gold price dropped as selling pressure increased. Its Oi dropped as well, perhaps mostly longs taking profit when the rally reversed. While the silver OI also dropped, its price continued to increase, presumably on fresh demand even while there was profit taking. However, there might also have been some shorts – the large specs perhaps – that covered their short positions or took profit.
During August, the attack the Cabal achieved some result in terms of the gold open interest; the value of their exposure declined by 7.61%, then fell another 2.26% in September to date. However, during August, the jump in the silver price more than off- set the decline in its OI to increase the total short exposure by almost 10%. It must have acted as a wake-up call for the Cabal that taught them a more extreme attack was needed if they wanted to succeed in reducing overall risk exposure.
Overall exposure declined by 4.82% during August and then by another 6.87% in September. This brought the increase in total exposure lower from $130 billion to $121 billion, but even so, overall the shorts were still 29% worse off than at the end the previous attack in March, even if lower than the 38% a month earlier.
It is doubtful whether the Cabal now feels comfortable. It is logical they wanted to achieve a much larger decline in open interest, which is still higher than at the end of March. The question is whether continued attacks will deliver the desired result. Buyers will hold back for a while after last week’s steep fall in prices, but how long before the lure of true bargains brings them back in droves to buy as much gold and silver as they can afford rather than risk the prices running away from them?
While speculators probably have left the PM market, the metals look very attractive now from an investment perspective. Further selling could increase open interest by leaps and bounds with investors who less price sensitive than short term traders. Other considerations are that PM markets are not isolated, but influenced by what is happening elsewhere, specifically on Wall Street. A significant correction there will divert trader and investor interest to gold and silver. PM metals will also benefit if more dollars are printed to try and achieve a V-shaped recovery or if it becomes evident that it will be L-shaped and investors look for alternatives to equities.
The conclusion has to be that this is an excellent time to increase positions in gold and silver. While the attacks on the prices can continue, there has to be a limit to how much lower the metal prices can be suppressed before there is an explosion in demand for any number of strategic reasons other than only the low prices.
Euro–Dollar
The selling pressure on the PM prices was assisted by a surge in the dollar that also had severe effects on the euro. The euro broke from the consolidation between the lines D ($1.1827) and Z ($1.1854) and which had to break soon. Expectations were that the rising trend would resume, but the sudden jump in the value of the dollar – despite the large number that could still be printed – sent the euro sharply lower. It now remains to be seen whether support at line E ($1.1598) will hold to help keep the euro in the steep bull channel JKL ($1.1473).
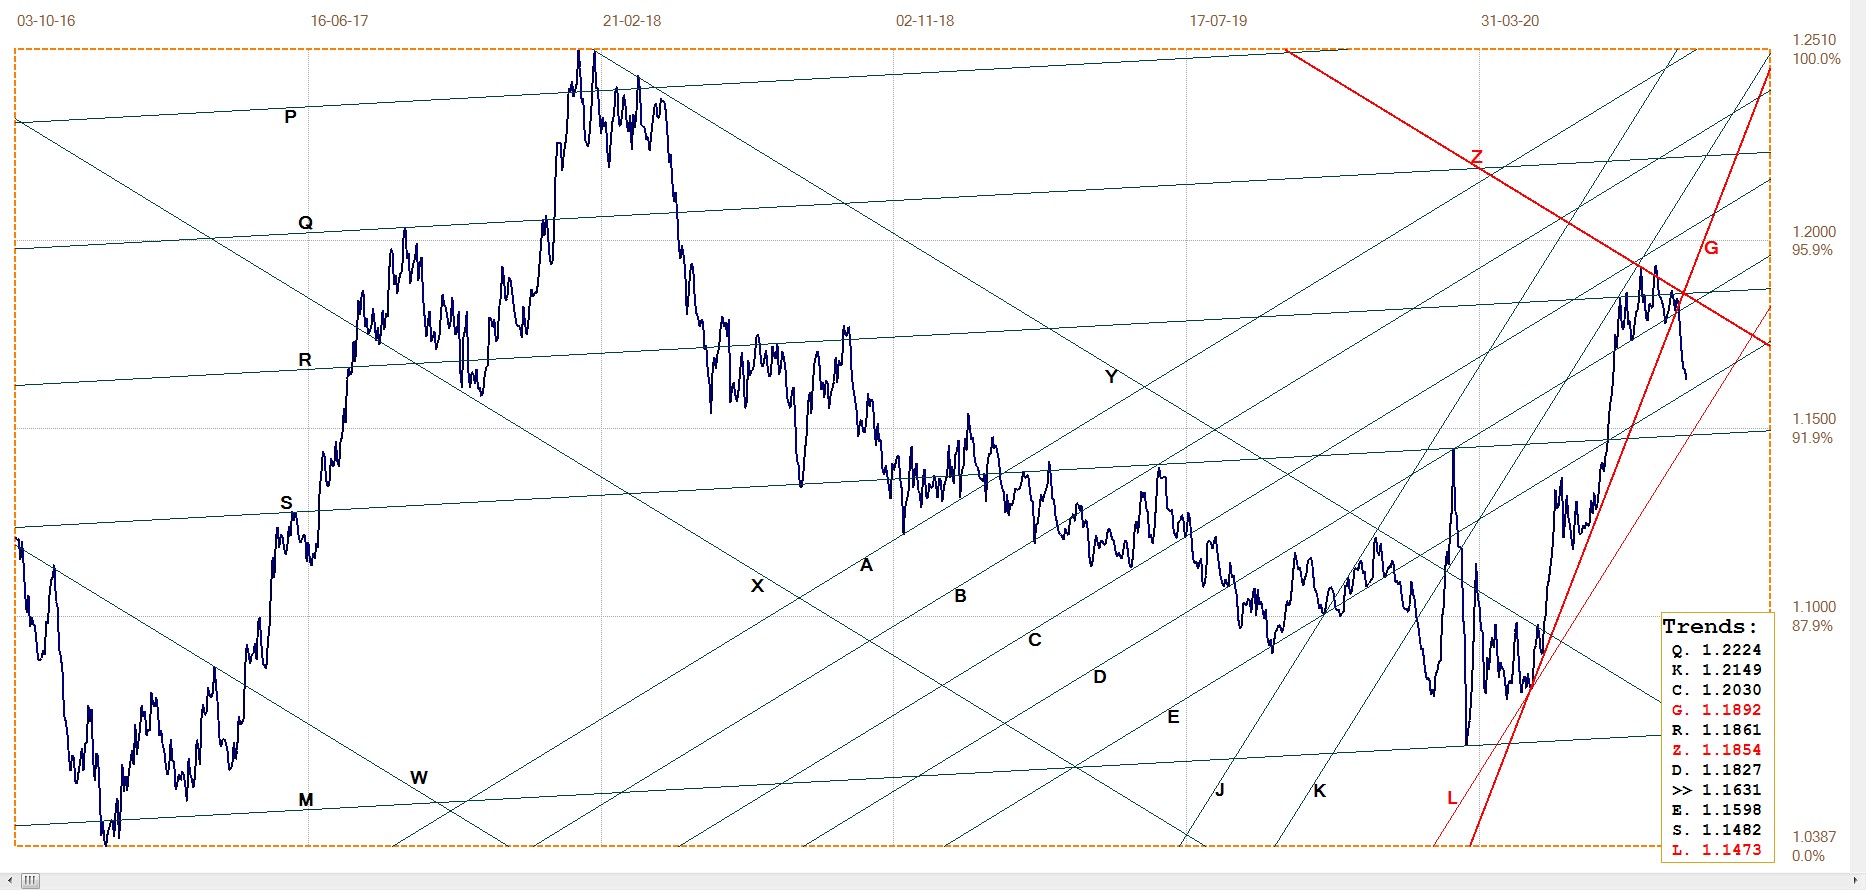
Euro– dollar, last = $1.1644 (www.investing.com )
DJIA Daily close
After reversing lower off line U (28 828) and thereby failing to reach a new high, the DJIA turned bearish, holding below the resistance of line G (27 750). After the steep fall on Wednesday, the DJIA rallied twice, but failed to challenge line G. Until a further rally can break above this trend line, the outlook remains bearish.
With about 5 weeks to go before the election, the question is whether Wall Street can be kept near current levels – or higher! – to assist towards a Trump victory.
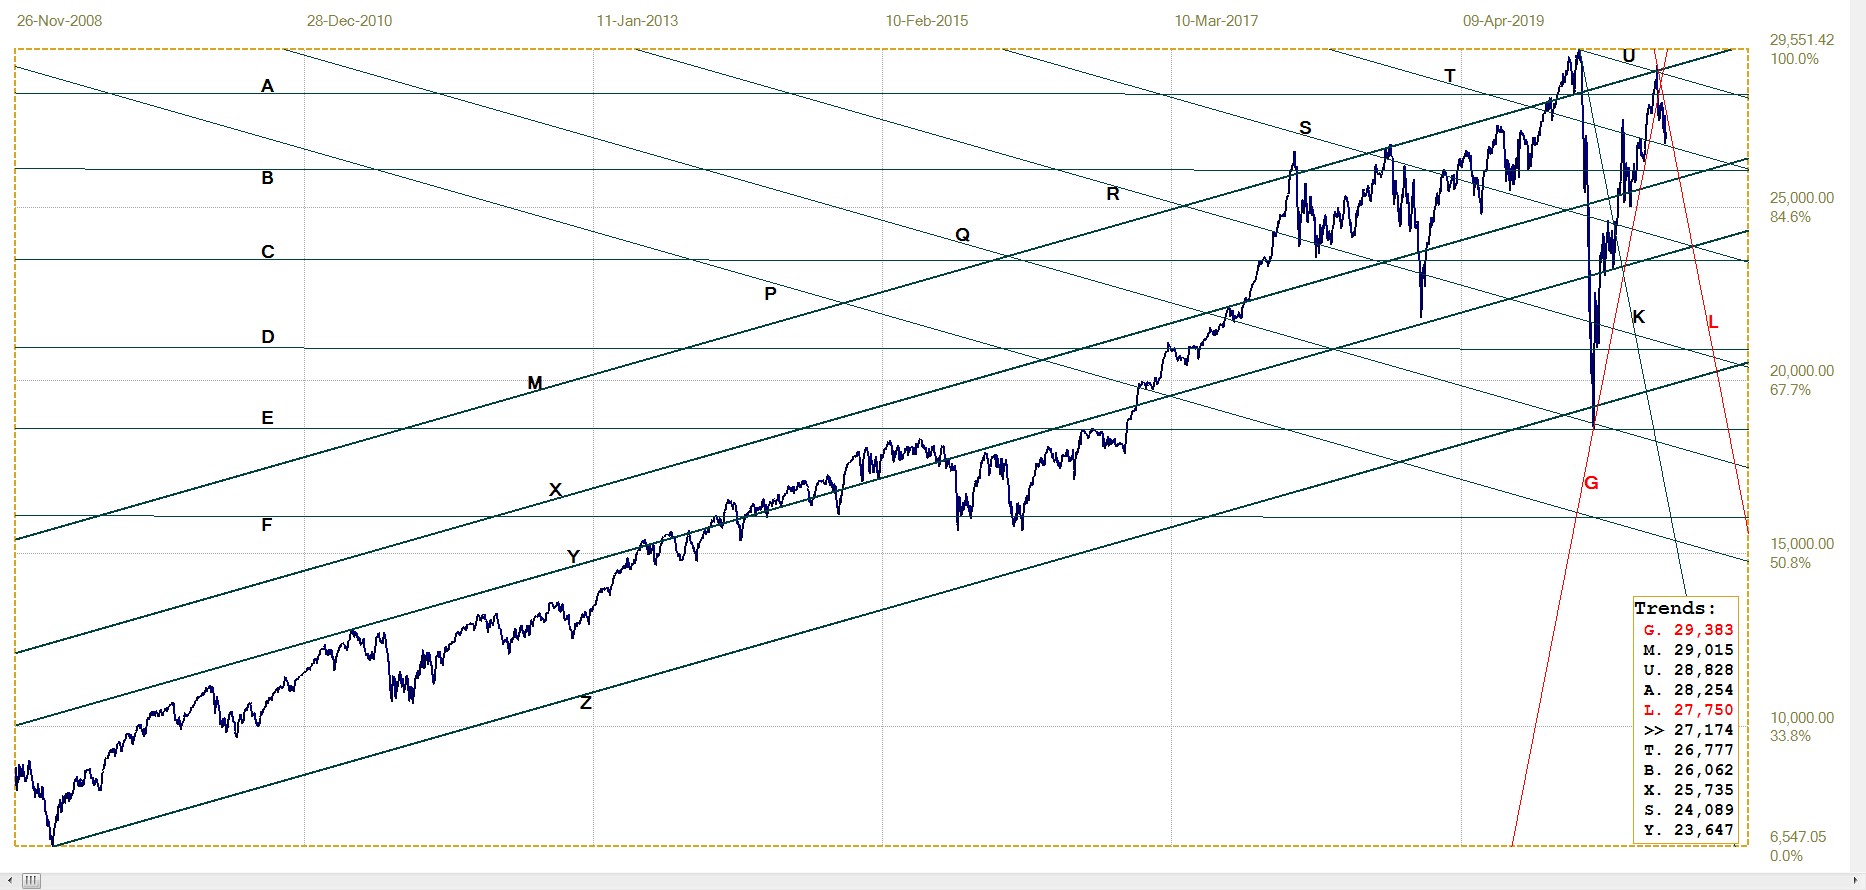
DJIA, last = 27173.963 (money.cnn.com)
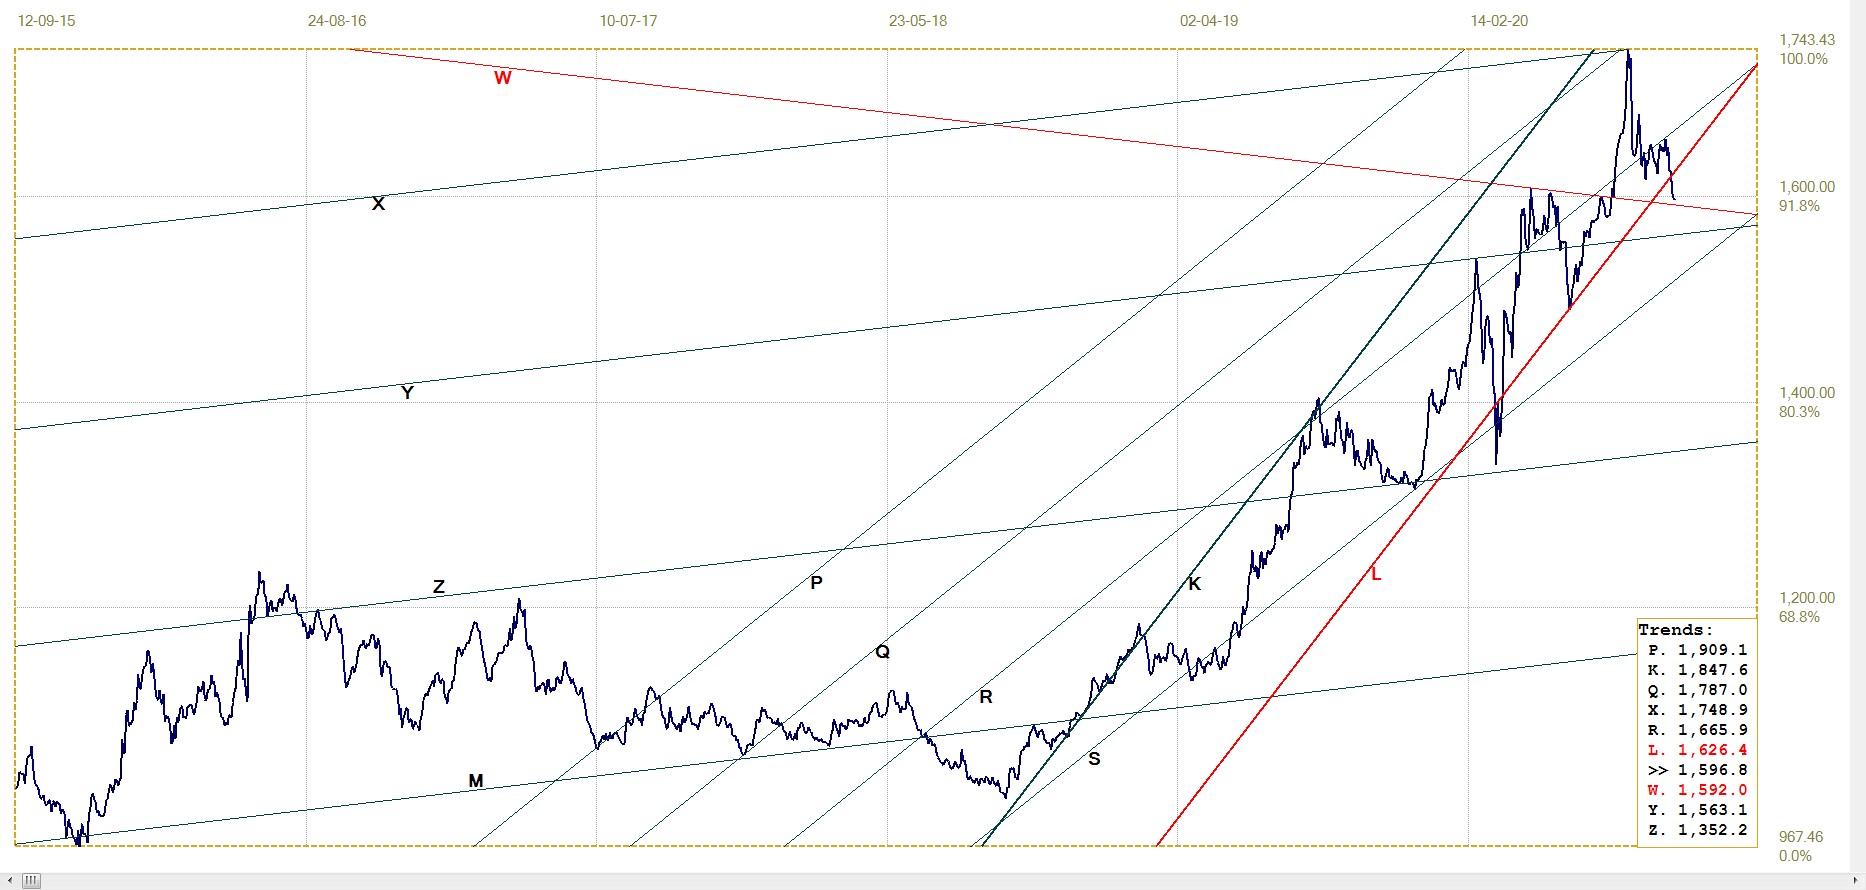
Gold London PM fix – Dollars
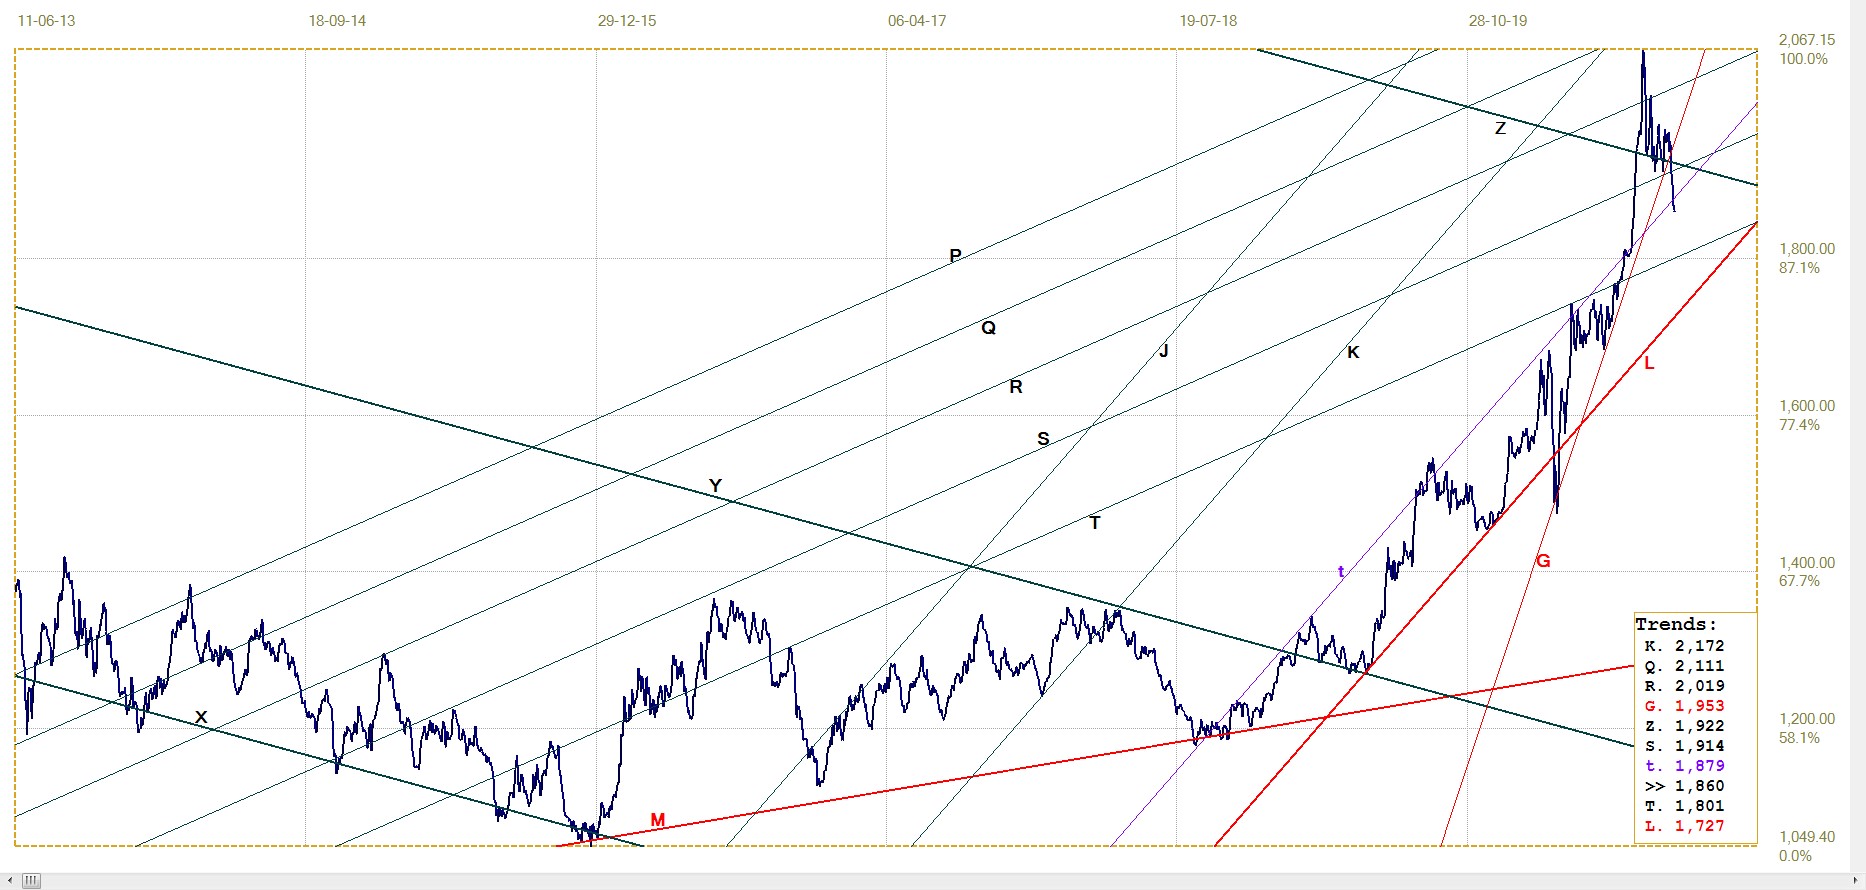
Gold price – London PM fix, last = $1859,70 (www.kitco.com)
Gold failed to hold within the consolidation that was taking place mostly above lines Z ($1922) and G ($1953) and plummeted to break below temporary line t ($1879)
within bull channel JKL. The outlook remains sideways to more bearish while gold holds below the resistance of line t in terms of the London PM fix.
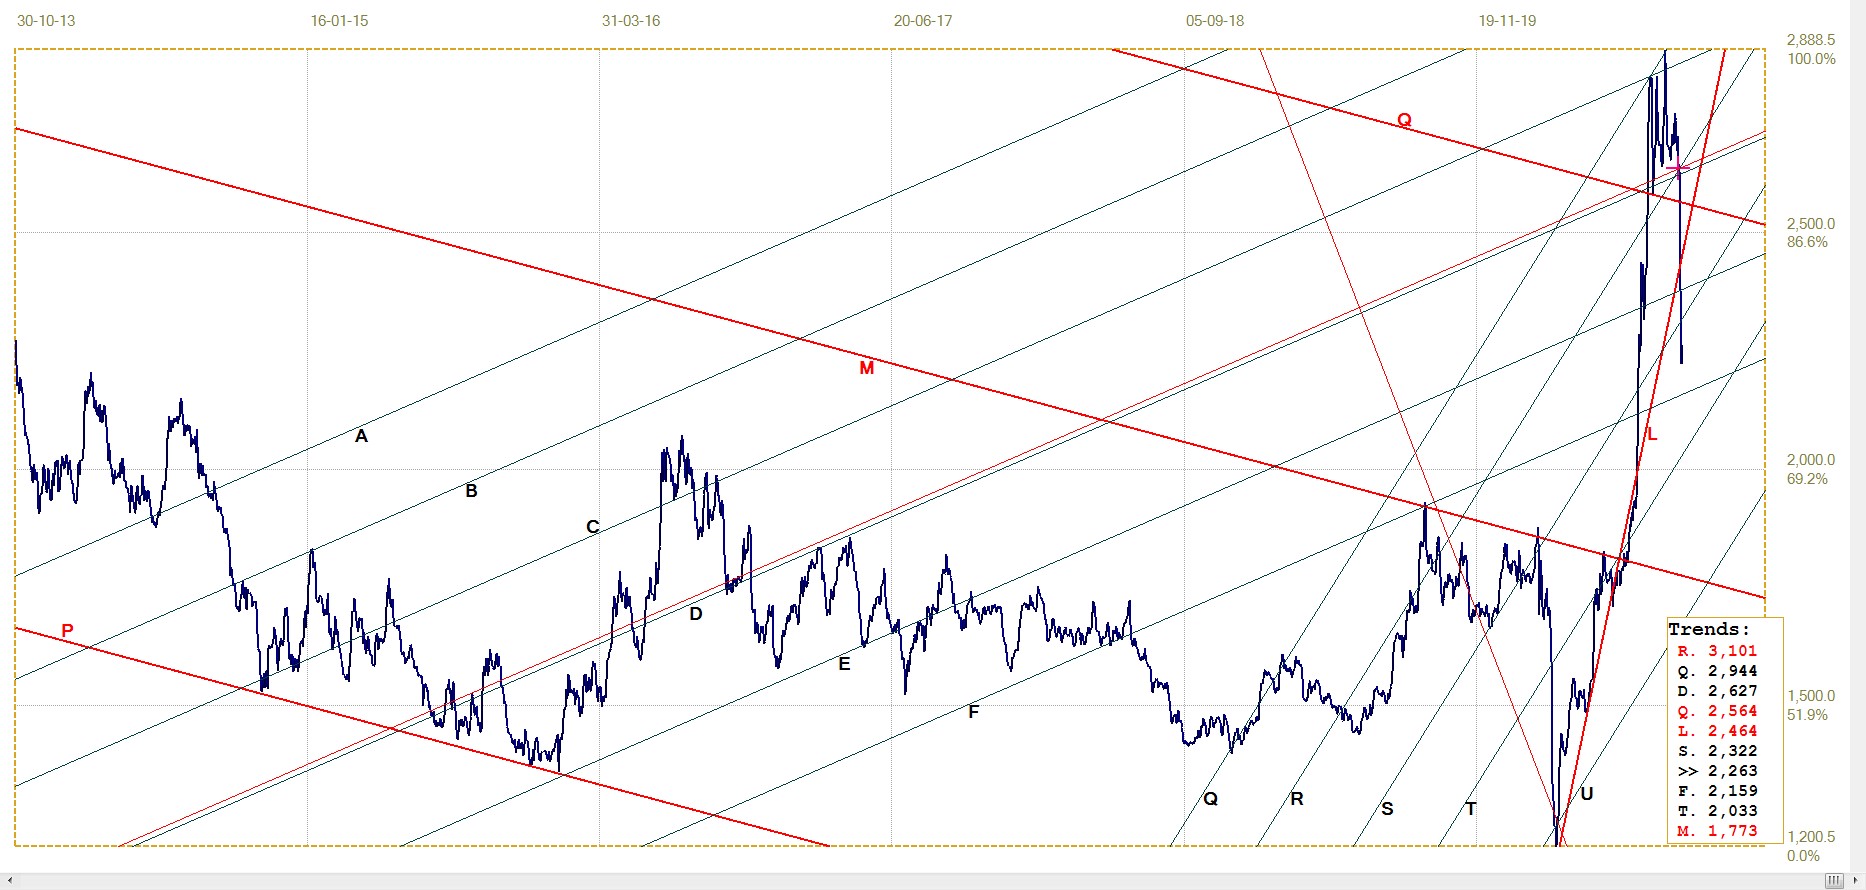
Euro–gold PM fix
The euro price of gold improves when the euro loses value against the dollar and it gains when the dollar price of gold improves. If these changes react proportionately to the change in the dollar, the effect on the euro price of gold is minimal. The fact that the euro price of gold has again broken below its bull channel KL (€1.626), for the second time since the March attack on the metals, shows that the drop in the price of gold was more severe than the effect of the stronger dollar.
There is nearby support from line W (€1.592) which implies a possible recovery – as happened in March – once the price of gold can recover from the attack.
Euro gold price – PM fix in Euro, last = €1596.75 (www.kitco.com)
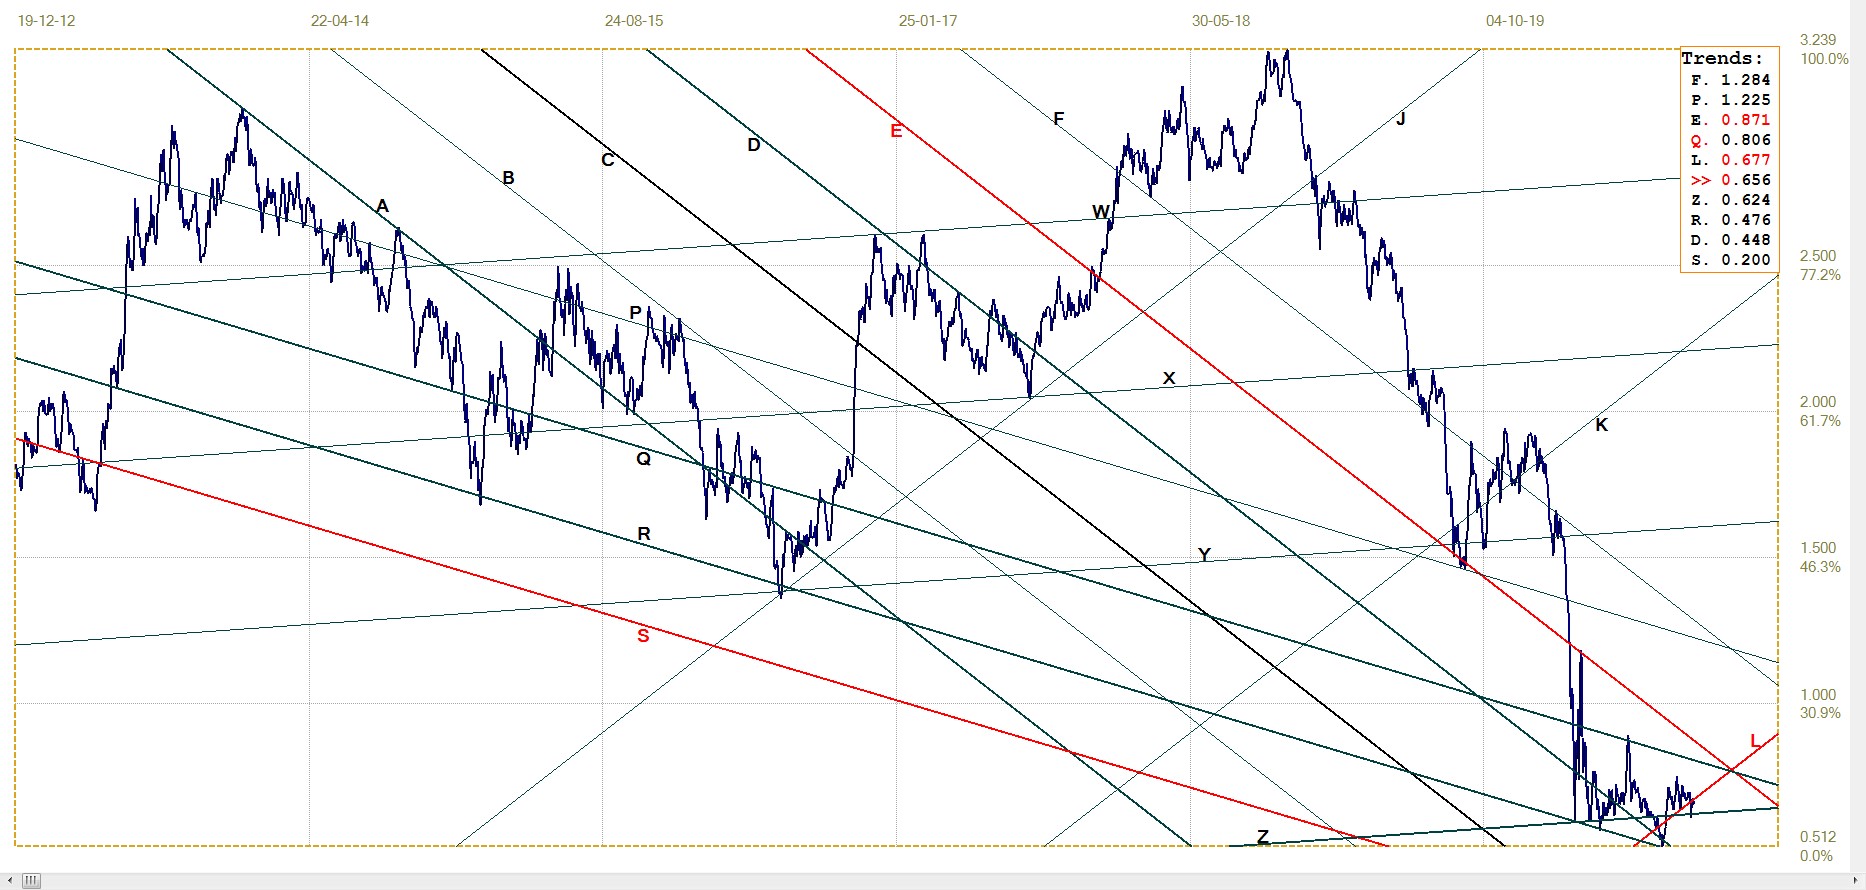
Silver Daily London Fix
Poor silver again bore the brunt of the attack, as discussed earlier and had also happened in March. Based on this evidence, ons can again presume that when the prices of the metals break free, silver will outperform gold for some time to come.
Silver daily London fix, last = $22.63 (www.kitco.com)
U.S. 10–year Treasury Note
U.S. 10– year Treasury note, last = 0.656%
With line L now located to fit the chart while also ensuring that line J divides the broad channel JL into two equal halves, the new break below the channel shows potential for the yield to move lower. That implies that a break below channel XYZ – which has the Fibonacci ratio, is possible.
Should that happen, the yield could move substantially lower before reaching line R (0.476%), which is nevertheless still well above a test of the 0% level before the yield can go negative.
West Texas Intermediate crude. Daily close
The price of crude has held in a narrow range for some time – perhaps because of uncertainty about the progress of the pandemic and what kind of lasting effect it will have on the economy. The future of the price of crude depends on whether the recovery will by V- ir L-shaped and over which time frame this will develop. For the time being, it looks as if resistance along line L ($42.68) will keep the price within bear channel KL.
********


