The End Of Wall Street’s 35 Year Bull Market?


Last week we saw that gold and silver were both looking good for the near to medium term future. What happened last with the two metals, however, did not live up to the promise hinted at by the technical analysis, with the prices coming under renewed pressure as the week progressed. Wall Street did not fare much better, with the last two days seeing the DJIA losing a total of 1391 points or close to 4% to look distinctly bearish.
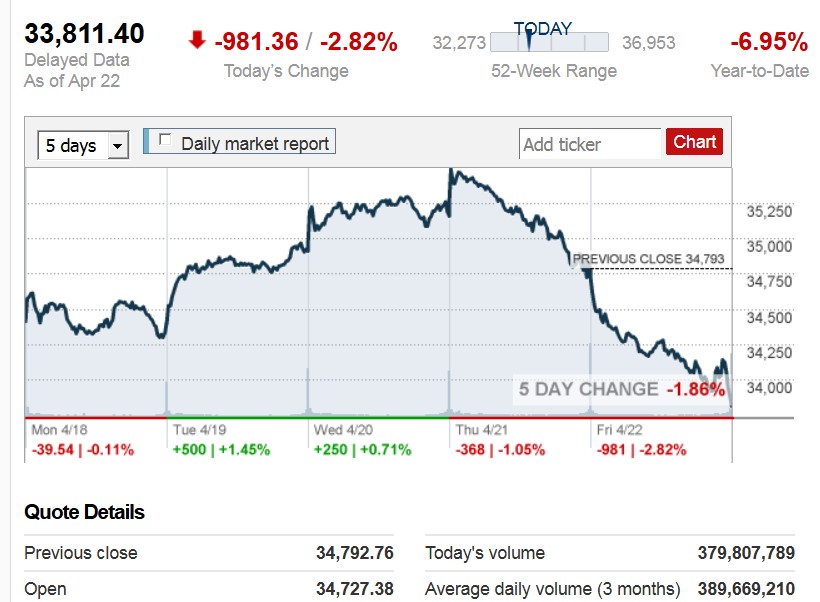
The CNN five day review of what happened to the DJIA last week shows a weaker start to the week, with a loss of 39 points. This loss shook the stock market support to wake up and get stuck in again, ramping the DJIA higher by 750 points over the next two days. Thursday was the converse again, with a DJIA rally at the market open that soon fizzled out into a long slide that ended near the low for the day. Friday began with a sell-off and never looked as if the familiar steep intra-day rallies would begin. A brief bounce or two later in the day failed to take hold and the market ended steeply lower in the last half hour. No sign of the also so familiar closing rally to cut the loss.
Wall Street had erased earlier weakness during most of April and it looked as if the stock market was comfortable at these high levels, until the surprise steep decline last week. The sudden change in market behaviour now appears as a warning that the 37 year old bull market that had started after the 1987 Panic Crash might be over. This prompted a look at long term charts of the DJIA, S&P500 and the Nasdaq composite.
As has been mentioned before, I do research on structure in financial market prices and am currently busy with a second paper. My main premise is that prices develop a channel structure that often obey certain ratios between neighbouring channels. These ratios are the 500:500 ratio of a main channel that is evenly divided, the Fibonacci ratio of 382:618, a few round number rations, 400:600, 300:700 and so on. Channels in the r=structure are gradient sensitive and in the charts below two different gradients defined as tangents to the charts are used for each of the two channel sets, as defined by trend lines A and X in each case. The charts present monthly averages.

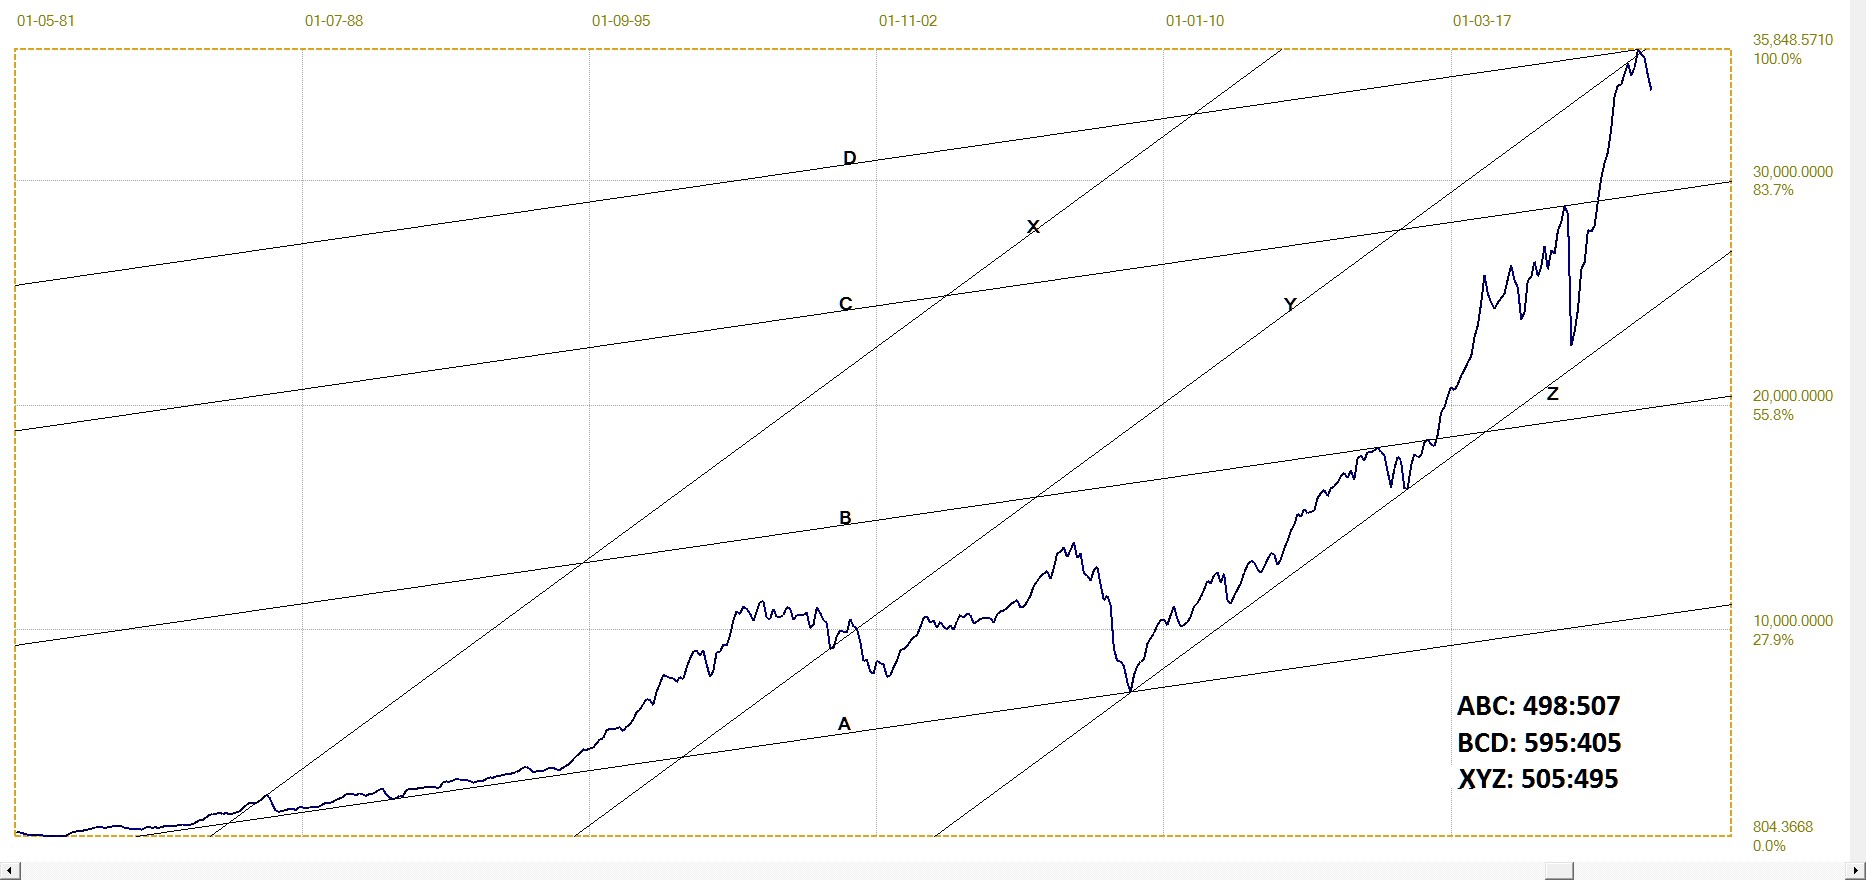
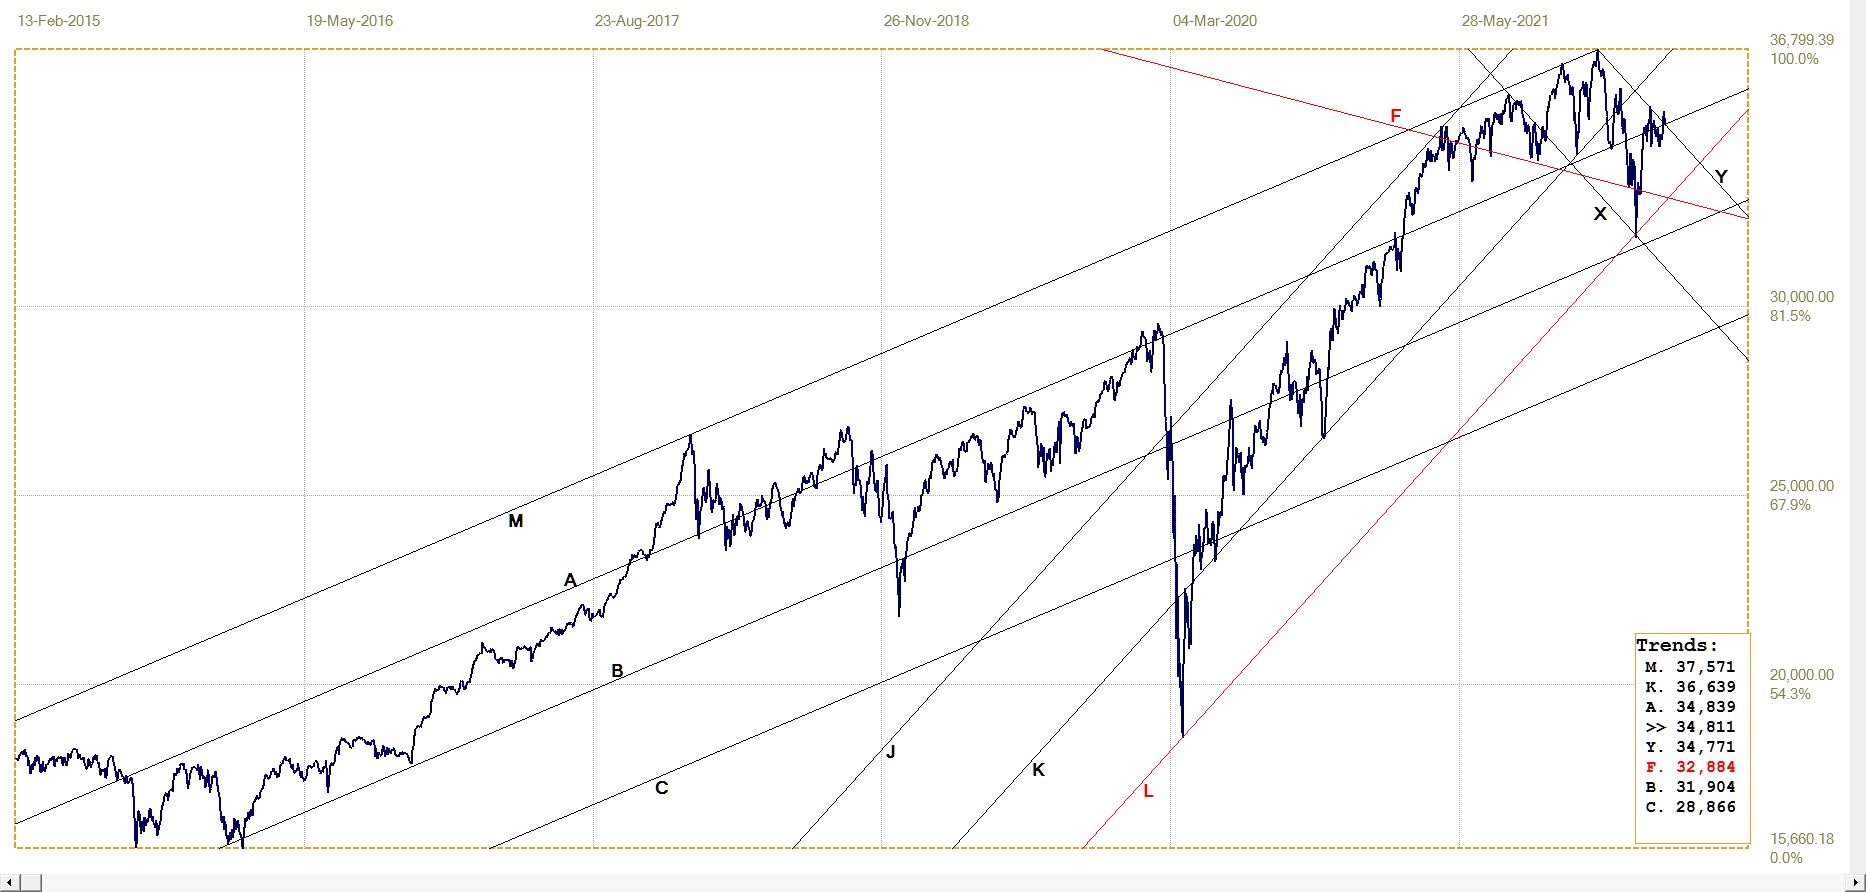
DJIA. 1-1-1981 to 1-3-2022. Last = 34 029.74
The ratio of channel pair ABC is close to the 500:500 ratio, with a bit of an overshoot before returning to break below line C again – a possible warning that the top of the bull market has been reached followed by the reversal lower. The ratio of channel XYZ differs by one point in the third place from the Fibonacci ratio. Any further decline in the DJIA wil break back into the lower half of the main channel to confirm the signal from channel ABC. Note than using the tangents to define the two gradients means that there was no analyst preference in selecting a gradient that would deliver the desired result.
It has been observed in several time series of market prices that when the market does not hold to significant chart patterns it also is a market where intervention from outside the market is suspected. This points to the break above line C as possibly the main vehicle for Wall Street’s manipulation.
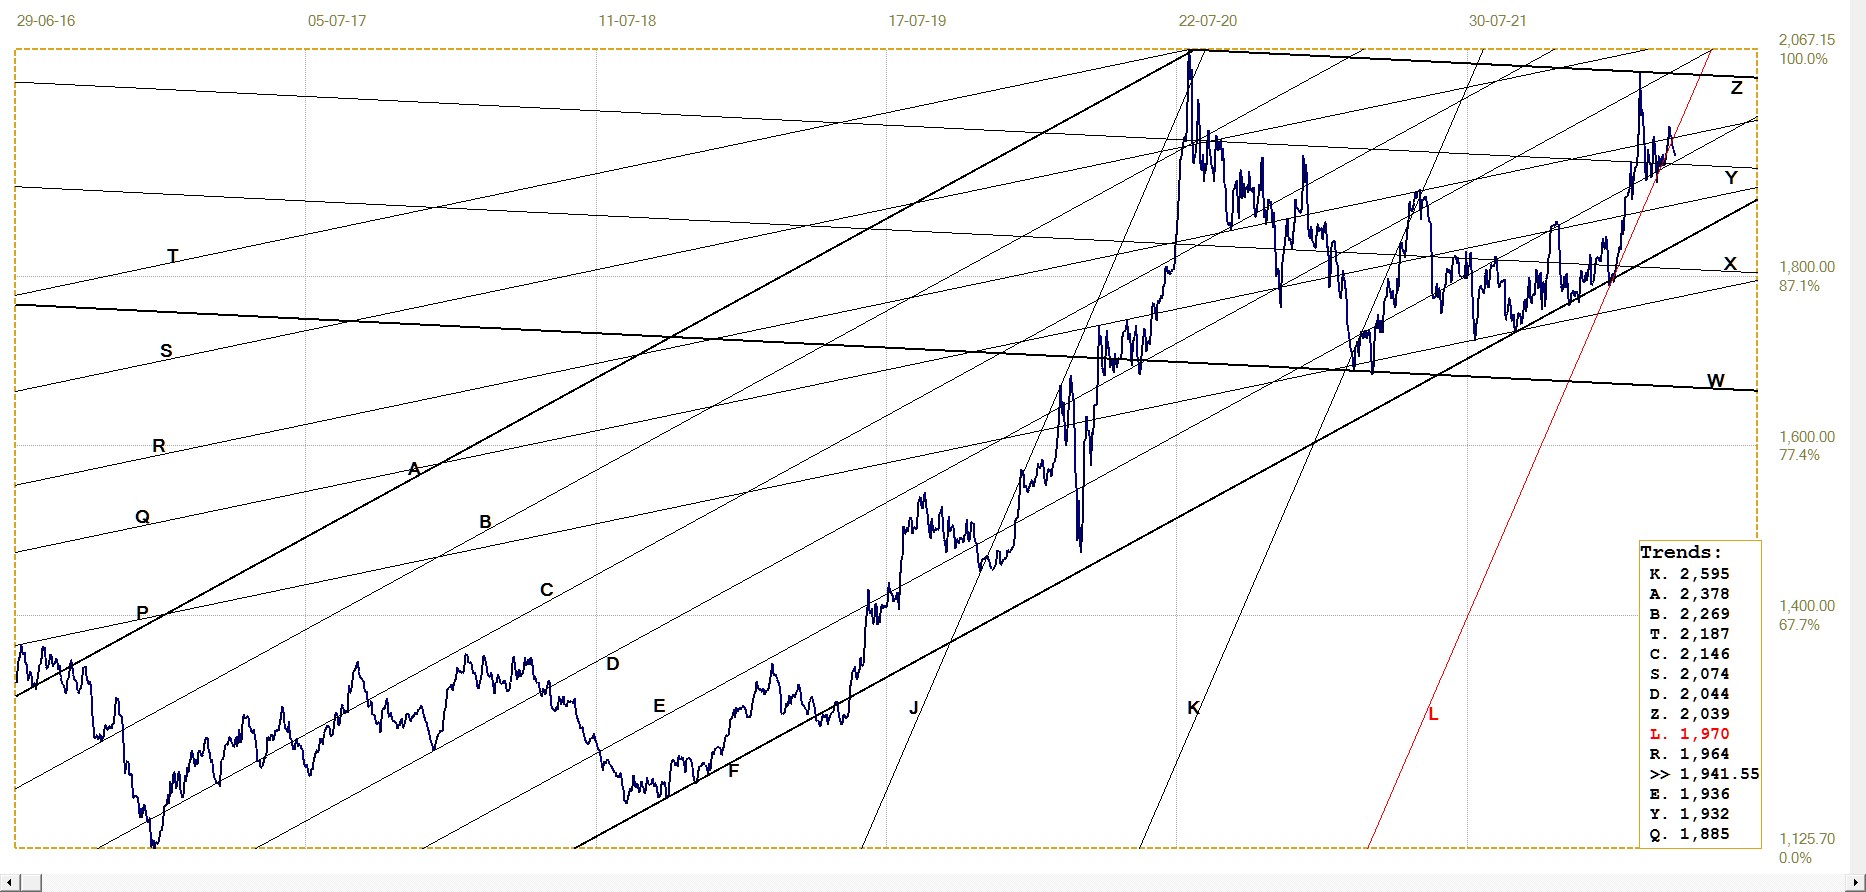
The two channel sets of the S&P500 also have gradients defined as tangents to the chart. Channel set ABCD consists of two overlapping channel pairs, ABC and BCD, which means that the locations used to define lines B and C affect both channel ratios. The analysis is therefore less amenable to manipulation.
S&P500. 1-7-1972 to 1-3-2022. Last = 4391.27
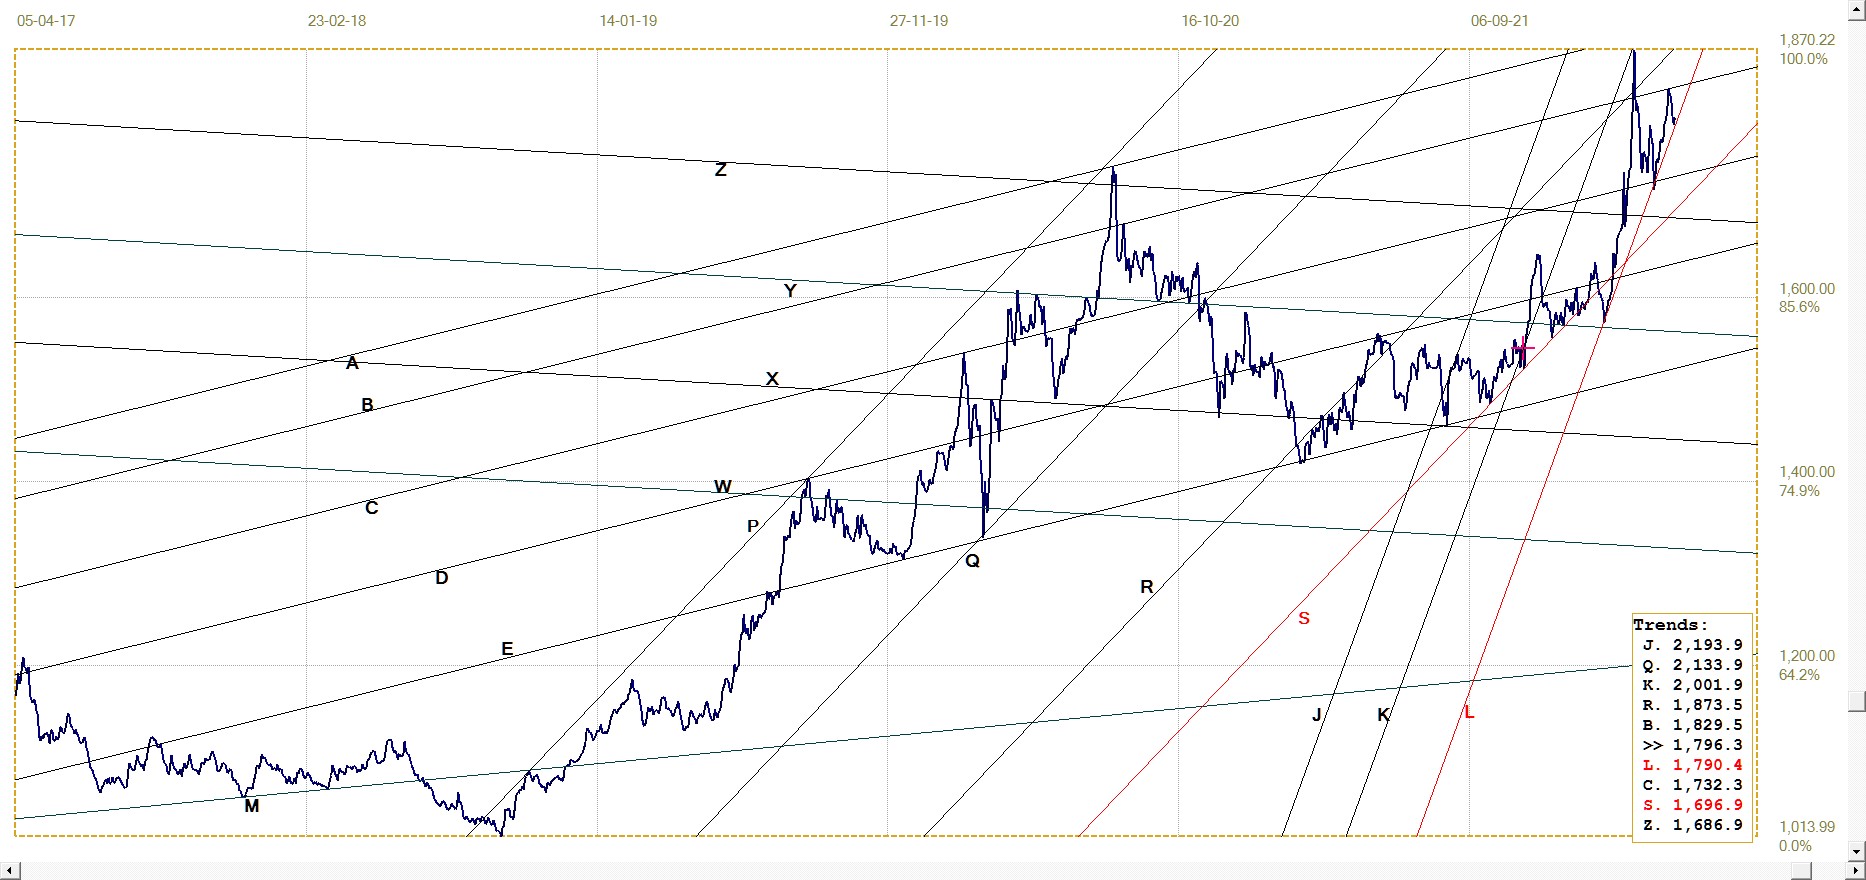
Suitable anchor points for the derived trend lines are significant lows and highs, with highs that at some time were temporary all time highs being particularly important. Line B in the DJIA chart is an example of being located in such a temporary all time high. Another important point is an M-shaped top or W-shaped low. Even when small in relation to the chart, these patterns show the price maneuvering between two key preferred gradients of the time series. Line B in the Nasdaq chart is an example.
Channels ABC and XYZ of the S&P’s chart are also examples of the 500-500 ratios, with channel BCD close to the 400:600 ratio. Here the S&P broke marginally above line Y to reach the level where channel BCD could be completed before reversing lower again. The break back into channel YZ also has a bearish bias.
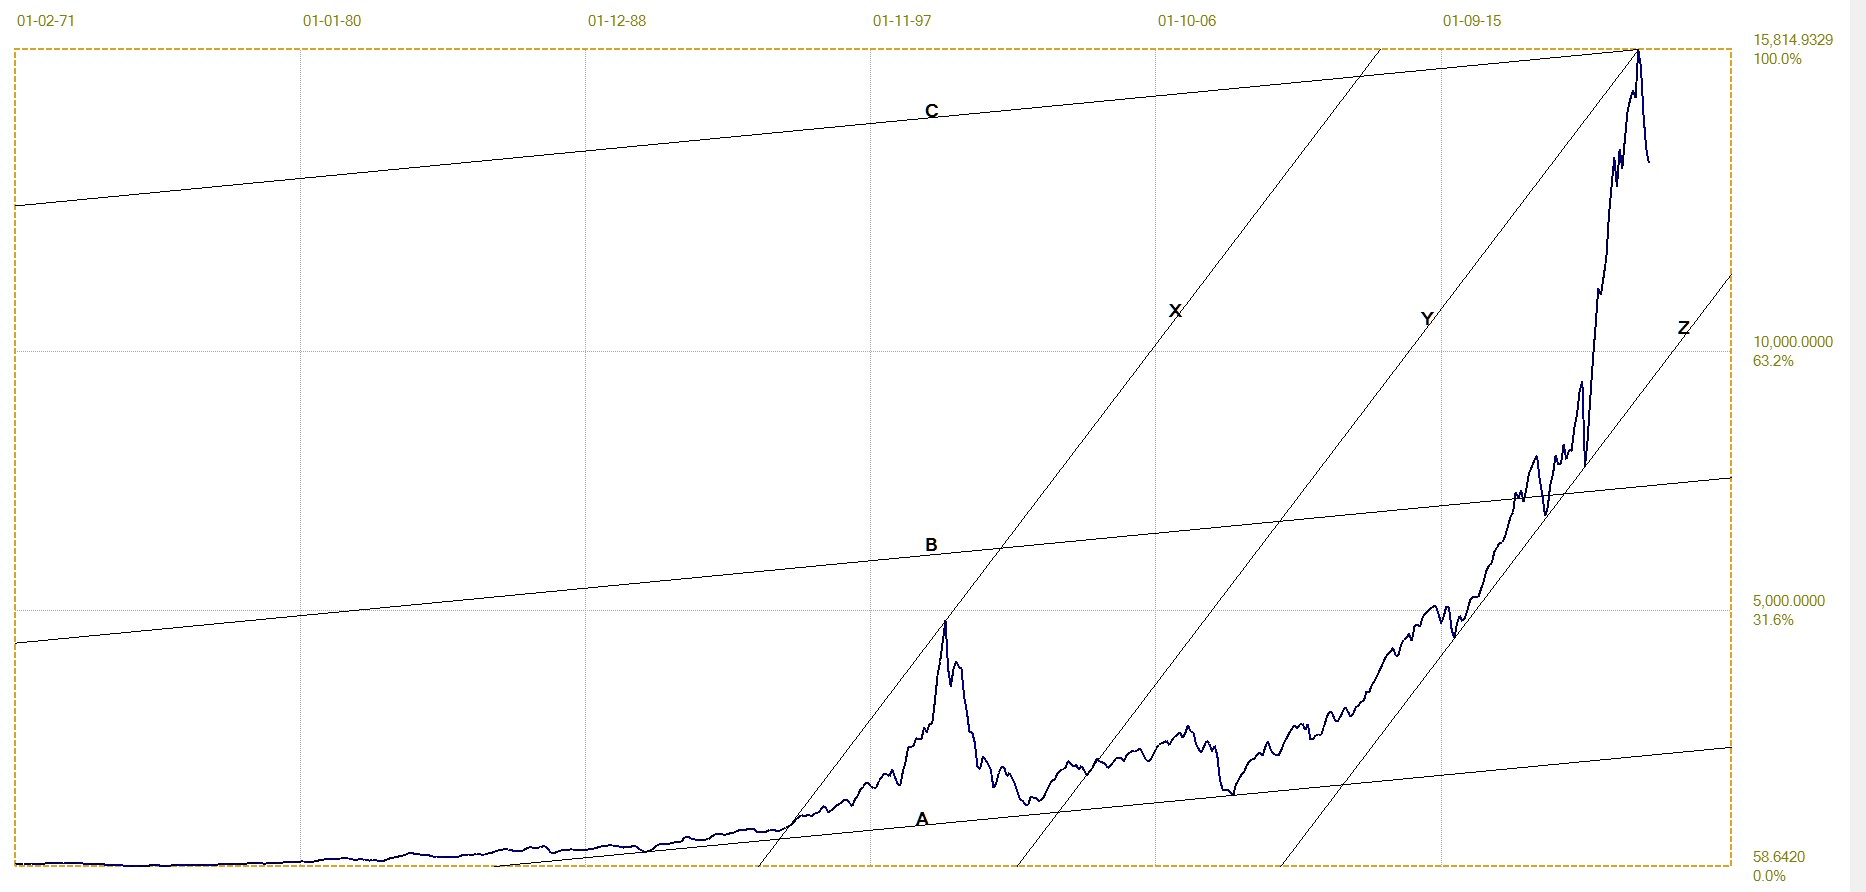
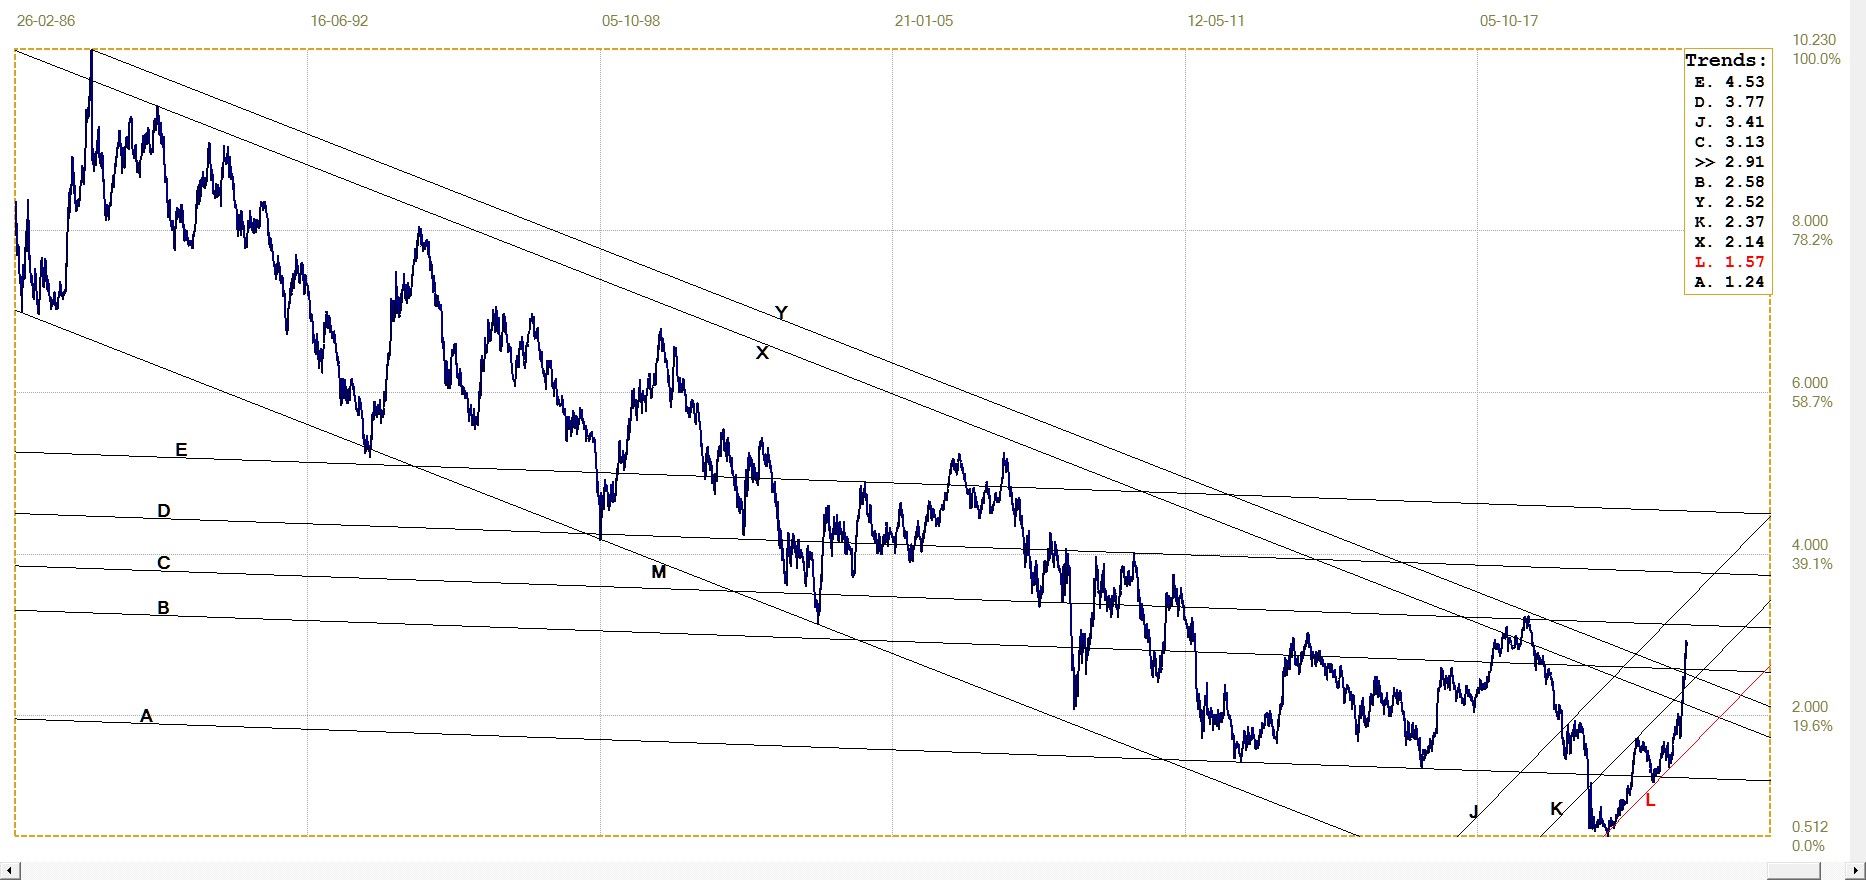
Nasdaq Comp. 1-2-1971 to 1-3-2022. Last = 13 623.26
On the chart of the Nasdaq, the two channel ratios are the exact Fibonacci ratio of 382:618 with channel XYZ again close to being evenly divided. Line Y is located in the low of August 2004. This was the low point reached during the 78 month period from March 2002 to October 2008 and only looks like a minor blip against the full scale of the chart. In terms of the monthly averages, it represented a 13.2% decline from the high in January of 2004. Similar to the S&P500, the Nasdaq also broke marginally above the YZ channel in order to complete the move to the top of channel ABC.
At Friday’s daily closing values of 34811.4, 4271.8 and 12839.3 for the three indices, Wall Street has rallied from the March monthly averages, while the Nasdaq is lower during April. It is only the DJIA that stands any reasonable chance to remain in the upper channel of XYZ te retain or recover a bullish bias. Whether it does so might depend very much on what happens during this last week of the month. If the DJIA were to hold above line Y, it might be only temporary given that the broader markets now have a clear bearish bias according to the above analyses.
Monthly charts tell the long story and the above does not mean that matters on Wall Street will come to a head soon; it could be some months still before the warnings of a steep collapse driven by panic arrives – if the authorities do lose the financial power to reverse such a steep bear trend as they had done successfully in 2008, 2018 and March of 2020 and in less flamboyant fashion for many months now. The last days of last week warn of a weak start to this new week, but whether that will happen is a moot point. It will not surprise to see Wall Street futures open very bullish in Asia early Monday morning.
It also looks as if the gold and silver markets require some more time to assimilate what has changed because of the Russian reactions to the sanctions, which favour higher prices for the precious metals. It is also evident that the sanctions and other measures instituted in reaction to the invasion of the Ukraine will present severe problems should there develop a situation where there are any attempts to ‘normalise’ relationships with Russia again. Then add Covid-19 and the WEF. An interesting rest of 2022 lies ahead.
Euro–dollar. Daily close
With the dollar index now holding above 100, the conclusion has to be that it is again becoming important as a safe haven, given expected turmoil in the global monetary system as inflation takes hold in different countries at different rates – exacerbated by the reduced supply of food and energy because of the ongoing war in Ukraine.
The euro has reached and held – so far – at a level of medium term technical support, but with Europe more directly exposed to the effects of the invasion and the reaction of the West than the US, it is not certain that the support will hold. However, should the euro rebound off line M to begin a new rally, this would point more to increasing problems in the US rather than a lessening of the problem for the countries in Europe.
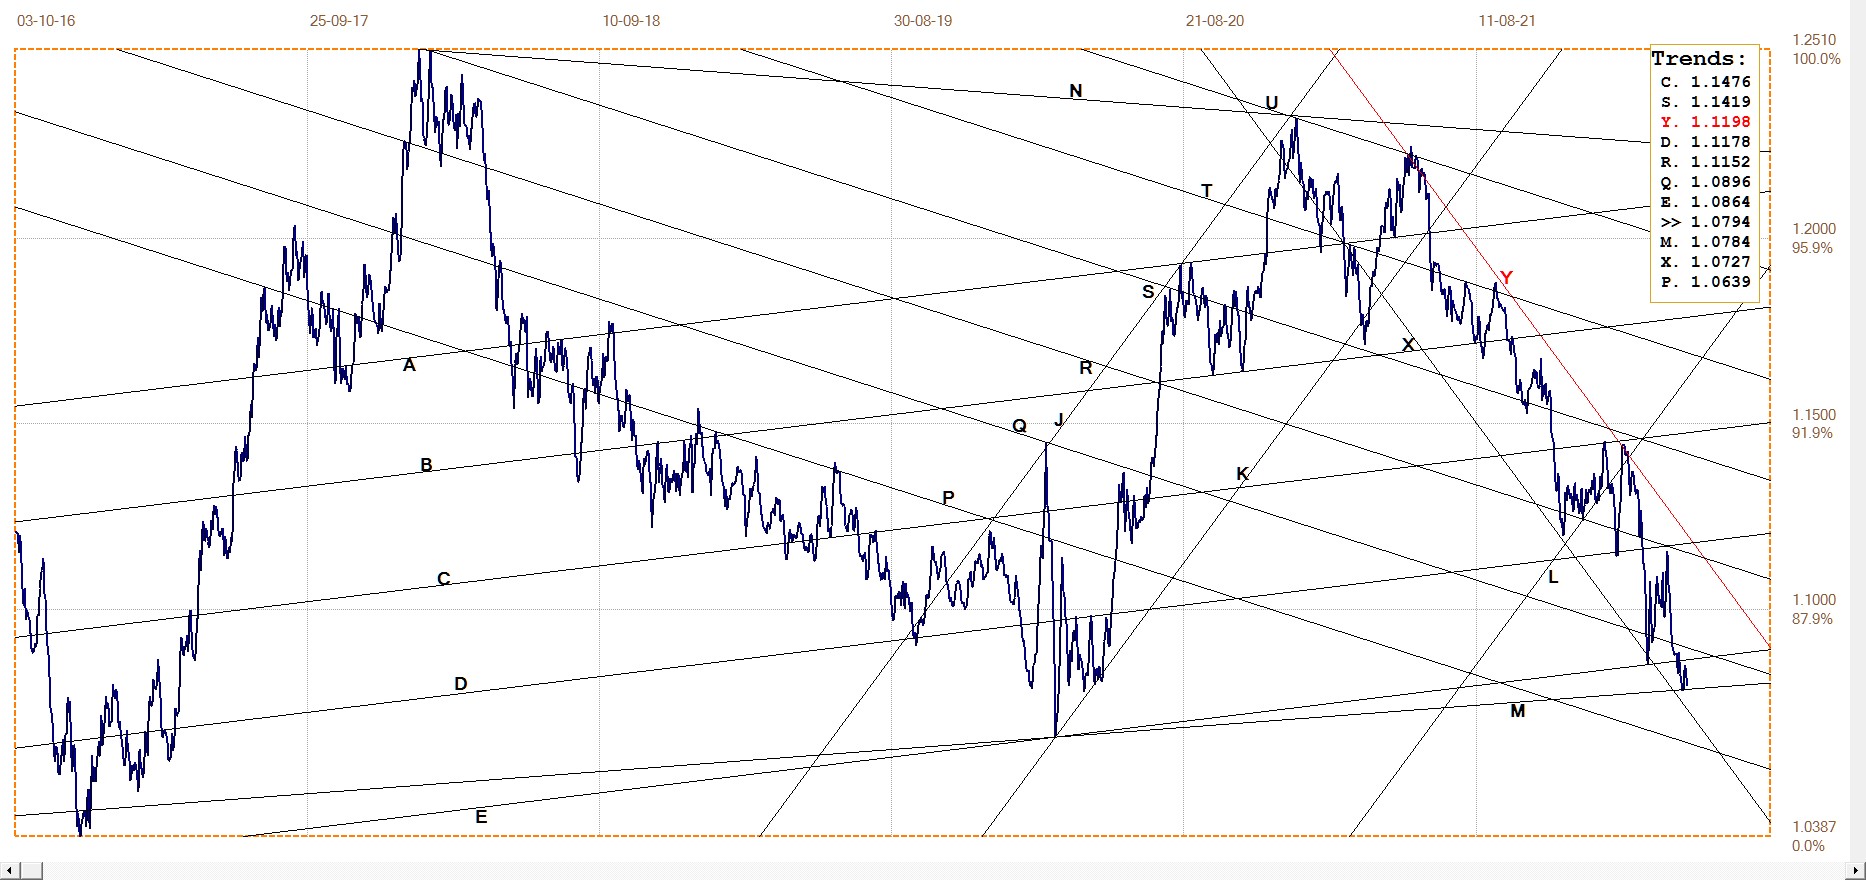
Euro–dollar, last = $1.0794 (www.investing.com)
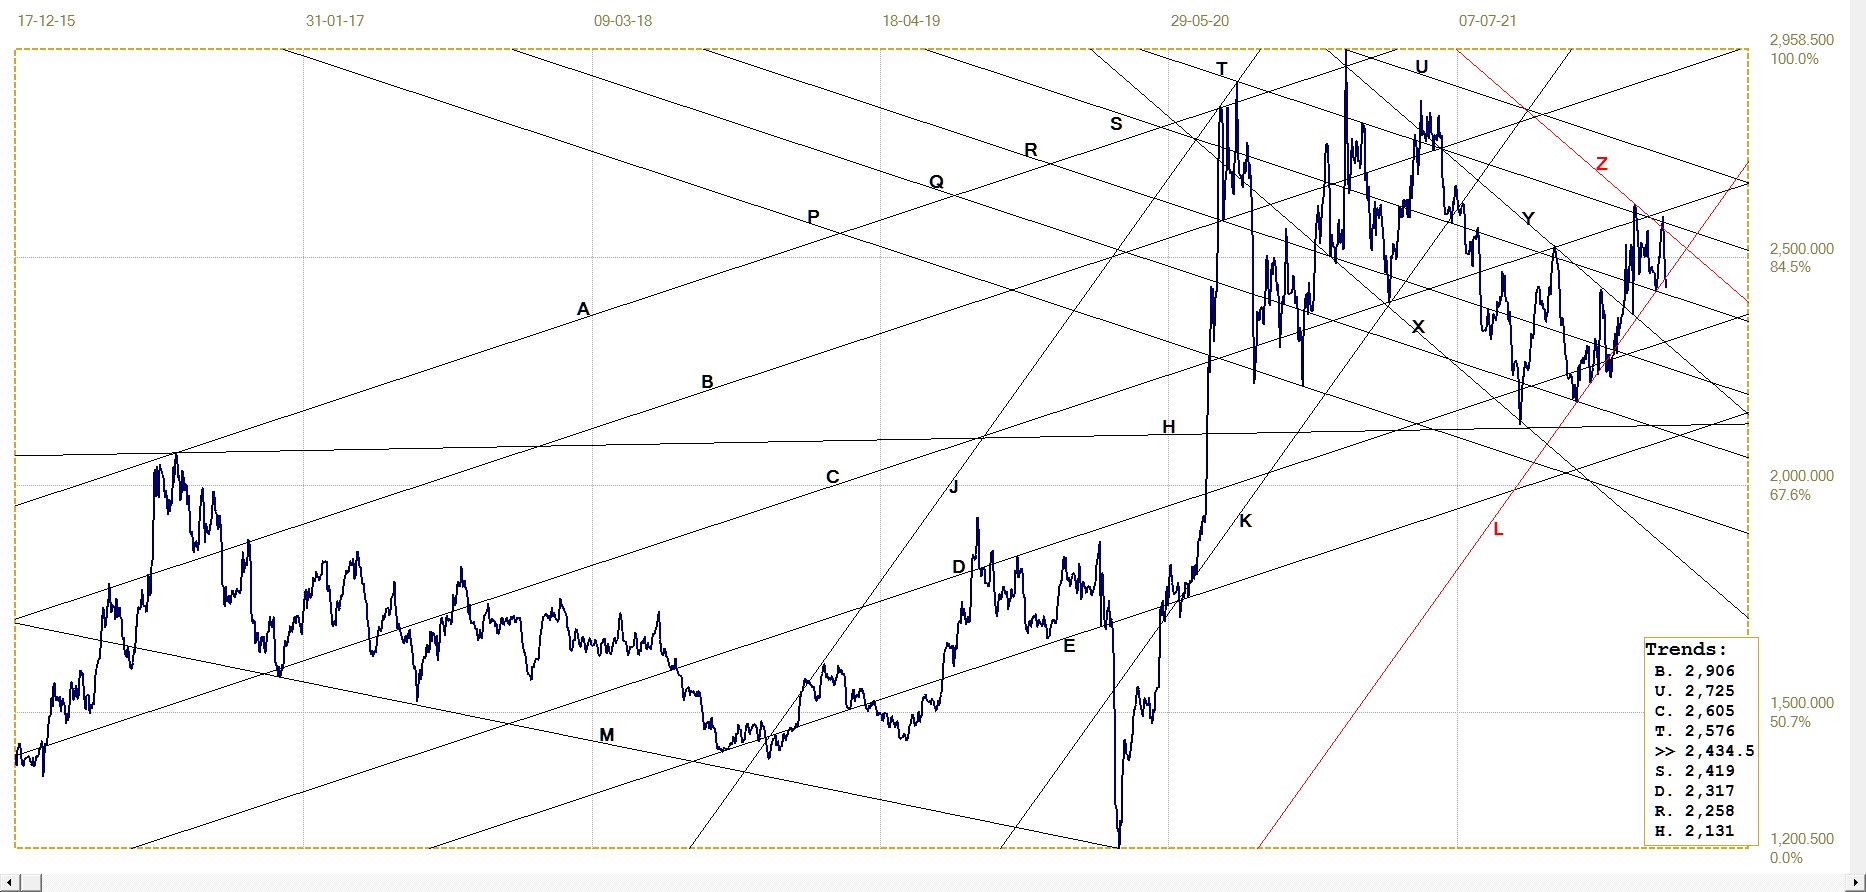
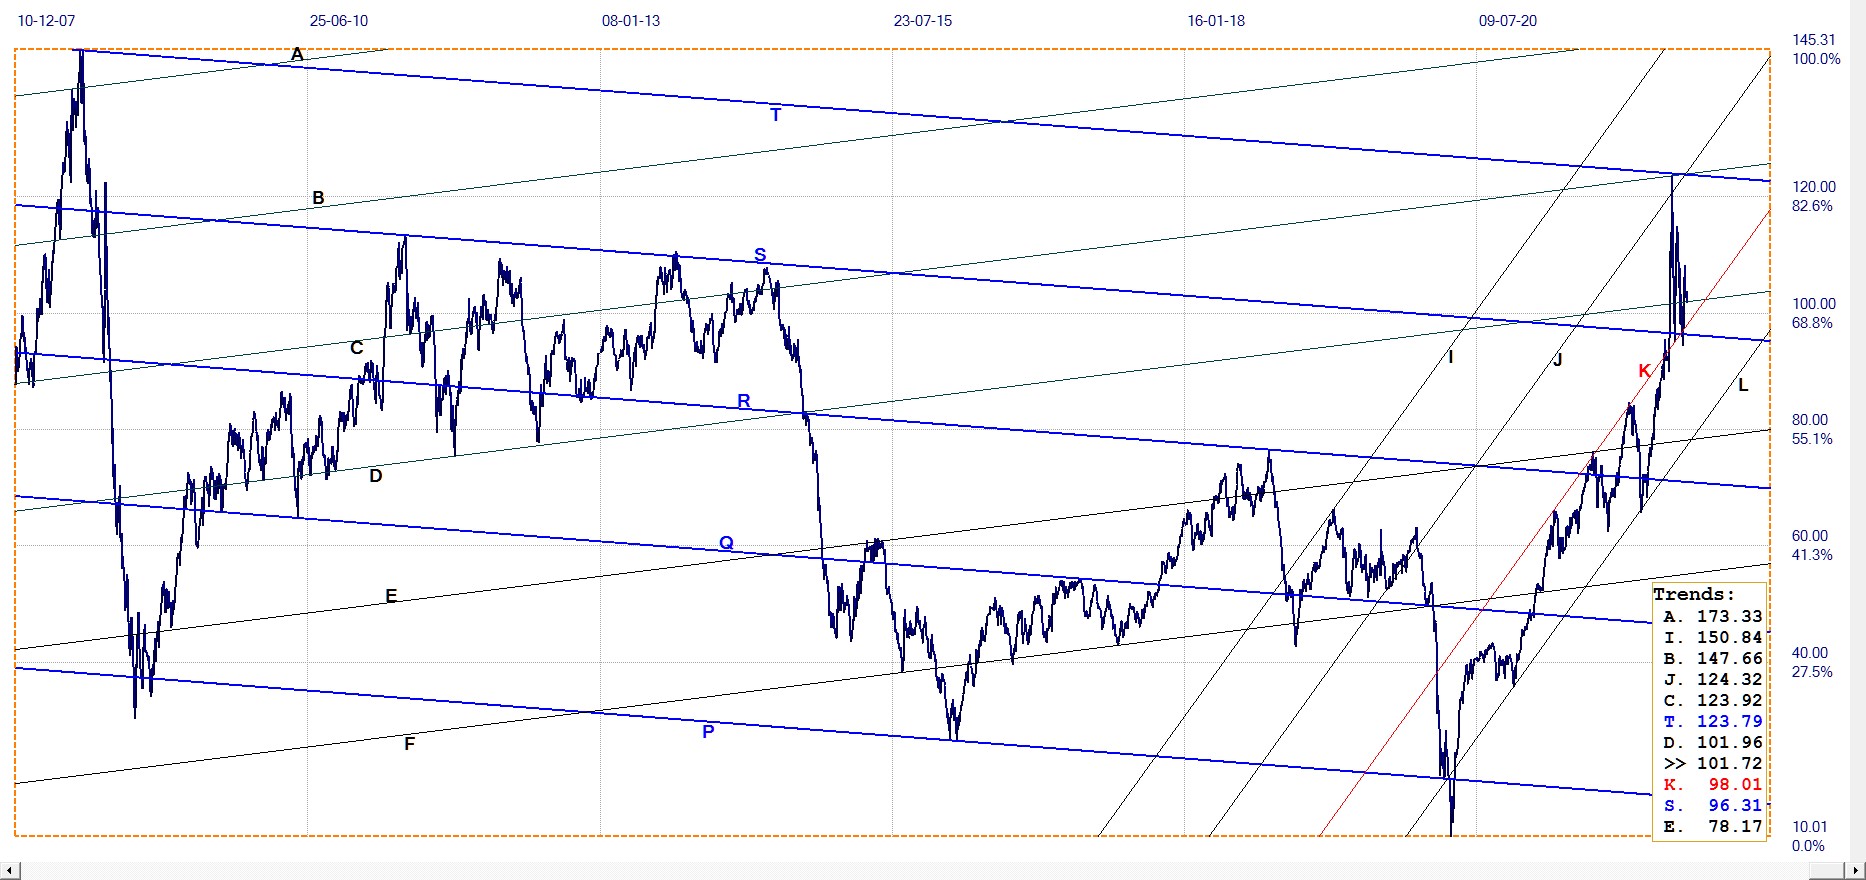
DJIA daily close
DJIA last = 34811.40 (money.cnn.com)
Channel XY has a shallower gradient than the bear channel in last week’s report. The DJIA has broken higher from that steeper bear channel XY after the latest rally kept it within bull channel JKL and back above line F. A brief break above the new channel XY after a tight consolidation did not extend higher, with the DJIA now back at line Y.
A rebound higher after a goodbye kiss on line Y could see the market moving higher this week, implying that the Big Buyer on Wall Street is still using the DJIA to steer the stock market. A definite break back into bear channel XY will be confirmation that the bear trend is still intact despite its gradient being shallower than the previous channel had shown.
Gold London PM fix – Dollars
Gold price – London PM fix, last = $1941.55 (www.kitco.com)
The previous shortened week was a good one for gold, holding to channel KL and breaking above line R. Then last week the selling pressure intensified to bring the price back down low line R and also below channel JKL. This week with April moving into its final week with month end shenanigans on Comex due to repeat – and the pressure last week perhaps aimed at preparing for the assault his week - the price of gold could see further downside.
That support at line Y will be tested is quite possible. The key signal of further upside potential to be realised will be if the support at line Y manages to hold intact.
Euro–gold PM fix
The euro price of gold also slumped as could be expected from a sharply weaker dollar price for gold. However, with the euro holding mostly steady against the dollar, the damage to the price was not as severe as for the dollar price. Here the price managed to hold quite well at or above the steeper gradient of channel KL, within the broader but shallower bull channel RS.
The price is getting squeezed between the support of line L and resistance of line B. How it behaves this week with respect to the two trend lines will provide a technical hint on what could happen during the month of May – which was when last year’s strong rally in the prices of gold and silver took off.
Euro gold price – PM fix in Euro. Last = €1796.32 (www.kitco.com)
Silver price. Daily London Fix
The price of silver was also attacked, perhaps in preparation for the April month end sports. The effect was that the steep decline in the price has also broken marginally below the bull channel JKL – as has happened once before, but then only with limited extent and duration. The break therefore is as yet not a significant threat, provided it does not extend much lower or last too long.
Silver is not as tightly linked to events in Ukraine and the resulting sanctions and the new threats of boycotting Russian oil and gas. On the other hand, further retaliation by could also bring silver into the ambit of the trade and political war being waged in the background to the shooting going in the east of the Ukraine. Putin knows full well that silver could be an even more potent economic weapon than gold in the ongoing battle with the West and the US.
Silver daily London fix, last = $2434.5
U.S. 10–year Treasury Note
10–year Treasury note, last = 2.905% (Investing.com )
The usual chart of the yield on the US 10-year Treasury note shows a very broad and extended sideways trend that reflects the very low interest rate environment of the US during the past period going on for two decades. The post 9/11 period, exacerbated by the 2008/9 financial panic, has made a low interest world the norm.
Most decision makers in the financial and business world who are younger than, say, 40 years have no experience of living and working in a world of inflation and higher interest rates. They will have to learn and adapt quickly before they remain stuck in an outdated mind-set, making decisions that only achieve poor results and unwanted side effects. This applies perhaps most of all to people in authority who have suffered the effects of high inflation in their youth, but now that they are in control have come to believe ‘things are ‘different’. Interesting times are waiting just around the corner!
West Texas Intermediate crude. Daily close
WTI crude – Daily close, last = $101.72 (www.investing.com)
The price of crude has stabilised mostly above $100/bbl, probably in response to the release of oil from the national reserve and removal of some restraints on new drilling.
The one cannot last long enough to have much effect and the other will require more time to add much to supply. It won’t be only cooking oil that gets more expensive!
© 2022 daan joubert
********


