The Euro vs the Dollar at a Critical Juncture


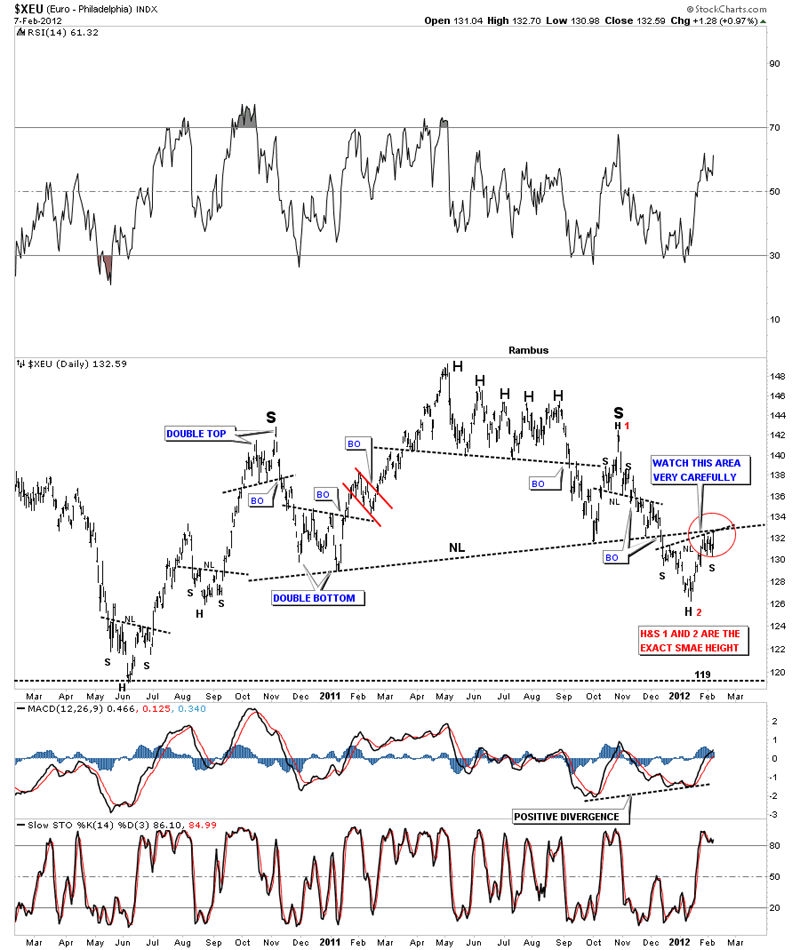
The Euro is now at a critical test of resistance at the old neckline of the one year H&S top. It's just as important to know when a good pattern works and when they fail. You can see the big H&S top, on the Euro chart below, along with a lot of lesser degree H&S patterns. The dollar has an inverse look to the Euro's H&S top with its own H&S bottom. So what the Euro does will have a direct impact on the dollar and visa versa with the dollar. If we can get the direction right for the Euro and the Dollar that solves the biggest question of what direction the stock markets, commodities and the precious metals are likely to travel. When the neckline was broken to the upside in early December all looked good for the Dollar and bad for the Euro. We have now rallied all the way back up to the neckline as a backtest for the Euro. Normally this would be the end of the story as the backtest is the last step in the breakout process. Note the little inverse H&S bottom on the lower right side of the chart. If that little inverse H&S plays out that will put the price back above the big 1 year neckline negating the big H&S top. As you can see we are now testing the big one year neckline from below. Don't be surprised if we see a big gap up in the next day or two. This Euro chart is telling us that if we start trading above the big one year neckline, that for the time being, the can is going to be kicked down the road for the foreseeable future and all will be right with the world again.
Euro 2 year daily look showing small inverse H&S bottom forming just under big one year neckline, red circle on chart.
Below is a chart of the US dollar and its big one year H&S bottom, inverse look to the Euro. As you can see on the dollar chart it has already broken back down below the neckline that should have held support on the backtest. There is also a small red bear flag that has formed just below the neckline which is a bearish setup if the bottom red rail gives way. Note the big negative divergence on the MACD at the bottom of the chart.
US dollar with its own H&S pattern that is inverse to the Euro.

I think the stock markets and gold are already telling us that the dollar is going to keep going lower in the intermediate term, and the Euro is headed higher. This will confound many that are calling for an imminent correction in both the stock markets and the precious metals...
To Subscribe to Rambus Chartology and see Rambus' 10 Favorite PM Stocks and a World of Charts and Projections including the Chartology Forum where Rambus answers your Questions and even Charts your Favorite PM Stocks by Request, go to : www.rambus1.com
 Meet Rambus, a seasoned trader and technical analyst renowned for his unbiased and insightful chart work. Through his website, Rambus Chartology, and Substack newsletter, Rambus shares his expertise with a global community of subscribers, providing daily updates, commentaries, and hands-on training in the art and science of chartology. With his calm, humble, and down-to-earth approach, Rambus demystifies complex market trends, helping his followers navigate the challenges of today's volatile markets. Join the Rambus Chartology community today and discover a unique blend of technical analysis, trading expertise, and time-tested protocols. Subscribe now at www.rambus1.com or https://rambuschartology.substack.com/


