Fed’s Recessionary Indicators And Gold


How likely is a recession in the United States? Predicting a recession is difficult, but one can make some nice money with a good forecast. Consequently, we invite you to read our today’s article, which discusses the most important recessionary models developed by the Fed, and find out what do they imply for the gold market.
How likely is a recession in the United States? Predicting a recession is difficult, but one can make some nice money with a good forecast. So let’s focus on the most important recessionary models developed by the Fed.
The first model is the smoothed recession probabilities for the United States developed by Marcelle Chauvet and Jeremy Piger based on the research published in the International Economic Review and Journal of Business and Economic Statistics. The odds are obtained from a dynamic-factor markov-switching model applied to four monthly coincident variables: non-farm payment enrollment, the index of industrial production, real personal income excluding transfer payments, and real manufacturing and trade sales.
As the graph below shows, the model’s past performance is quite impressive, as the predicted recession dates align well with the official NBER recession dates. However, the forecast is not always very timely.
Chart 1: Smoothed recession probabilities for the US from June 1967 to April 2019.
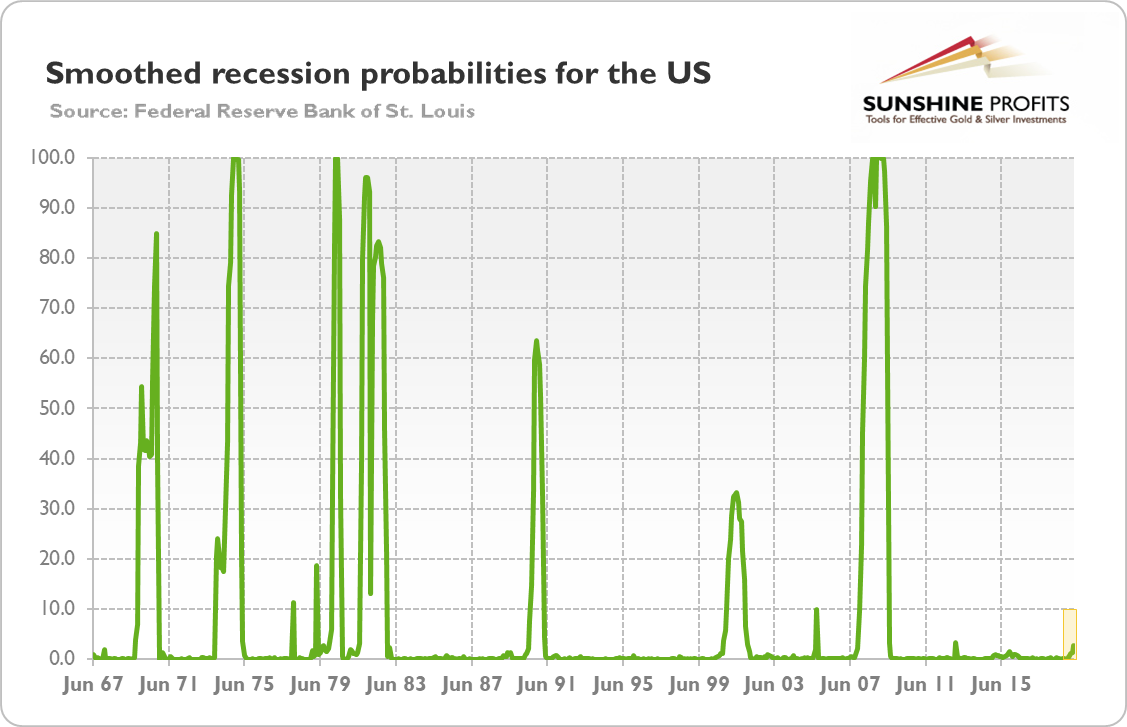
For example, in December 2007, when the Great Recession officially started, the odds of a recession were just at 10 percent. They increased to 23 percent in January 2008, 45 percent in February and jumped above 50 percent (to 60 percent) only in March.
And the probabilities of recession are available only with a two-month delay, which only aggravates the problem. Of course, the model is still better than the NBER which announced the start of the recession only one year later. However, a few months’ lag might be still too long for many investors.
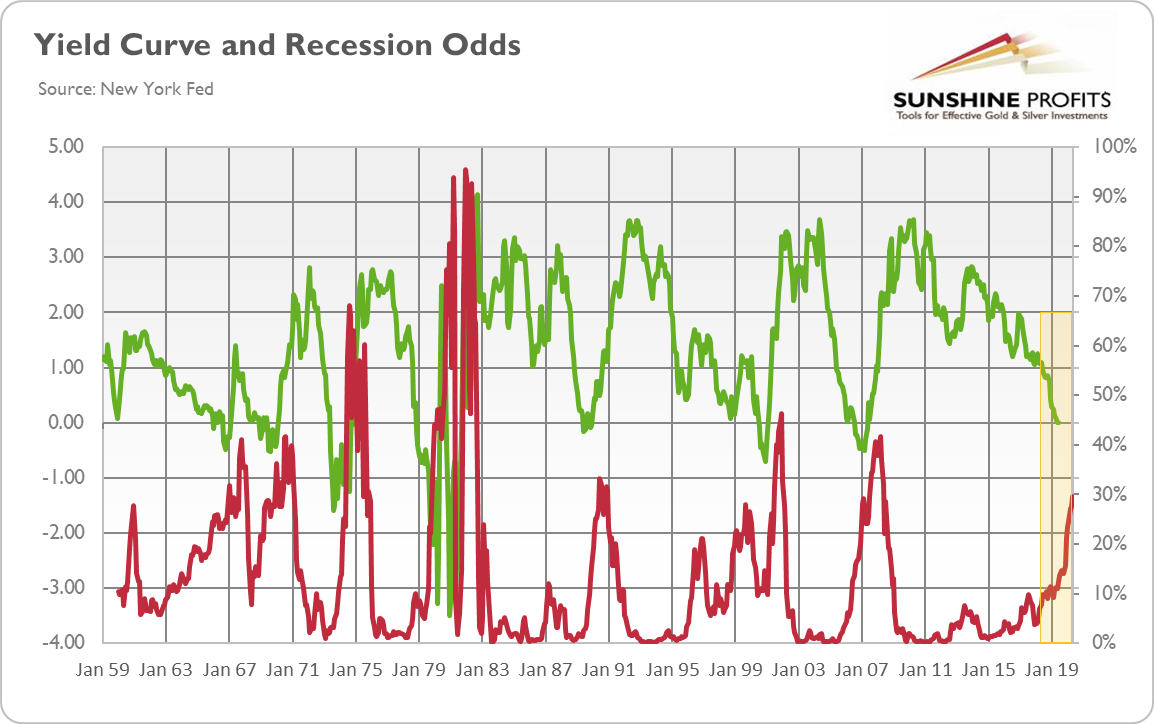
What is the model telling us right now? The odds of a recession have increased recently. Please take a look once more at the chart above. Can you spot the bulge at the end of the chart? It reflects the rise in recession probability from 0.02 percent in November 2018 to 2.68 percent in April 2019. Hence, the odds are still very low. However, if the upward trend continues and the odds jump above 20 percent, you could be almost certain that something ugly is about to happen soon. In contrast to the Smoothed Recession Probabilities, which are based on the NBER’s recession indicators, the other models that we will discuss build on the yield curve. The first one is the Yield Curve as a Leading Indicator from the New York Federal Reserve. It is the so-called probit model, which directly makes the probability of being in a recession four quarters in the future a function of the current value of the yield curve spread between the ten-year Treasury note and the three-month Treasury bill.
As the chart below shows, currently – with the spread around zero (based on monthly averages, not on daily numbers) – the model shows a 29.62 percent probability of a recession in America twelve months ahead. It means an important jump in recessionary odds from 12.51 percent one year ago.
Chart 2: Yield curve (green line, left axis, spread between monthly averages of 10-year and 3-month Treasuries, in %) and the derived recession probabilities twelve months ahead (red line, right axis, in %) from January 1959 to May 2020.
The second model is developed by the Cleveland Fed. It also calculates the probability of recession from the yield curve using the probit model. As one can see in the chart below, the model shows similar trend in the recession odds. They soared from 12.68 percent one year ago to 34.8 percent currently, even higher than in the New York’s model.
Chart 3: Yield curve-derived recession probabilities twelve months ahead (in %) from January 1960 to May 2020.
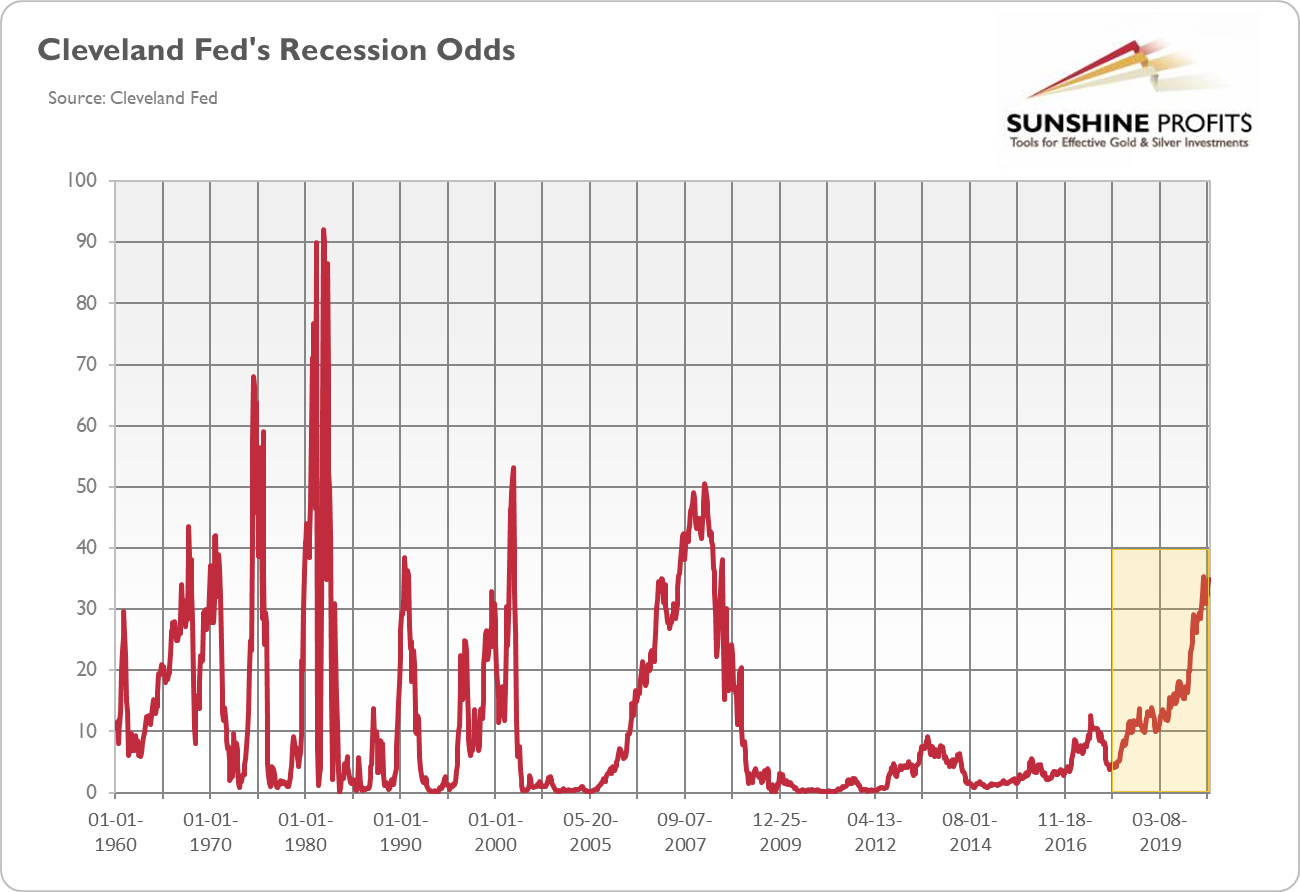
What do all these models imply for the U.S. economy and the gold market? As the economy is in a recession around 10-12 percent of the time, both the models show odds that are substantially greater than average. Actually, the odds at 30 percent or higher has tended to lead to a recession in twelve months, according to both models.
Hence, we feel obliged to inform our Readers that, if the predictive power of the yield curve stays in place (which is not certain because of the stronger central banks’ manipulation of the interest rates after the Great Recession), there are high chances of the U.S. recession arriving somewhere between the second and the fourth quarter of 2020. Given the already high level of public debt, the next economic crisis should shake the confidence in the U.S. economy and support the gold prices. The Fed’s dovish response will likely also help the yellow metal. You have been warned. If you do not have gold as insurance, you can only blame yourself.
If you enjoyed the above analysis and would you like to know more about the expansions, recessions, and gold, we invite you to read the July Gold Market Overview report. If you’re interested in the detailed price analysis and price projections with targets, we invite you to sign up for our Gold & Silver Trading Alerts. If you’re not ready to subscribe yet and are not on our gold mailing list yet, we urge you to sign up. It’s free and if you don’t like it, you can easily unsubscribe. Sign up today!
Arkadiusz Sieron
Sunshine Profits‘ Gold News Monitor and Gold Market Overview Editor
* * * * *
All essays, research and information found above represent analyses and opinions of Przemyslaw Radomski, CFA and Sunshine Profits' associates only. As such, it may prove wrong and be a subject to change without notice. Opinions and analyses were based on data available to authors of respective essays at the time of writing. Although the information provided above is based on careful research and sources that are believed to be accurate, Przemyslaw Radomski, CFA and his associates do not guarantee the accuracy or thoroughness of the data or information reported. The opinions published above are neither an offer nor a recommendation to purchase or sell any securities. Mr. Radomski is not a Registered Securities Advisor. By reading Przemyslaw Radomski's, CFA reports you fully agree that he will not be held responsible or liable for any decisions you make regarding any information provided in these reports. Investing, trading and speculation in any financial markets may involve high risk of loss. Przemyslaw Radomski, CFA, Sunshine Profits' employees and affiliates as well as members of their families may have a short or long position in any securities, including those mentioned in any of the reports or essays, and may make additional purchases and/or sales of those securities without notice.
********

Arkadiusz Sieroń received his Ph.D. in economics in 2016 (his doctoral thesis was about Cantillon effects), and has been an assistant professor at the Institute of Economic Sciences at the University of Wrocław since 2017. He is a board member of the Polish Mises Institute of Economic Education, author of several dozen scientific publications (including in such periodicals as the Journal of Risk Research, Prague Economic Papers, Quarterly Journal of Austrian Economics, and Research in Economics), and a regular contributor to GoldPriceForecast.com and SilverPriceForecast.com. His two books, Money, Inflation and Business Cycles and Monetary Policy after the Great Recession, are both published by Routledge. Arkadiusz is also a certified Investment Adviser, a long-time precious metals market enthusiast, and a free market advocate who believes in the power of peaceful and voluntary cooperation of people.


