The Fed Spoke…The USD Powerfully Moved And Our Profits Increased


Yesterday’s much-awaited FOMC day didn’t bring much of a surprise in terms of Fed policy changes. However, one has to look at the charts, not just at the news. The USD has certainly reversed higher yesterday and dealt us new cards. Great, let’s take a look how they play into our open positions and also into the opportunities so near.
EUR/USD – In the Aftermath of Yesterday’s Reversal
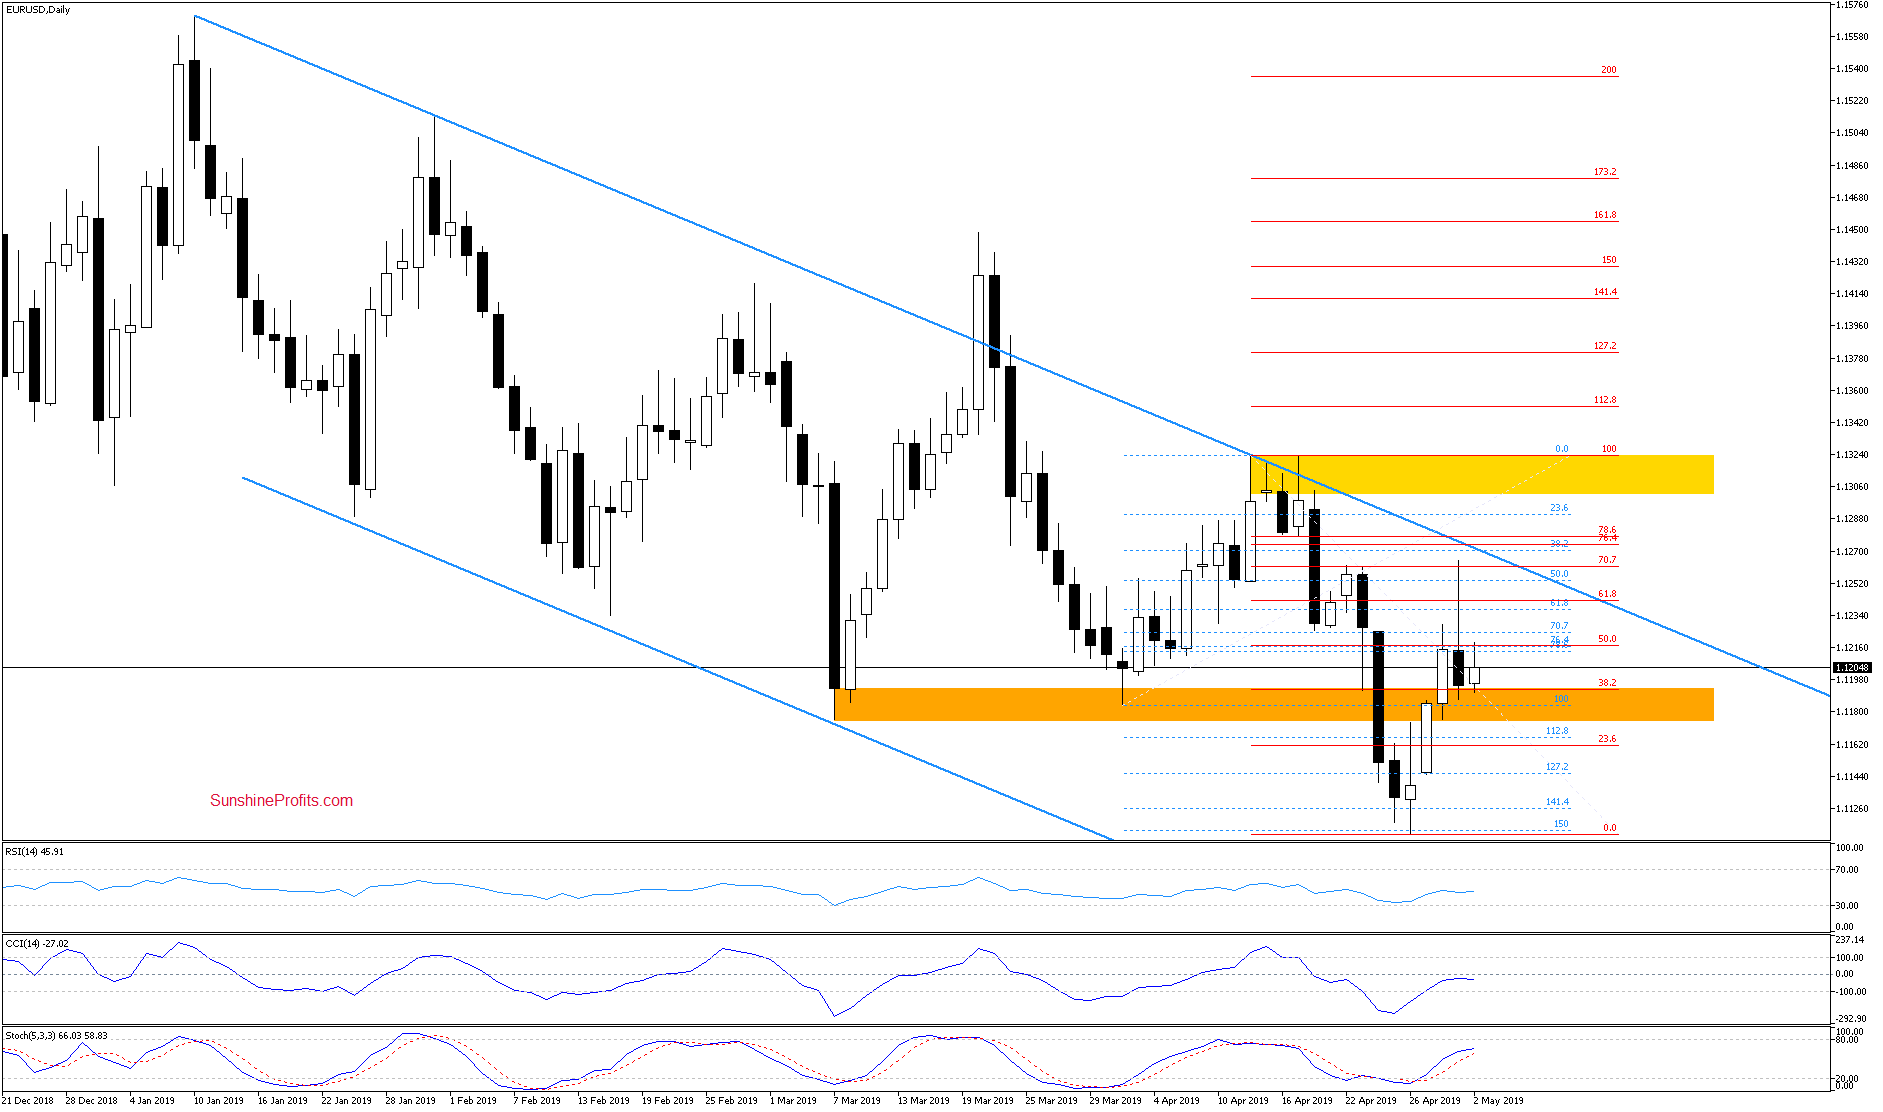
EUR/USD gave us quite a volatile day yesterday. First, it tested the 61.8% Fibonacci retracement, and then went on to the 70.7% Fibonacci retracement. Before the day was over, the bulls however gave up all of their gains and then some. Such an invalidation of earlier breakouts is a bearish development.
Earlier today, the bulls have tried to retrace some part of yesterday’s decline but look to have failed as the rate currently trades close to unchanged at around 1.1200. Could this be the attempt to move higher or can we look for another one down the road? The lack of sell signals by the daily indicators suggests that we may very well still see one more attempt to go north in the very near future.
USD/CAD – Breaking Down From Its Consolidation?
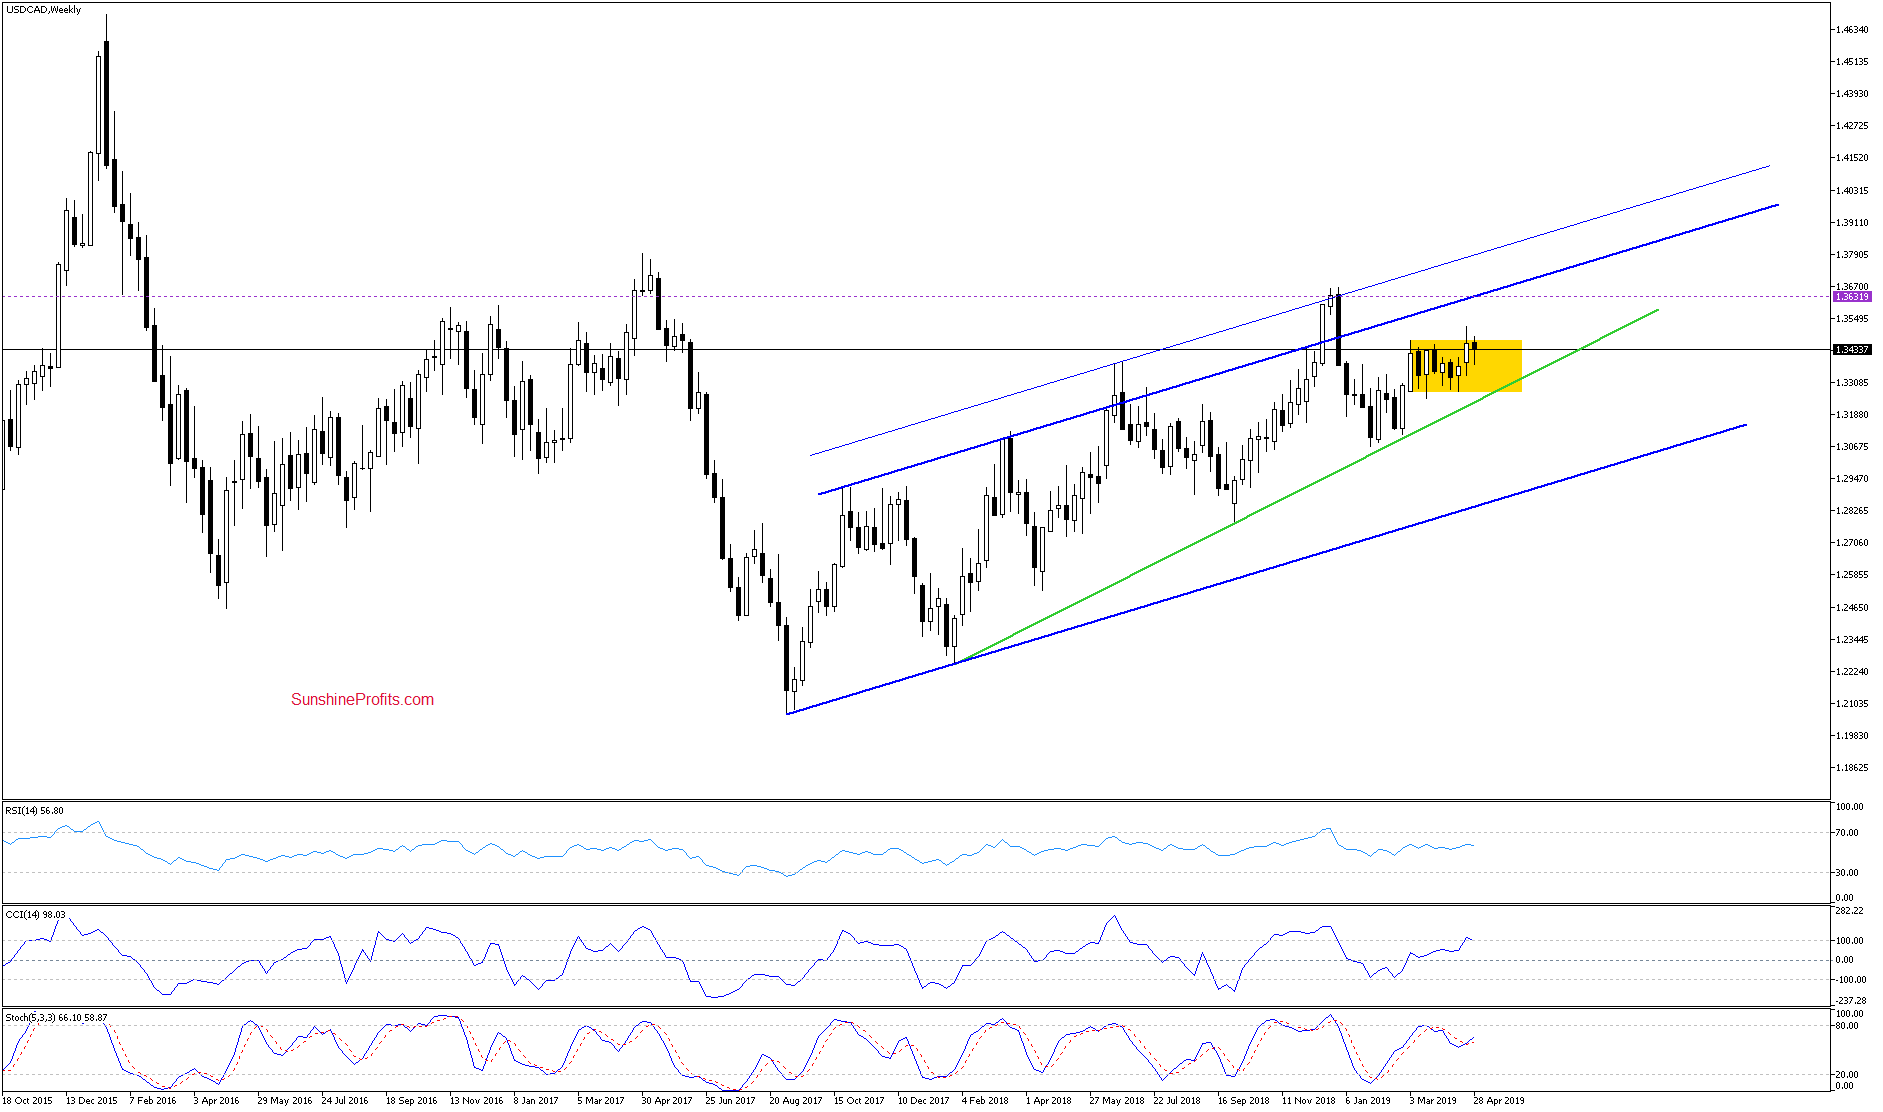
The weekly picture doesn’t look very optimistic for the bulls as they gave up half of their last week’s gains. The pair reverted back into the yellow consolidation and has spent this week there. This means invalidation of the earlier breakout above it.
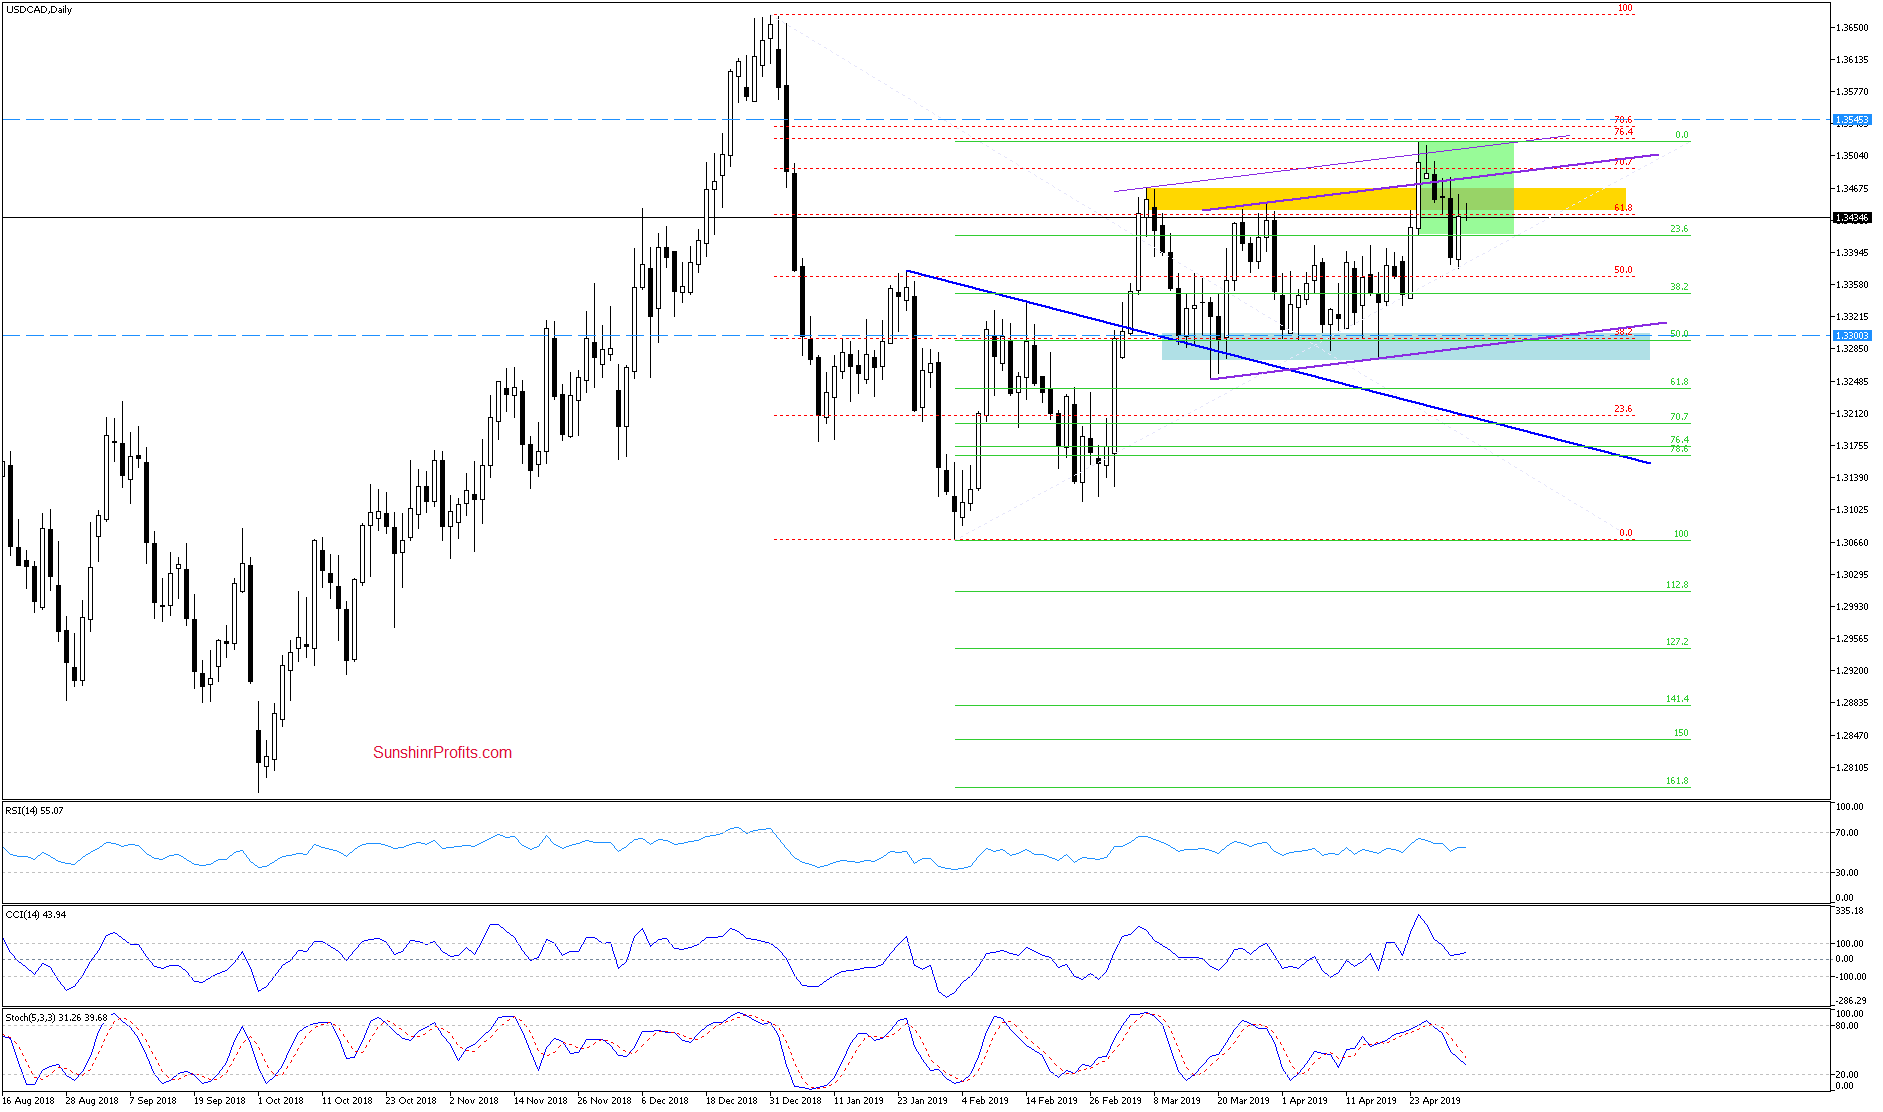
The daily chart shows that the bears took the rate below the green consolidation on Tuesday. The bulls countered with a swift upswing and continue to build on their gains in today’s trading so far. This means that the price action came back to the previously-broken green consolidation and is currently midway through the yellow resistance zone (trading at around 1.3455).
This is exactly where the bulls have been stopped yesterday. Looking at the yellow resistance zone (the bulls haven’t overcome it), the sell signals by the daily indicators and that breakout invalidation on the weekly chart, lower values of the pair are probably just around the corner.
AUD/USD – Taking a Ride Lower
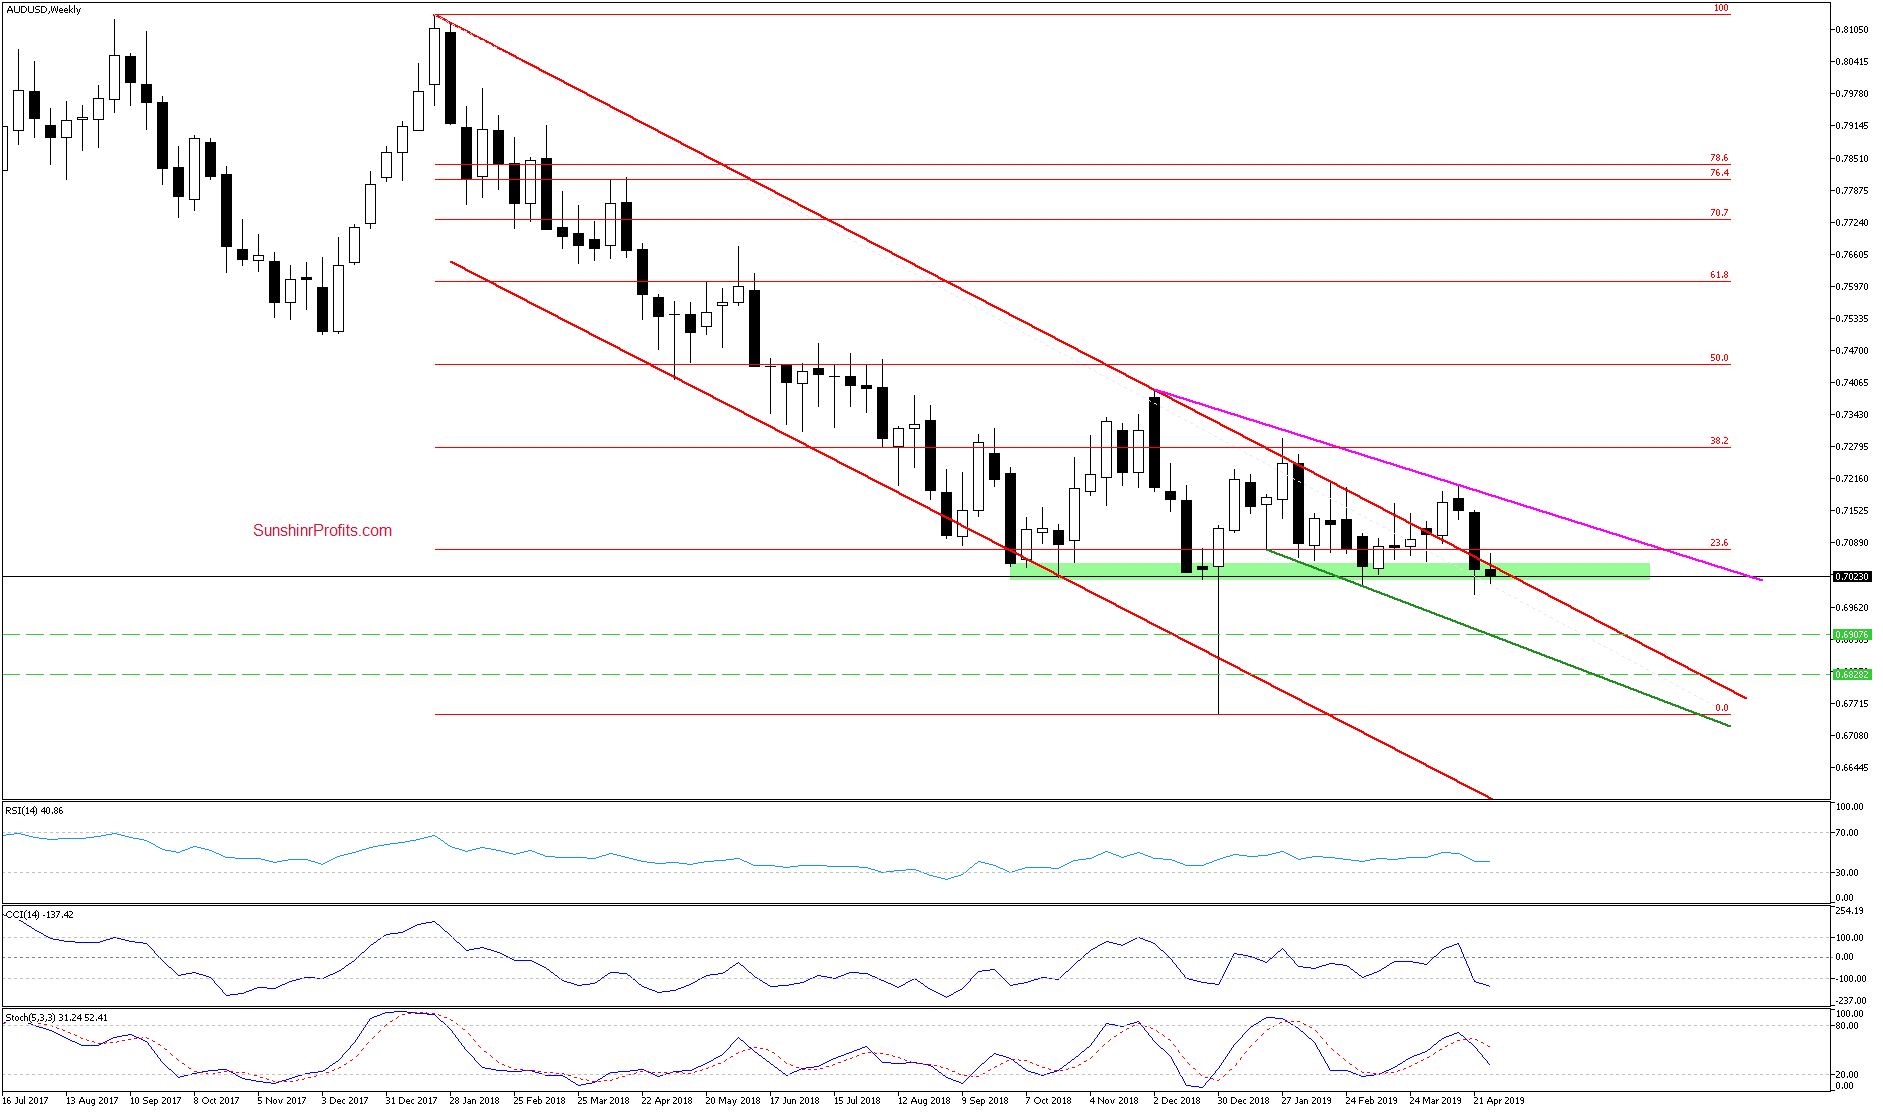
The weekly perspective remains unchanged as the pair has climbed to the previously-broken upper border of the red declining trend channel. It looks like a verification of last week’ s breakdown that left the price trading back inside the trend channel.
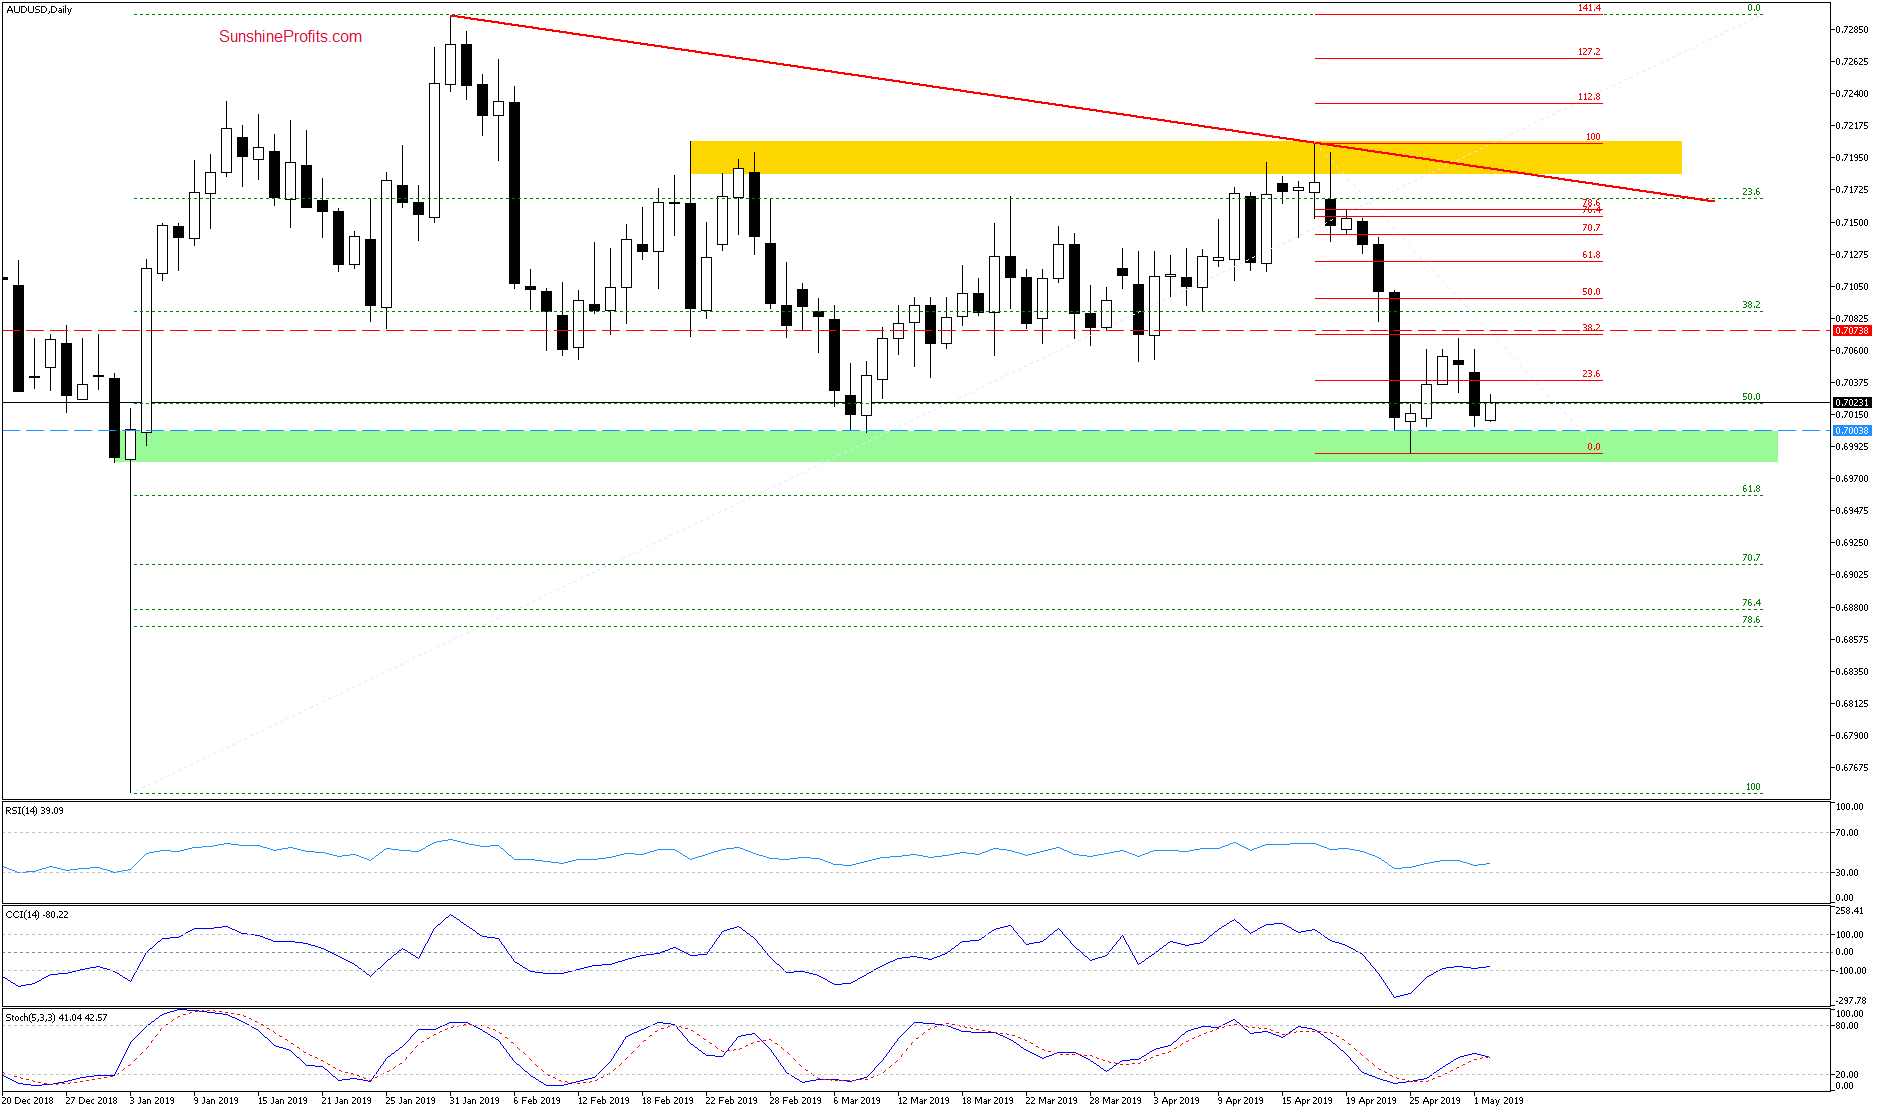
The daily chart shows an unsuccessful attempt to come back above the upper border of the red declining trend channel as seen on the weekly chart. Its combination with the 38.2% Fibonacci retracement of the most recent downward move on the daily chart encouraged the bears to act.
The bears took the pair close to the green support zone yesterday. Earlier today, the bulls attempted to go north but their attempts look to have already fizzled out as the pair currently trades below yesterday’s lows at around 0.7005. That value is also below the green support zone. One more downswing is supported by the sell signal of the daily Stochastics Oscillator.
The Summary features an overview of the open positions with precise price targets and our game plan for the opportunities in the making. It’s reserved for our subscribers. If you enjoyed the above analysis and would like to also receive free follow-ups, we encourage you to sign up for our daily newsletter - it's free and if you don't like it, you can unsubscribe with just 2 clicks. If you sign up today, you'll also get 7 days of free access to our premium daily Oil Trading Alerts as well as Gold & Silver Trading Alerts. Sign up now!
Nadia Simmons
Forex & Oil Trading Strategist
Sunshine Profits - Effective Investments through Diligence and Care
* * * * *
All essays, research and information found above represent analyses and opinions of Przemyslaw Radomski, CFA and Sunshine Profits' associates only. As such, it may prove wrong and be a subject to change without notice. Opinions and analyses were based on data available to authors of respective essays at the time of writing. Although the information provided above is based on careful research and sources that are believed to be accurate, Przemyslaw Radomski, CFA and his associates do not guarantee the accuracy or thoroughness of the data or information reported. The opinions published above are neither an offer nor a recommendation to purchase or sell any securities. Mr. Radomski is not a Registered Securities Advisor. By reading Przemyslaw Radomski's, CFA reports you fully agree that he will not be held responsible or liable for any decisions you make regarding any information provided in these reports. Investing, trading and speculation in any financial markets may involve high risk of loss. Przemyslaw Radomski, CFA, Sunshine Profits' employees and affiliates as well as members of their families may have a short or long position in any securities, including those mentioned in any of the reports or essays, and may make additional purchases and/or sales of those securities without notice.


