FOMC Malfeasance Knows No Bounds
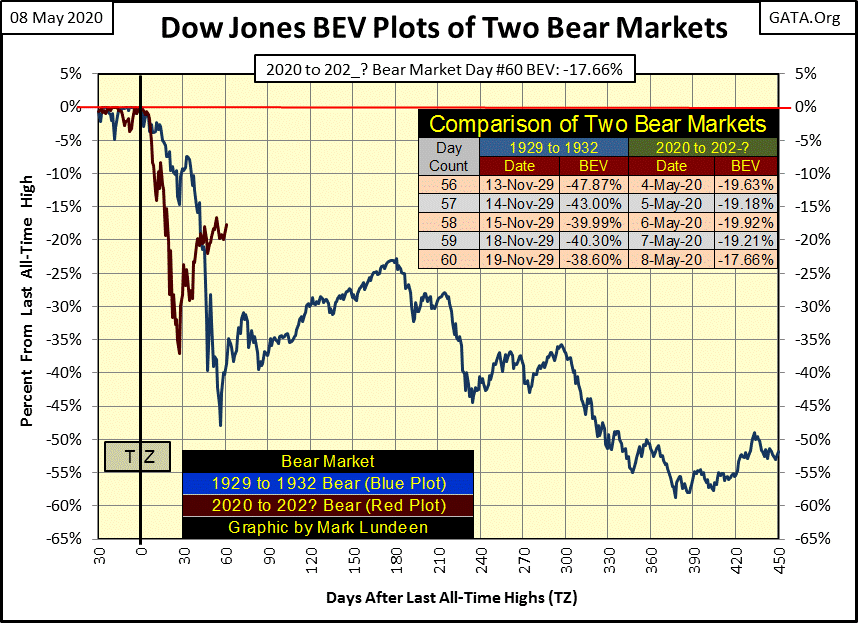
Some may look at the chart below comparing our present market decline to that of the Great Depression’s Dow Jones bear market and see an element of hyperbole in it. But before this bear market sees its ultimate bottom, I won’t be the only market commentator making this comparison.
Both these market catastrophes were possible only because of the misguided “monetary policy” crafted by the Federal Reserve. But of the two bear markets, the Federal Reserve has interfered in the natural workings of the free market the most in ours.
Here’s an article from CNN (Fake News) highlighting the FOMC’s activities since the Dow Jones began its decline on February 12th.
The Fed's experiment with junk bonds is about to beginUpdated 4:13 PM ET, Mon May 4, 2020
https://www.cnn.com/2020/05/04/investing/fed-junk-bonds-etfs-debt/index.html
“On March 23, the Fed dramatically stepped up its efforts to prevent a coronavirus depression by promising to set up a first-ever special entity to buy corporate bonds and ETFs. * The US central bank later added junk bonds and junk bond ETFs to the list of assets that would get scooped up. * That promise had a profound impact -- even though the US central bank has not yet directed the purchase of a single corporate bond.”
“First-Ever Special Entity”? It surely won’t be the last ever. Reminds me of Enron’s Special Purpose Entities (SPEs) like their notorious “Chewco” and “Jedi” SPEs where Enron’s management hid their many losses from their dopey-government regulators and shareholders. Beware of any corporate entity that feels the necessity of using SPEs to hold “assets” like junk bonds.
Note the key date of March 23rd, the day the Dow Jones saw its current market bottom (BEV of -37.09%), NYSE 52Wk Lows stopped overwhelming 52Wk Highs, and corporate bond yields peaked the following day. Had the FOMC not made this announcement, where would the Dow Jones, and corporate bond prices be today? Much lower I believe.
But don’t believe the FOMC hadn’t interfered in the stock market before March 23rd. As during the NASDAQ Tech Wreck in 2000-02, and the Sub-Prime Mortgage Debacle of 2007-09, the Federal Reserve has “supported market values” by providing “liquidity” in the market during a selling panic.
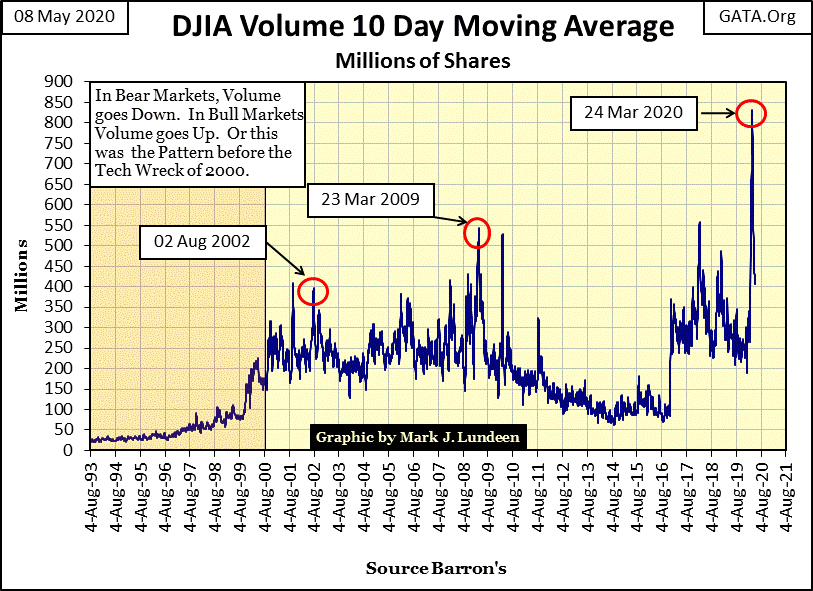
For a third time in the 21st century, daily trading volume for the Dow Jones has spiked to historic levels during a market panic. From 1900 to 2000, this had never happened; a spike in trading volume at a market bottom. That in March 2020 took so much trading volume to stop the Dow Jones from declining below its BEV -40% level on March 24th is alarming!
Without a doubt the FOMC and Mr Bear have different opinions on this market’s valuations.
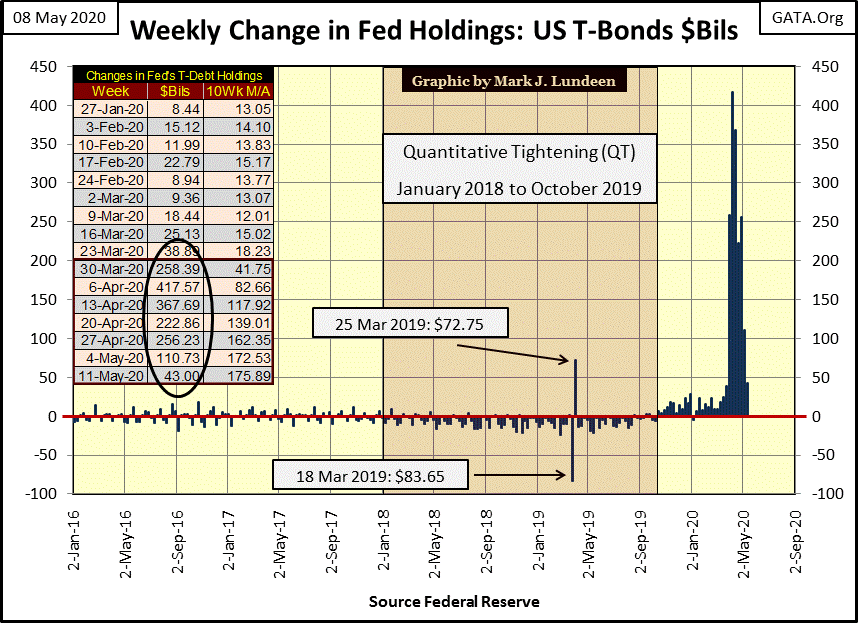
Here’s something that had only happened once before, during the Sub-Prime Mortgage Crisis; a quantitative easing of biblical proportions.
The dates in the chart’s table below are Barron’s issue dates, which are always the Monday following the week in review. So what happened during the week of March 23rd is actually found in Barron’s 30 March 2020 issue, and during the week of March 23rd, the FOMC had for the first time “injected” into the financial system a triple-digit hundred billion dollar slug of “liquidity”, and they have continued doing so until just this week.
See circled area in table below that corresponds to the “liquidity” spike in the chart.
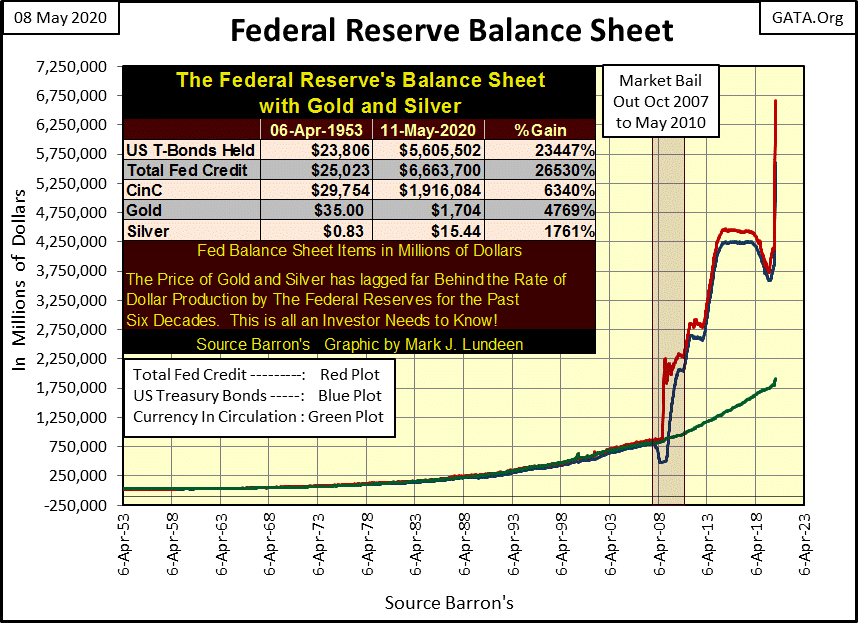
Here’s the balance sheet for the Federal Reserve. The blue plot is their holding of US Treasury debt. The red plot is US Treasury debt plus other items the Fed has “monetized”, which is mostly mortgages. This “monetary activity” keeps mortgages rates at “attractive levels” if not home prices themselves.
How much of America’s current homeless problem can be linked to the red plot below? I think much of is, as it’s not just the market values of stocks and bonds that the FOMC “supports.”
And what is this CNN (Fake News) nonsense about a “coronavirus depression?” When did the FOMC began their Not QE-4? In the first week of last October. Seven months later the Mainstream Financial Media outlets are now providing excuses for our “policy makers” malfeasance (the coronavirus ate my homework) in their mismanagement of the nation’s credit system.
The Fake News continued:
“The goal of the programs, according to the Fed, is to make sure large employers have access to the credit they need to ride out this unprecedented storm.”
Ya right! Thanks to the Federal Reserve’s “monetary policy” of the past three decades, long before the coronavirus became news, corporate America had been gagging on the credit they had already taken advantage of.
“However, there is no requirement for companies that take advantage of the Fed's bond-buying program to keep workers. * Nor are these companies required to suspend stock buybacks or dividends. *
As expected, the FOMC is an elitist organization that looks out for its own; workers need not apply. Also as expected, the liquidity flowing into corporate America can be used to fund their share buyback and dividend programs, as such activities assist in “supporting market valuations.”
The purpose of all the above is to demonstrate that market valuations today are managed by the “policy makers” using monetary inflation, and have been for decades. So I cut myself a lot of slack when commenting on when things are going to happen, if not what.
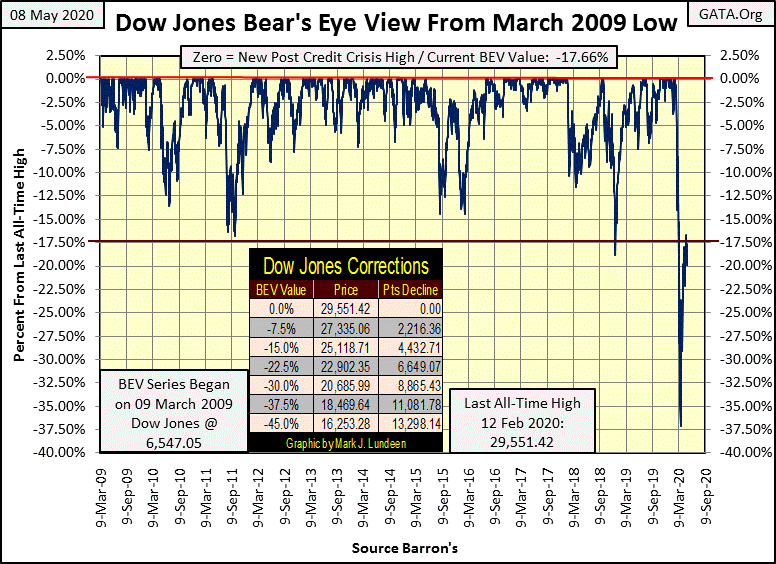
Let’s move on to the Dow Jones BEV chart below. So far the Dow Jones’ -17.5% BEV line is holding back the bulls, as it has been since April 8th. Maybe it will hold for another month, if the FOMC continues moderating its weekly “injections of liquidity” to below $50 billion dollars (see table two charts above).
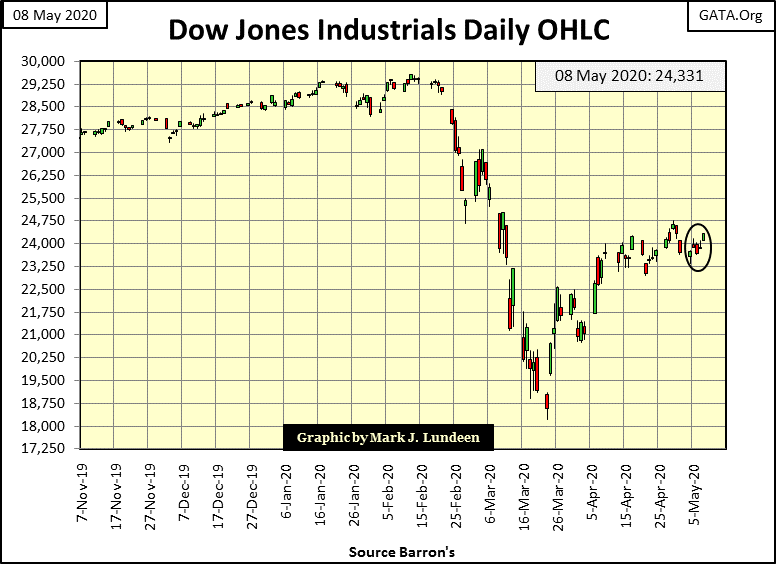
Looking at the Dow Jones in daily bars below, we see a different and I think superior view of the moderation of the post March 23rd market advance. For all of the monetary inflation “injected” into the financial system since March 23rd, the “policy makers” really haven’t gotten much for their money.
Daily volatility has decreased greatly since mid-April, and that’s good for the bulls.
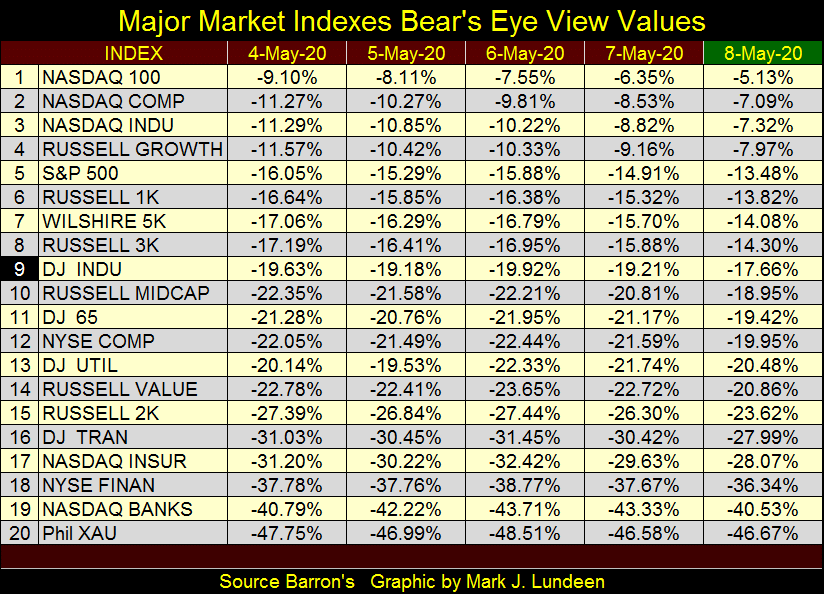
Looking at the major market indexes I follow below, the NASDAQ nonfinancial indexes are all in the single digit BEV values with the NASDAQ 100 within scoring position of another new all-time high. But the NASDAQ Insurance index (#17) is lagging while the NASDAQ Bank index (#19) closed the week with a BEV of -40%. That’s below the perennially depressed NYSE Financial index (#18).
Seeing financial companies underperform in the current market advance is a concern.
The stock market is vulnerable to a shock, such as a collapse in earnings due to the two month coronavirus economic shut down.
Current unemployment is reportedly at the same levels they were at in the depressing 1930s; that means demand for what corporations supply is way down. That can’t be good for future earnings, and flooding the financial system with “liquidity” at the current Fed Funds rate of zero isn’t a quick fix this problem either.
Healthcare, which is about 20% of the economy, was also hurt by the coronavirus quarantine. The expected flood of near-death patients from the coronavirus pandemic never appeared, while hospitals and health care providers ceased their profitable normal operations for weeks now.
Like everybody and everything else, the healthcare system is heavily in debt thanks to the Federal Reserve supplying “ample credit” at “attractive rates” to the financial system these past few decades. The last two months are going to greatly increase the stress in servicing their debts.
Another source of potential shock for the stock market is the Chinese Communist Party (CCP). Their Wuhan biological laboratory was the source of the genetically modified (manmade) coronavirus outbreak. It should be called The CCP Virus rather than Covid-19.
Anyway, the self-styled elite of my generation (the Baby Boomers) have since the 1960s been attracted to Maoism. The “New Left” of the 1960s was communism based on “Chinese Principles” as America’s Jane Fondas and Jerry Rubins believed the Russian communists were “sell outs” to Washington, unlike the Maoist of China who remained committed to “The Revolution.”
The economic impact of The CCP Virus to the world has been immense and continues growing; in all twenty-four time zones everyone is “mad as hell” about what the CCP has done “and they aren’t going to take it anymore.” The United Kingdom’s new Prime Minister; Boris Johnson almost died from The CCP Virus.
So, it’s not just the United States that holds the CCP as responsible for The CCP Virus epidemic that has engulfed the world. Having the CCP as a trading partner is no longer seen as desirable to most, if not all of the CCP’s global trading partners.
The supplies China sold to Europe, and elsewhere for fighting The CCP Virus were less than advertised. This was to be expected when much of European and North American medical product production was sub-contracted out to Mainland China for their cheap labor decades ago.
There will be political and economic incentives applied to Western corporations to withdraw their industrial production from China that will place the CCP in danger of revolt by its increasingly impoverished captive population.
The CCP, being managed by a bunch-of-hardcore-Commies, are not going to take that lying down and peacefully accept such a transition of global industrial production. The growing risks of military conflict with China must also be factored into the future performance for our grossly overvalued stock market.
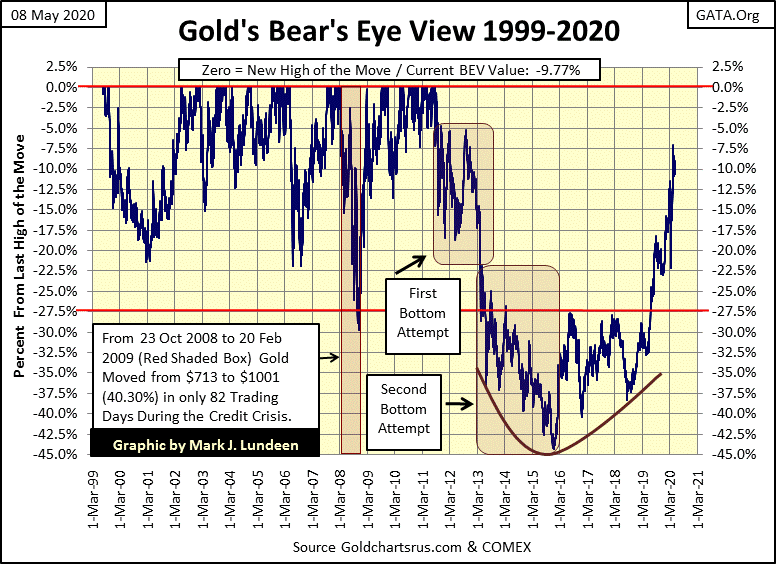
For the past year, gold’s BEV chart below has been a beautiful thing to behold. Currently gold is struggling to break above, and stay above its BEV -10% line, or so it’s been since late March. But this too shall pass, and the day is coming when gold will once again break above, and stay above its last all-time high of $1888.
I hope it doesn’t take the US Marines pushing the CCP’s People Liberation Army out from the South China Sea to make this happen.
https://www.youtube.com/watch?v=qOeEMsdYzm4
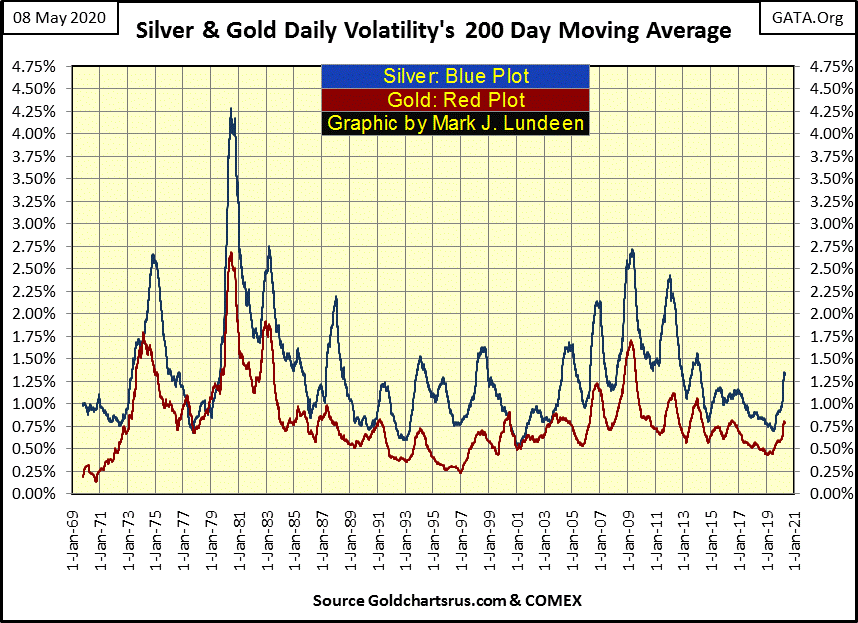
Maybe war isn’t necessary for the old monetary metals to break into new all-time highs. From near historic lows in January 2019, daily volatility for both gold and silver has increased, and that’s bullish for the metals.
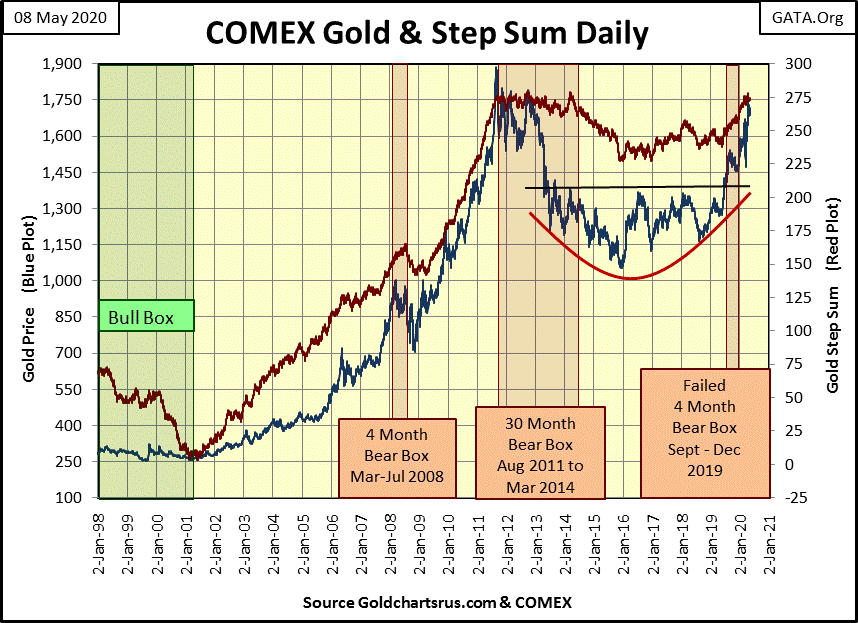
Gold and its step sum below continue looking bullish. But after a month of gold remaining within 10% of breaking to a new all-time high, I’m becoming tired of just looking.
What we need now is for gold to do something dramatic, like closing above $1888 before June. But the market does what it does when it wants to do it. So I’ll be happy, if not real happy should we see gold close at a new all-time high sometime before 2021.
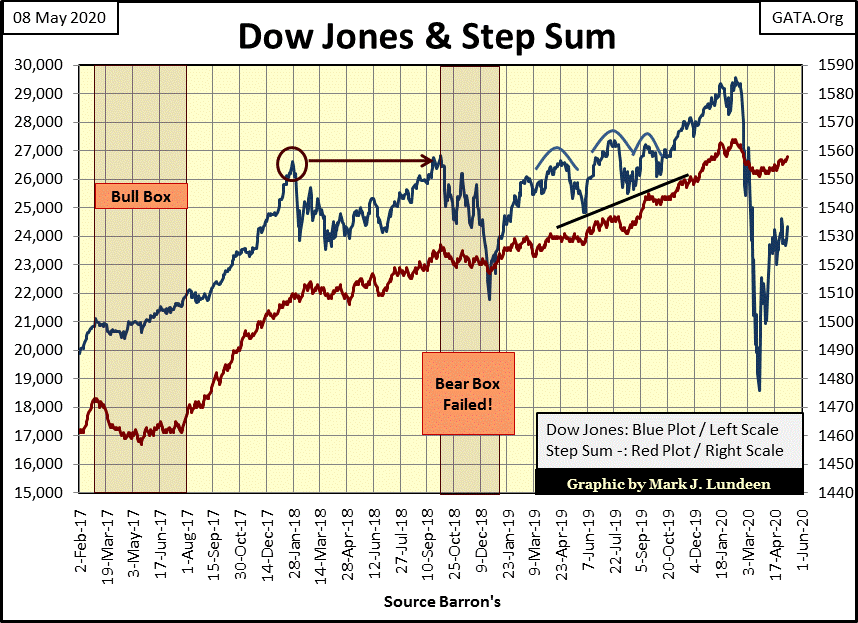
As of right now, I can no longer justify claiming a step sum bear, or bull box is in the works for the Dow Jones. So what is there to see in the chart below? The Dow Jones’ price plot (market reality) and its step sum plot (market expectation) are both trending upwards, and for the bulls that can’t be bad.
But let’s see what this chart looks like when 2nd Qtr earnings for 2020 come out. They can’t be good, and no one is expecting that they could be. So as I’ve said before, the only thing keeping the Dow Jones (my proxy for the broad stock market) at its current level is the Federal Reserve practicing bear-market interruptus with massive “injections of liquidity.”
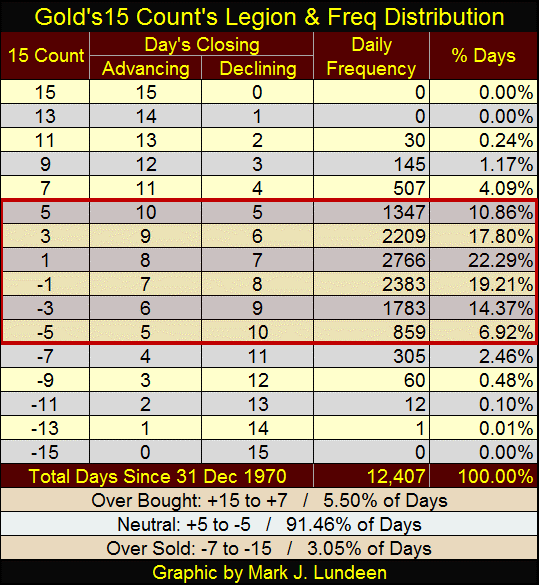
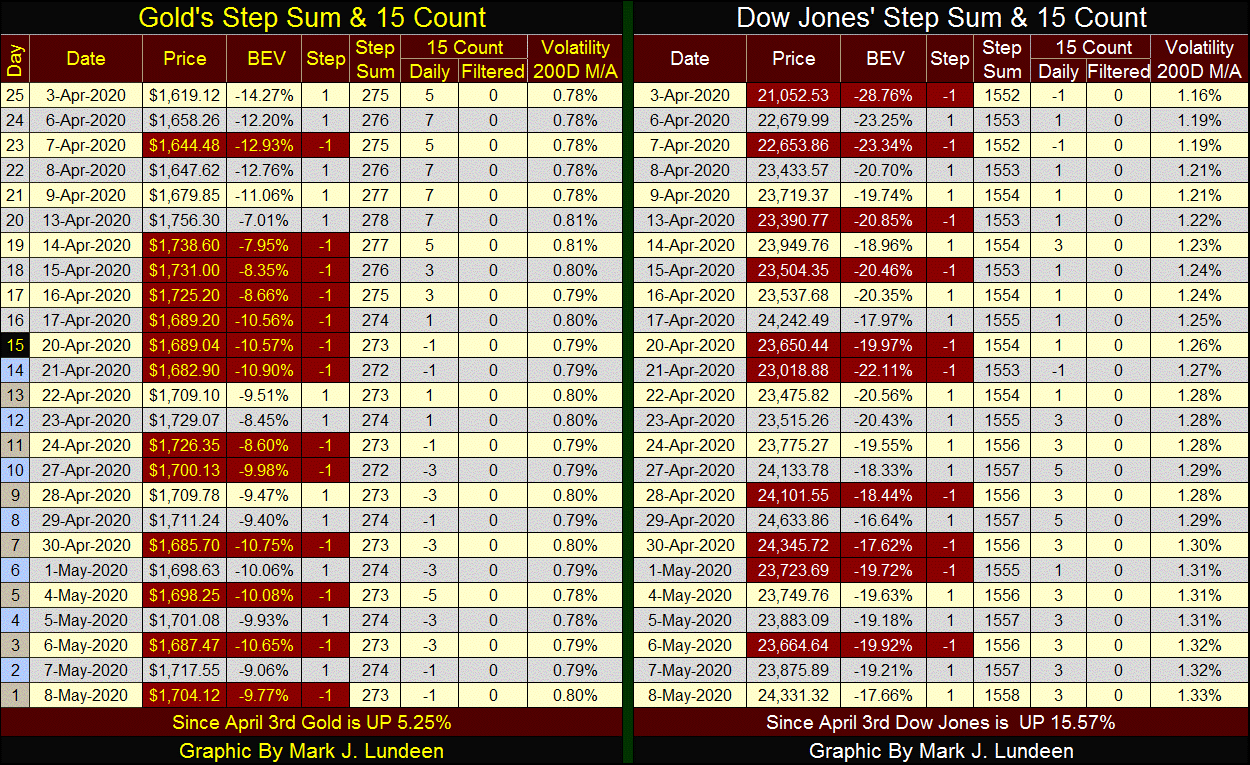
Gold in its step sum table below has seen a lot of selling these past five trading weeks. But with gold having a 15 count of +7 on April 13th it was overbought then, and now it isn’t.
How overbought is a 15 count of +7? Since December 1970, 12,407 COMEX trading sessions ago, gold closed with a +7 for only 507 of those daily closings, and four of those daily closing of +7 can be seen in the table below; so it’s a rarely seen market extreme in the gold market. That the price of gold would have corrected from such a market extreme isn’t unexpected.
We now have to wait to see if the bulls have it in them to do something with the ball now clearly on their side of the court.
One thing I liked seeing in gold’s table below; since April 13th when it had a 15 count of +7 gold’s BEV was -7.01%, just short of being within 5% (scoring position) of a new all-time high. After all those red-down days since April 13th where did gold’s BEV close the week at? With a BEV of -9.77%.
So, after a month dominated by daily losses, gold lost only 2.76 BEV points, or down $52 dollars. After all that, that’s not much of a decline and gives us hope for good things to come in the weeks ahead.
For the Dow Jones’s step sum table, its step sum has advanced by six steps since April 3rd; that’s good. But its daily volatility’s 200 day M/A has increased by 0.17%; and that’s bad. However, note this week I didn’t publish Mr Bear’s Report card as there were no Dow Jones’ 2% days (days of extreme volatility) or NYSE 70% A-D days (days of extreme market breadth).
If the worst of the market decline is over, we’ll not see any of those extreme market events for some time to come. However, if this is just a calm in a continuing storm, which is my view of the market, we’ll see many more of these extreme market events before we see the ultimate bottom of this bear market.
Like me, my readers will just have to wait to see who in the weeks and months to come rules this overvalued market; the FOMC with its monetary inflation or Mr Bear.
Mark J. Lundeen
*********


