Forecast: Gold And U.S. Stock Cycle Update
 share
share
 share
share
 share
share
 share
share
 share
share
 Recapping Last Week
Last week's trading saw gold forming its low in Monday's session, here doing so with the tag of the tag of the 1677.90 figure. From there, a sharp rally was seen into late-week, with the metal running all the way up to a Friday peak of 1781.90 - also ending the day and week at or within earshot of the same. For the five-day period overall, the metal ended up with a net gain of about 15 points.
Gold Cycles, Short-Term
For the near-term action, as mentioned last weekend the next short-term bottom was due to materialize, and coming from the smallest-tracked wave, the 10-day cycle - shown again on the chart below:
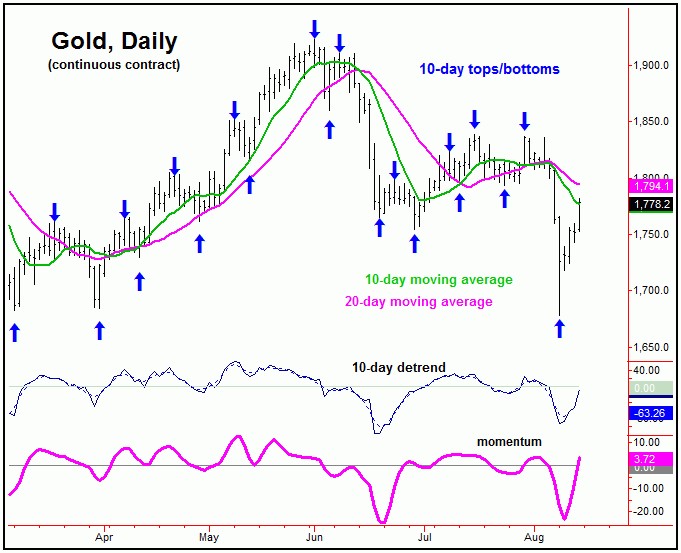
From last weekend: "with Friday's new low in price, this 10-day wave is now some 10 trading days along from its last labeled trough - and with that is at or into normal bottoming range. Once the next low for this wave is in place, a sharp short-term bounce/rally is likely to materialize, one which sees the 10-day moving average acting as the ideal magnet."
As mentioned last week, being some 10 trading days along, our 10-day cycle was at or into bottoming territory, and with that was looking for a fairly sharp short-term rally - due to the fact that the metal was so extended from its 10-day moving average.
Readers who follow my work know my rule is that a dominant cycle will revert back to a moving average of the same length better than 85% of the time, and with that the overall assumption was that a 'snap-back' rally to the 10-day moving average would be seen - at minimum - an assessment which has now been met with the strength into late last week.
Having said that, any push on above the 1783.00 figure - which is just above Friday's high - would signal a weekly reversal to the upside has occurred. If seen, the probabilities should favor additional strength on through that level, ideally on up to next key resistance around the 1800-1830 region.
Stepping back, however, until proven otherwise, the larger 34-day wave is seen as pointing south, with that cycle shown again below:

With the configuration of this 34-day component, the probabilities will favor the upward phase of the smaller 10-day wave to end up as a countertrend affair, once again with resistance around the 1800-1830 region, with the higher end of this range being more key on a closing basis.
Gold's Stepped-Back View
As mentioned in past weeks, Gold's key dividing line was the 1839.80 figure on a daily closing basis - which was never taken out to the upside - thus keeping the metal in a weaker configuration. That number has now dropped slightly, to a daily close above the 1834.80 figure (December, 2021 contract) - and should continue to come down going forward - depending on the action.
Stepping back, taking out the June low of 1754.30 is now our best confirmation of a turn south with the larger 154-day wave, which is now projecting its next low to occur around the October or November timeframe of this year:
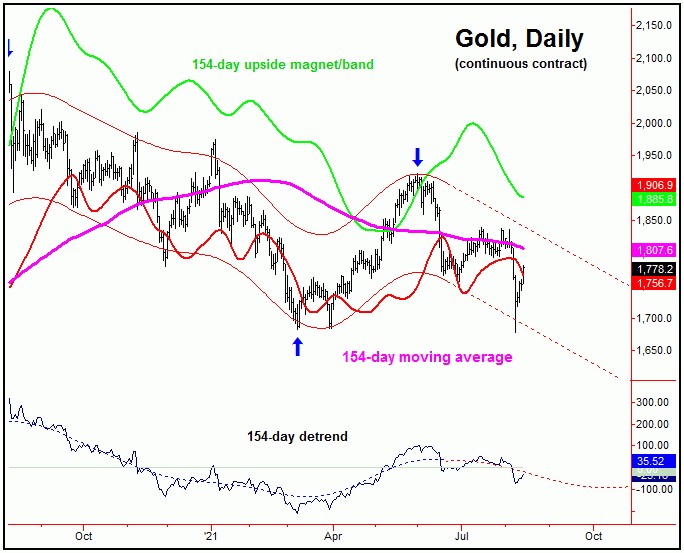
With the newly-phased position of this 154-day component, the probabilities tend to favor the next upward phase of the smaller 34-day cycle to end up as a countertrend affair, holding at or below the upper (and extrapolated) 154-day cycle channel - which is also at or near our key dividing line of 1834.80 on a daily close. If correct, lower lows would be expected into the Autumn months, before the next key bottom forms.
U.S. Stock Market Update
In taking a look at the U.S. stock market - as measured by the S&P 500 index, or 'SPX' - this market is still in the process of forming a mid-term top. That top is expected to come from the combination of the 180 and 360-day cycles, with the larger 360-day wave shown again on the chart below:
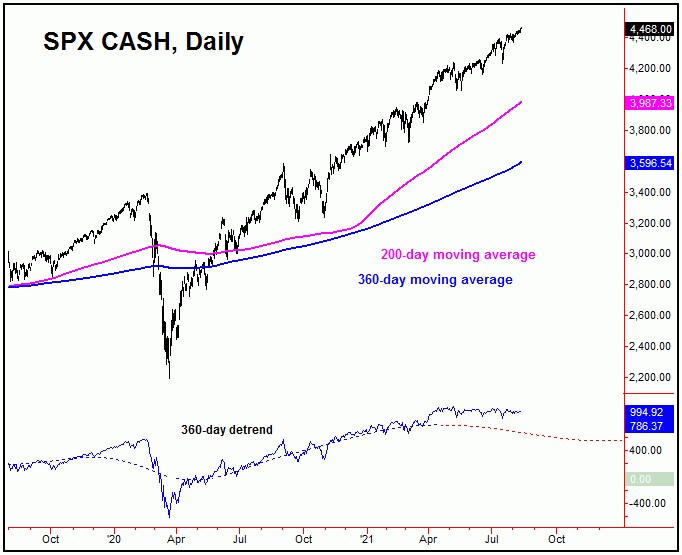
Having said the above, with the action seen this year, with each of our downside reversal levels able to hold on the corrections with the smaller-degree cycles, no peak has ever been confirmed with these 180 and 360-day waves - and thus they continue to push to the upside at the present time.
Until a higher level materializes, it would currently take a daily close back below the 4233.13 SPX CASH figure to confirm a turn south with this 360-day component, though this number is expected to rise in the days/weeks ahead, with the latest numbers always posted in our Market Turns report, which focuses on the U.S. stock market.
Adding to the notes above, once this 360-day cycle does top out, the largest decline of the year is likely to follow, with mid-term support around the 200-day moving average on the SPX, if tested. In terms of patterns, however, this decline is favored to end up as a countertrend affair, giving way to another rally of 20-40% or off of whatever bottom that forms with this 360-day component - with that rally expected to last well into late-2022 or beyond, before the next larger-degree peak attempts to form.
The Shorter-Term View for U.S. Stocks
For the near-term picture, the last correction of significance in the U.S. stock market came back in mid-July, with the SPX seeing a sharp decline into a July 19th bottom. Take a look at our next chart:
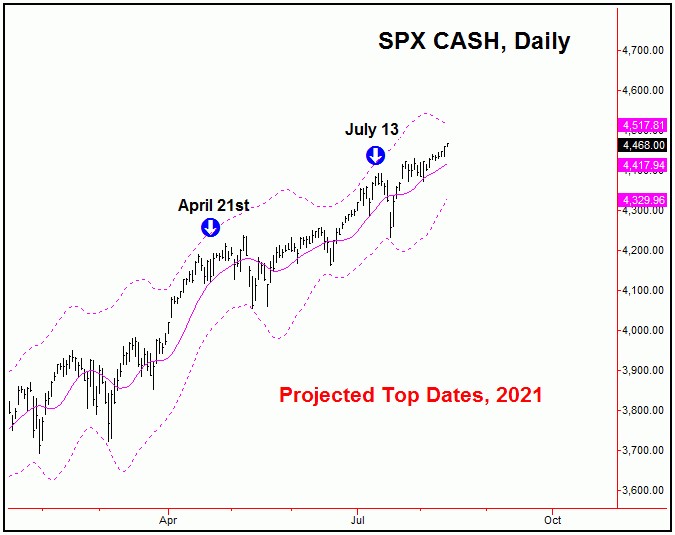
The chart above shows our projected top dates for the U.S. stock market this year, with the last one of significance occurring back on July 13th - just one day prior to the actual peak for the move, which was registered on July 14th. What followed was a 160 point decline into the July 19th bottom, which we were able to buy at that daily close - and are still holding as of Friday's close.
Having said the above, we are now looking for indications of a long-side exit, as our next key topping date is coming up soon - with the precise details noted in the daily version of our Market Turns report. This upcoming turn date does have the potential to peak our extended 360-day time cycle, though time will obviously tell as to whether this ends up as correct. More as we continue to move forward.
Jim Curry
The Gold Wave Trader
http://goldwavetrader.com/
http://cyclewave.homestead.com/
********
share
share
share
share
share


