Gamechanger?


The Chris Marcus Letter to Acting Head of the CFTC, Rostin Benham, to remind him of the implications of what he had said in an interview, describes a smoking gun that had made a loud bang in the PM market. Whether its reverberations are going to wake the sleeping watchdogs and scare away those who have been for so long busy ripping off the market remains to be seen. However, the past week has revealed some changes in the daily patterns that hint at a change of rules in the gold market. The verdict on what will happen is still out.
The four charts below show the NY price of gold for the last four days of last week. On May 4, the price rallied during the early morning and continued past the time of the usual attack close to the open of the stock markets. As the price reached towards the $1800 mark and buyers started to get excited about the trend continuing higher and breaking to a new handle, the attack was launched to push the price lower by $25.
The attack consisted of three consecutive waves lower, with just enough of a recovery at the end of each wave to suck in the buyers who were waiting in ambush for what seemed like the end of the attack. This tactic has been used in the past, but not so frequently to make the buyers more apprehensive about being drawn into the market only to find themselves looking at a new wave down.
After the third wave down, the new buyers were either stopped out of sitting on the sidelines, or too scared to start buying again. The sideways drift in the market lasted until Wednesday, when an early attack hit the price before US markets had opened. It came as a surprise for the sellers when the price rebounded immediately and kept on increasing, despite three subsequent attempts to reverse the rising trend again.
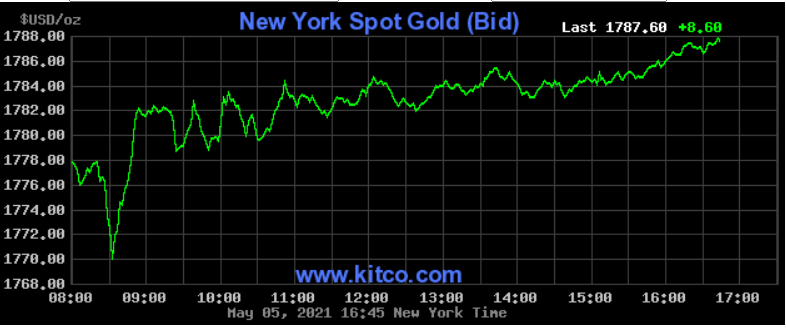
May 4
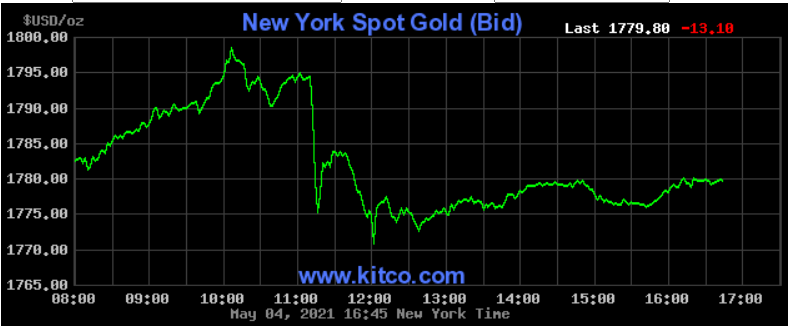
May 5
On Thursday, New York opened up by a few dollars from Wednesday’s close and in a new twist to the expected attack the price rallied about $20 in a short period of time. That was the end of the excitement and the price remained level and sideways until the market closed to end a rare follow through without the price in a decline again.
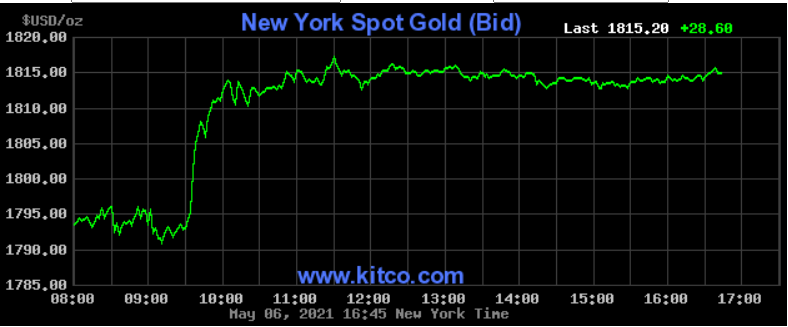
May 6
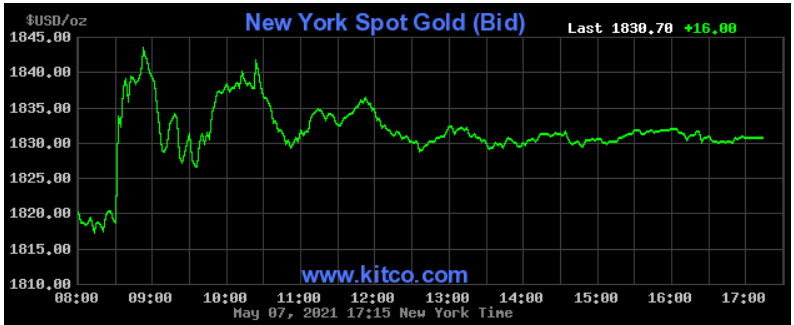
May 7
On Friday, the price again opened a little higher than the day before – also strange to see a small follow through from the close the previous day, which means there was no successful attack during Asian trade. It was not long before a new and steep rally took off, as had happened the previous day. The rally had gained $25 before an attack was launched, but it petered out around $1830 when a new rally started.
As on Wednesday, three attacks took place to force the price below $1830, but to no avail. It settled sideways in a narrow band until the close. After the decline of $13,15 by the end of trading on Tuesday, the next three days saw the rallies accumulate daily gains of $8.60, $28.60 and $16.00 for a total gain of $53.20 off Tuesday’s close. The week had started off with a rally from $1780 to near $1800, then fell on Tuesday. The subsequent gains meant that the price of gold has rallied by $60.00 since the close at $1769.10 at the end of April.


The above two charts of the Commitment of Traders for silver are for last week and for April 30, as shown last week. Last week the Commercials’ net OI increased by about 2800 contracts from -65752 to -68545. Despite the blunder by Benham, when he had stated that an increasing silver price would have created a ‘much worse situation in the silver market,’ the Cartel is still suppressing the price of silver and probably that of gold as well. Is this behaviour merely the continuation of what has become a habit during the past two decades, or are they so filled with hubris that they believe they are untouchable?
What the answer to that question turns out to be and by extension whether Marcus’ letter will set the fox among the chickens will probably become clear during the rest of the month. The first week of May hopefully has set an example that will be followed by the markets for the rest of the month, as happened during May last year. The effect of the rally last week is shown in the two charts below. The monthly charts of the metals to the end of April are updated with the London fixes on Friday, 7 May.
London Gold PM fix. Monthly close. Last = $1767.65
The chart of the price of gold shows that the rally off support at line Y to hold in channel XY is extending and is now well established in the steep bull channel. Of course, should the Cartel really view themselves as immune to the law because of their ‘official mandate’ to keep the prices contained, or tamped down, they will see the rally as preparation for skinning the bulls again as May runs to a close.
Yes, many of the Big Banks – with JPM prominent among them – have been found guilty of meddling by the regulators, but they paid their piddling fines with a smile – and, as far as I am aware, without admission of guilt.
Silver has been the main target of the price suppression for some time and the chart of the monthly close illustrates that by the fact that the recovery of silver lags that of gold. Friday’s London fix – which is earlier in the day than the gold PM fix or trading in the US – has the price at a triple top right at significant resistance. If silver can now extend its rally higher than $27.80 to break clear above line M and with the next level of resistance well above $30, the month of May could become very interesting.
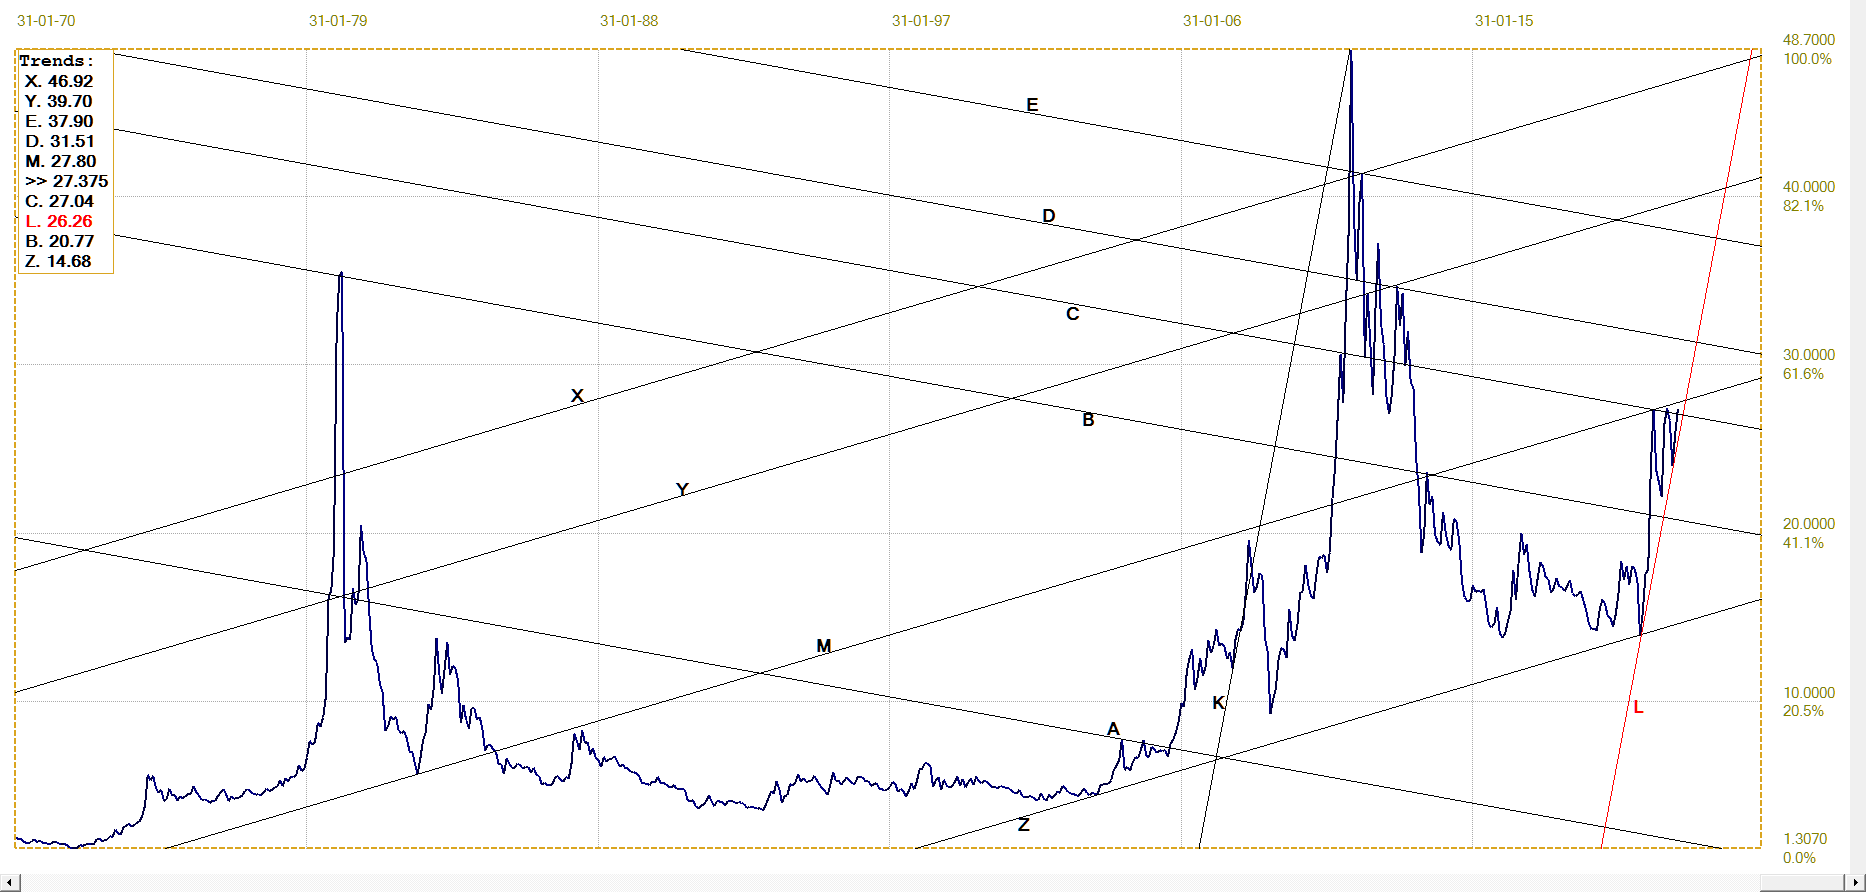
London Silver fix. Monthly close. Last = $25.875
Two of the key barometers of inflation, the yield on the US 10-year treasury note and the price of crude oil last week slipped lower to hold mostly lower and sideways. This action belies the widespread expectation in the market that higher inflation is on the cards and that once it gets moving it will be difficult under the current circumstances to attempt to contain.
The dollar as measured by the dollar index is also holding up well, even though the euro is recovering to reach a new intermediate high on Friday, marginally extending its recent rally. Wall Street also set a new high for the DJIA last week to convey the message that all is well in the US of A. Time will tell whether this general euphoria and expectations of better times ahead happen to be more of a delusion than a well-founded interpretation of the available information on the economy.
Euro–Dollar
The recovery in the value of the euro reversed lower off resistance at line C to break well below line Q. The break lower did not last long. The recovery above line Q then extended to achieve a minor break above line C and set a new intermediate high at line Y. A break back into channel XY will confirm the rally and should see it extend close to the recent high achieved by the euro early in January this year.
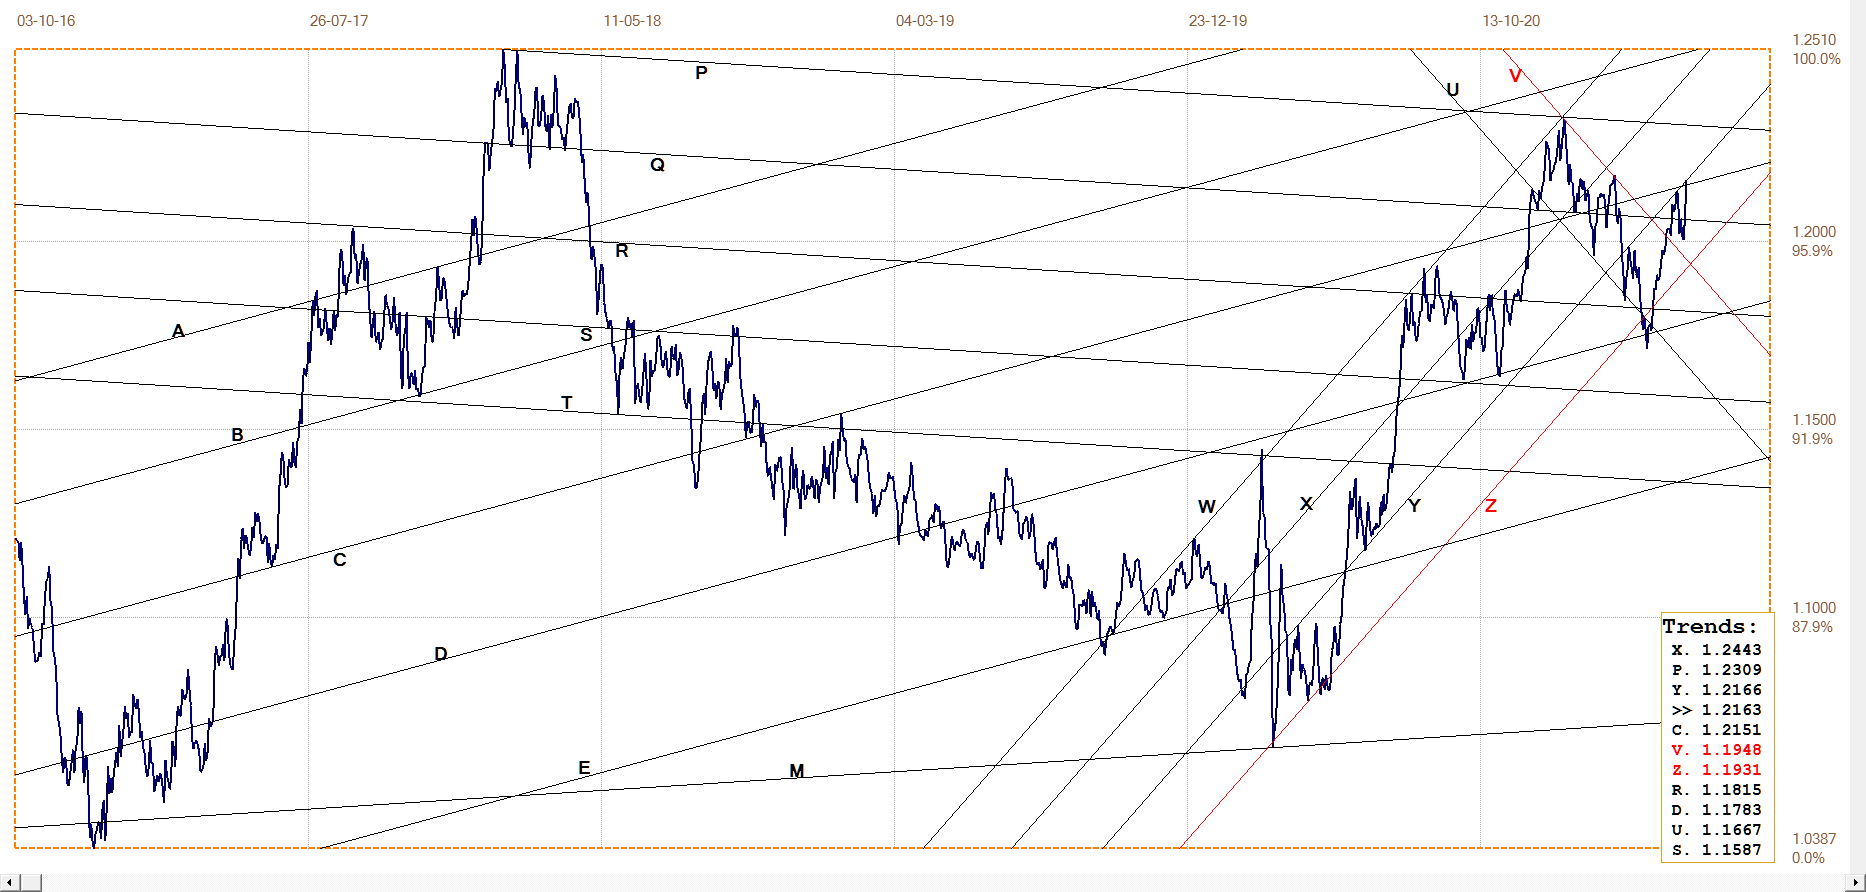
Euro–dollar, last = $1.2163 (www.investing.com)
DJIA daily close
DJIA. last = 34777.76 (money.cnn.com)
The DJIA has resumed its rising trend to move higher out of a period of consolidation that had lasted all of the second half of April. The new move higher has broken a little above channel BC to set a new all time high for the DJIA. Further new all time highs should follow now that a technical break through resistance has occurred. .
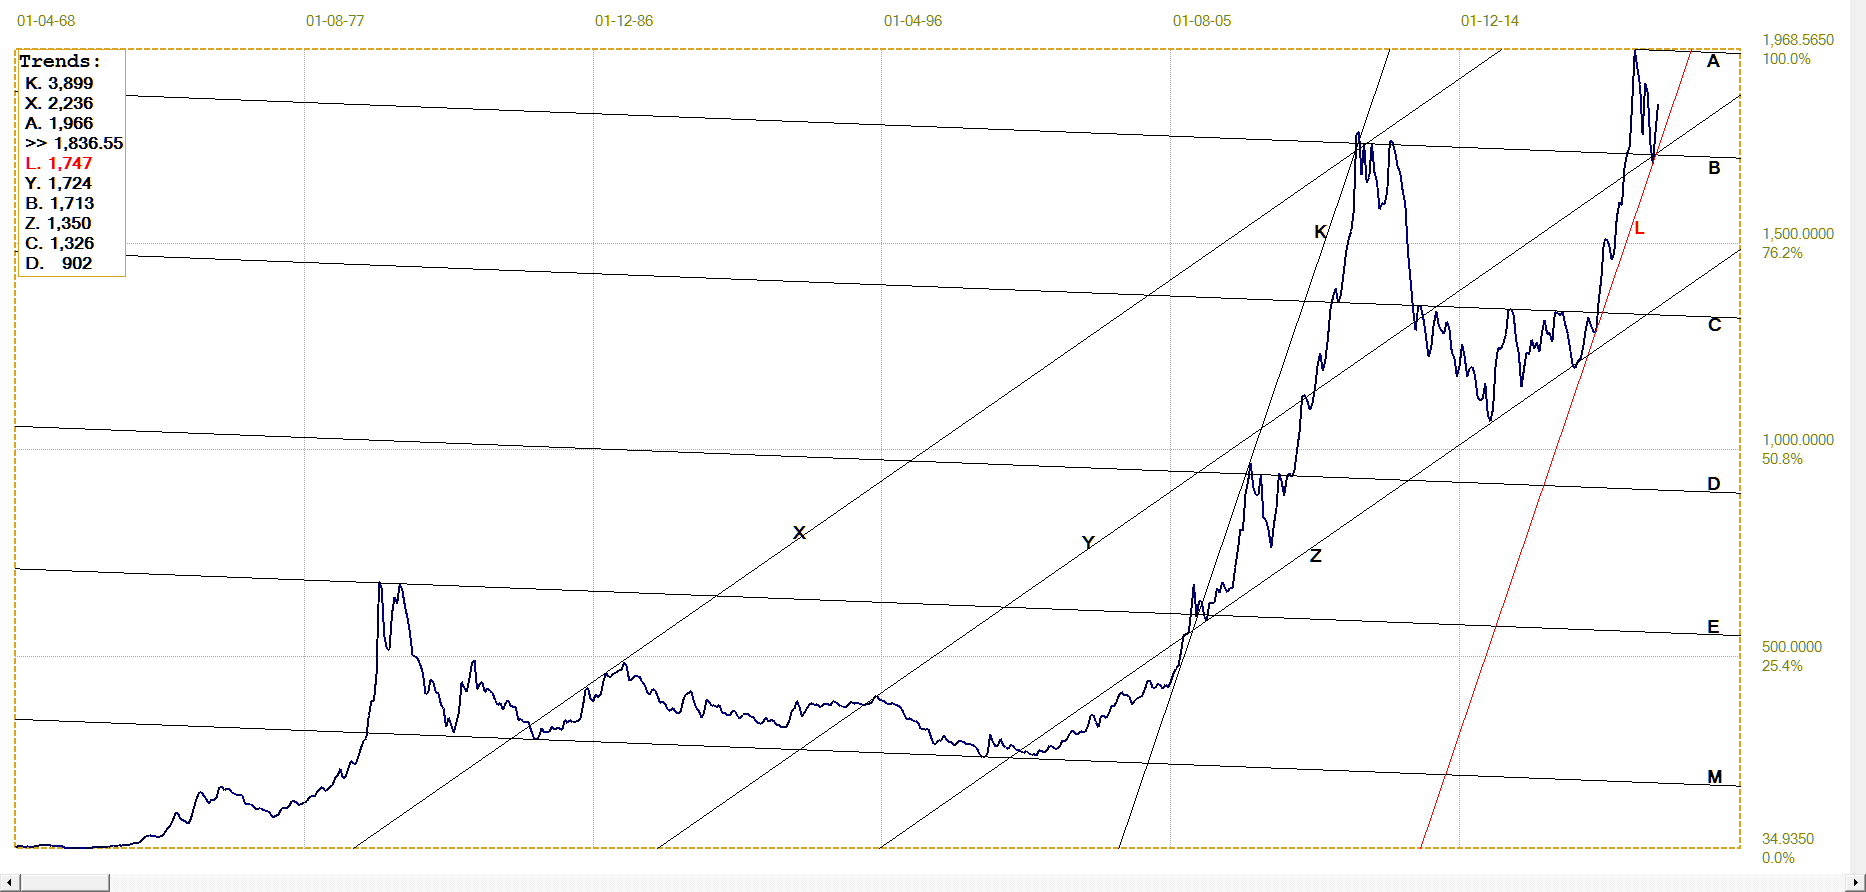
Gold London PM fix – Dollars
Gold price – London PM fix, last = $1836.55 (www.kitco.com)
Last week’s improvement in the price of gold could be either because the month end shenanigans of the Cartel are now history, or in expectation of less interference in the market after Benham has let the cat out of the bag regarding the CFTC’s contribution to the ‘tamping down’ of the silver price. Or a combination of both.
The jumps in the gold OI on Thursday and Friday – by almost 20k and then 10850 respectively – demonstrate that buying was firm and so too was the attempt for a delaying tactic to keep the rally from exploding too rapidly. This week should further distinguish between the bullish demand from a monthly cycle and renewed hope of something developing to put an end to the price suppression.
Euro–gold PM fix
Even with the euro gaining against the dollar, to make euro priced gold cheaper, the euro price of gold is extending its break higher, back into bull channel KL. This trend underscores the fact that the improvement in the dollar price of gold is an aspect of its intrinsic strength and not a reaction to a weaker dollar. Technically, it looks as if the trend can continue higher, still favouring the dollar price of the metal.
Euro gold price – PM fix in Euro. Last = €1514.97 (www.kitco.com)
Silver Daily London Fix
Silver daily London fix, last = $27.38 (www.kitco.com)
Silver broke below the steep bull channel KL following the sustained attack during late March, but then the recovery took it back into the channel. After holding close to the bottom of the channel for some time, the nice rally in the price last week resulted in a spike higher that has opened up a bit of a cushion to line L.
Silver still has a long way to go to reach the level of August last year and again at the end of January when the CFTC assisted in preventing ‘a much worse situation for the silver market,’ according to the acting head of the CFTC. As mentioned earlier, the net OI of the Commercials increased by 2800 contracts last week, with the $1.50 increase in the price last week as a sign that the additional selling had failed to keep the price in check, only to limit the increase. The possibility even exists that during May we will experience another occasion where the CFTC finds itself with the need to ‘control the price and volatility of silver contracts’ in order to prevent a worse situation.
U.S. 10–year Treasury Note
U.S. 10–year Treasury note, last = 1.579% (www.investing.com )
Nothing much to say, really. The yield has settled near the confluence of bull channels EF and XY, bear channel RS and the steep line G. The broad bull channel AF saw the yield rally from 2.7% down to 0.515% and now the yield is trying hard to relive the good times by not breaking higher.
I would guess that the Treasury over the years brought the duration of the bulk of its borrowings lower to ever shorter duration to keep interest as low as possible. They have an incentive to keep the yield contained, more so now that the Federal debt has exploded – and seems set to continue in that vein – to well more than 100% of GDP.
West Texas Intermediate crude. Daily close
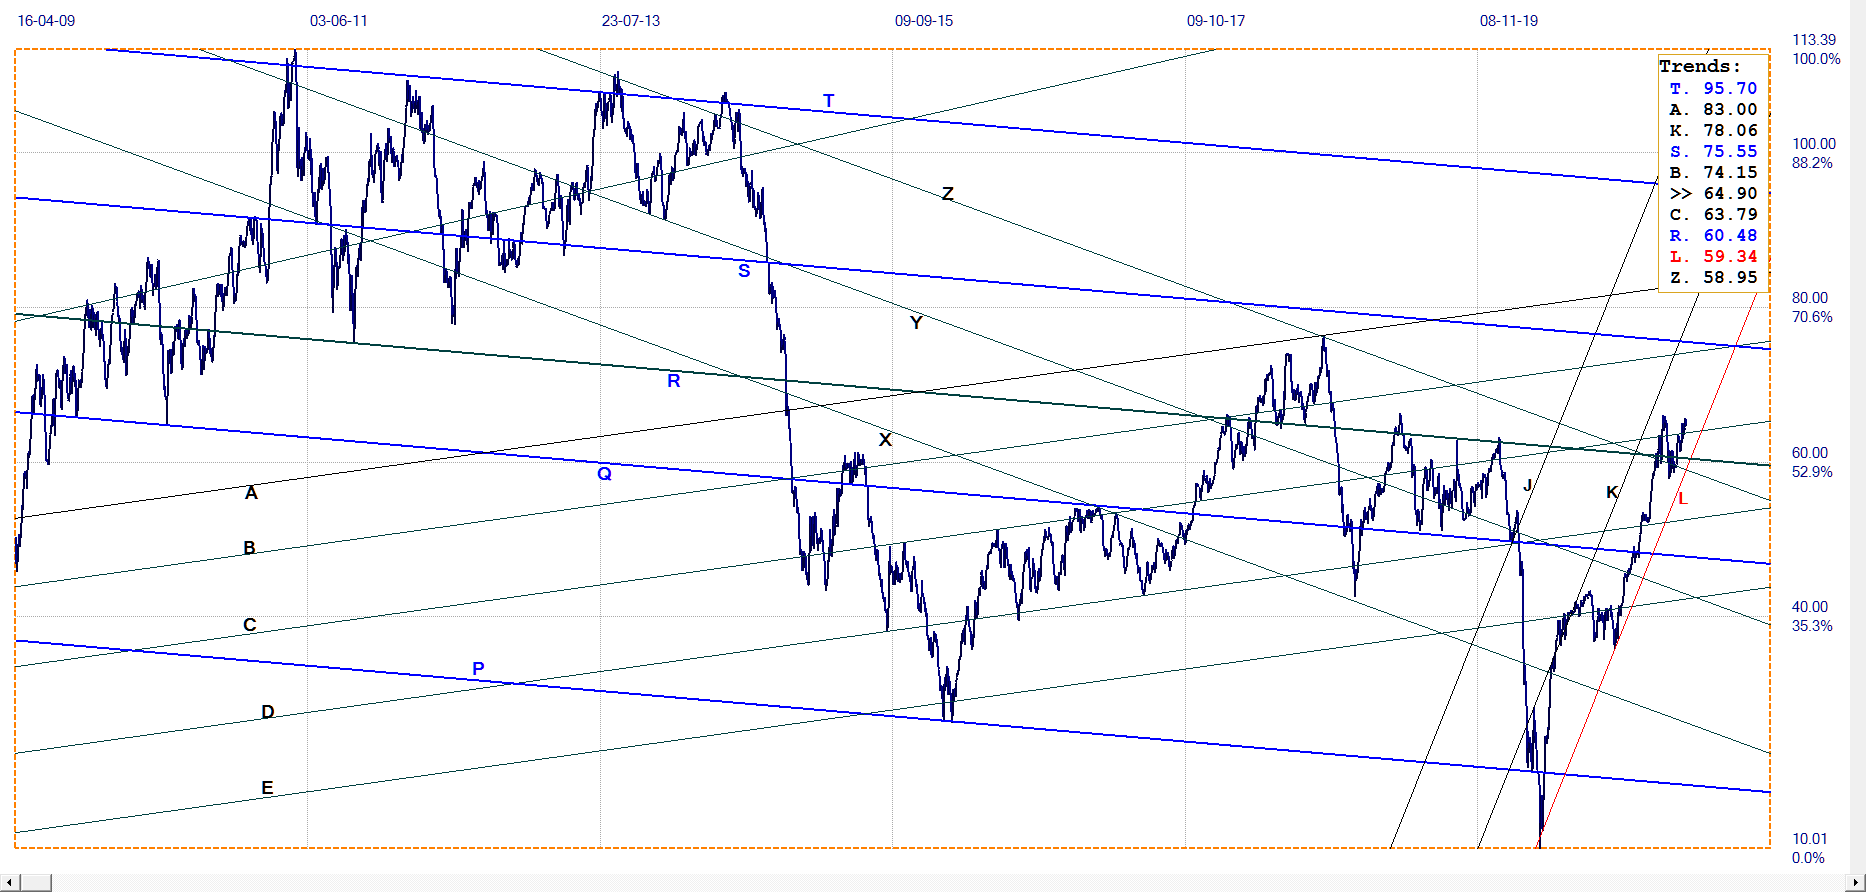
WTI crude – Daily close, last = $64.90 (www.investing.com )
The reversal off the recent high to break back below line R did not last very long. The new break above lines R and C is now only a little short of a double top. It is doubtful though that the double top will hold; problems with pipe lines, both through Executive Order and because of untoward events,s affect both the overall supply and distribution of oil to place upward pressure on prices.
*********
More from Gold-Eagle


