GLD Bleeds Out - Weekly Gold Price Update


The one factor gold bulls have had going in their favor during the recent selloff that occurred in gold and the gold mining shares in this month of October, has been the stellar performance of the reported holdings in the gigantic gold ETF, GLD. It has held rock steady in spite of the carnage witnessed, especially in the mining shares, even as the US Dollar has turned strongly bullish on the technical price charts. It has been a point of solace among the bulls to be able to see the resolve of some of their large sponsors holding firm in GLD.
That came to an abrupt end this afternoon as the numbers were released and they are ugly.
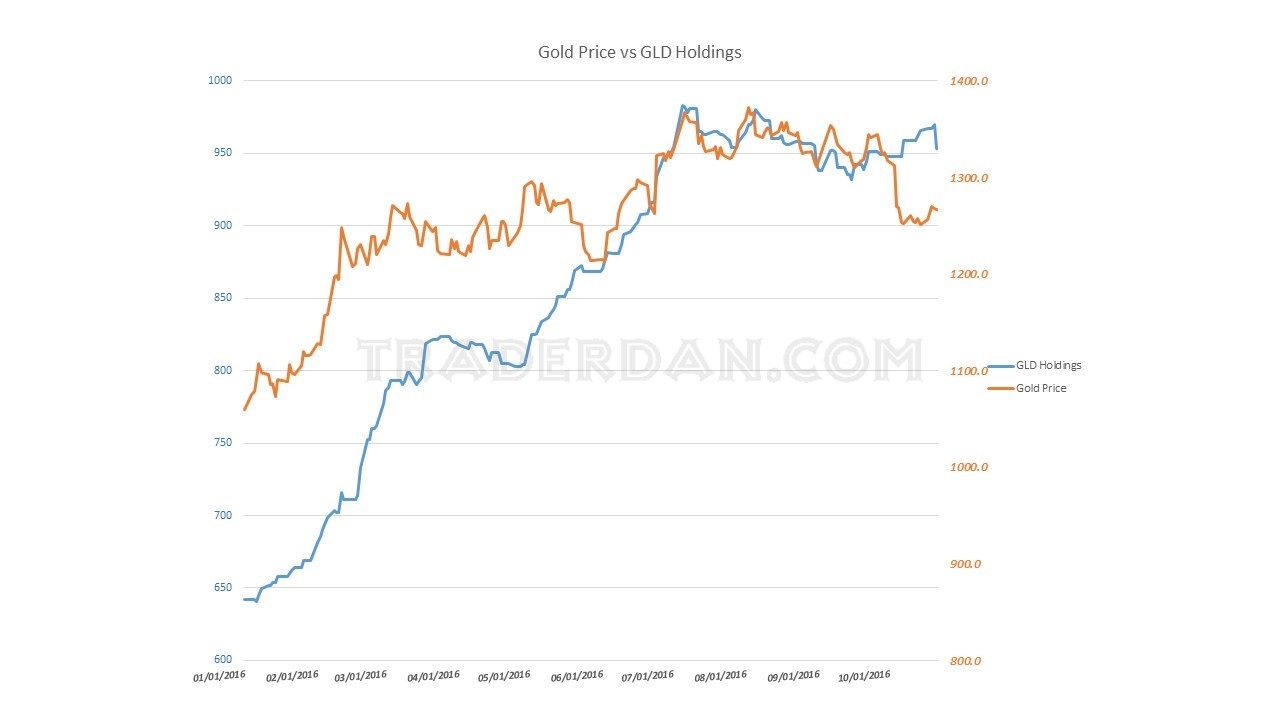
In surprising fashion, given its stability for most of the month, it coughed up a bit over 16.6 tons of gold.
You can see the sharp drop on the chart.
The good thing is that it still has about 5.5 more tons of gold in it even after today’s sharp reduction than it did to start the month of October. Considering that gold itself has lost some $50 over the same time period that has to be a bit of consolation for shell-shocked bullish traders. The big question becomes, “Is this the beginning of the breaking of the dam, or is it more of a one-off, an anomaly that will soon be righted?” Knowing the answer to this in advance would be most profitable. The problem is we are not going to know until events unfold and we observe the results.
The reason that this is such a big deal in my view is because of the other negative factors we have been citing for gold over the intermediate and longer terms.
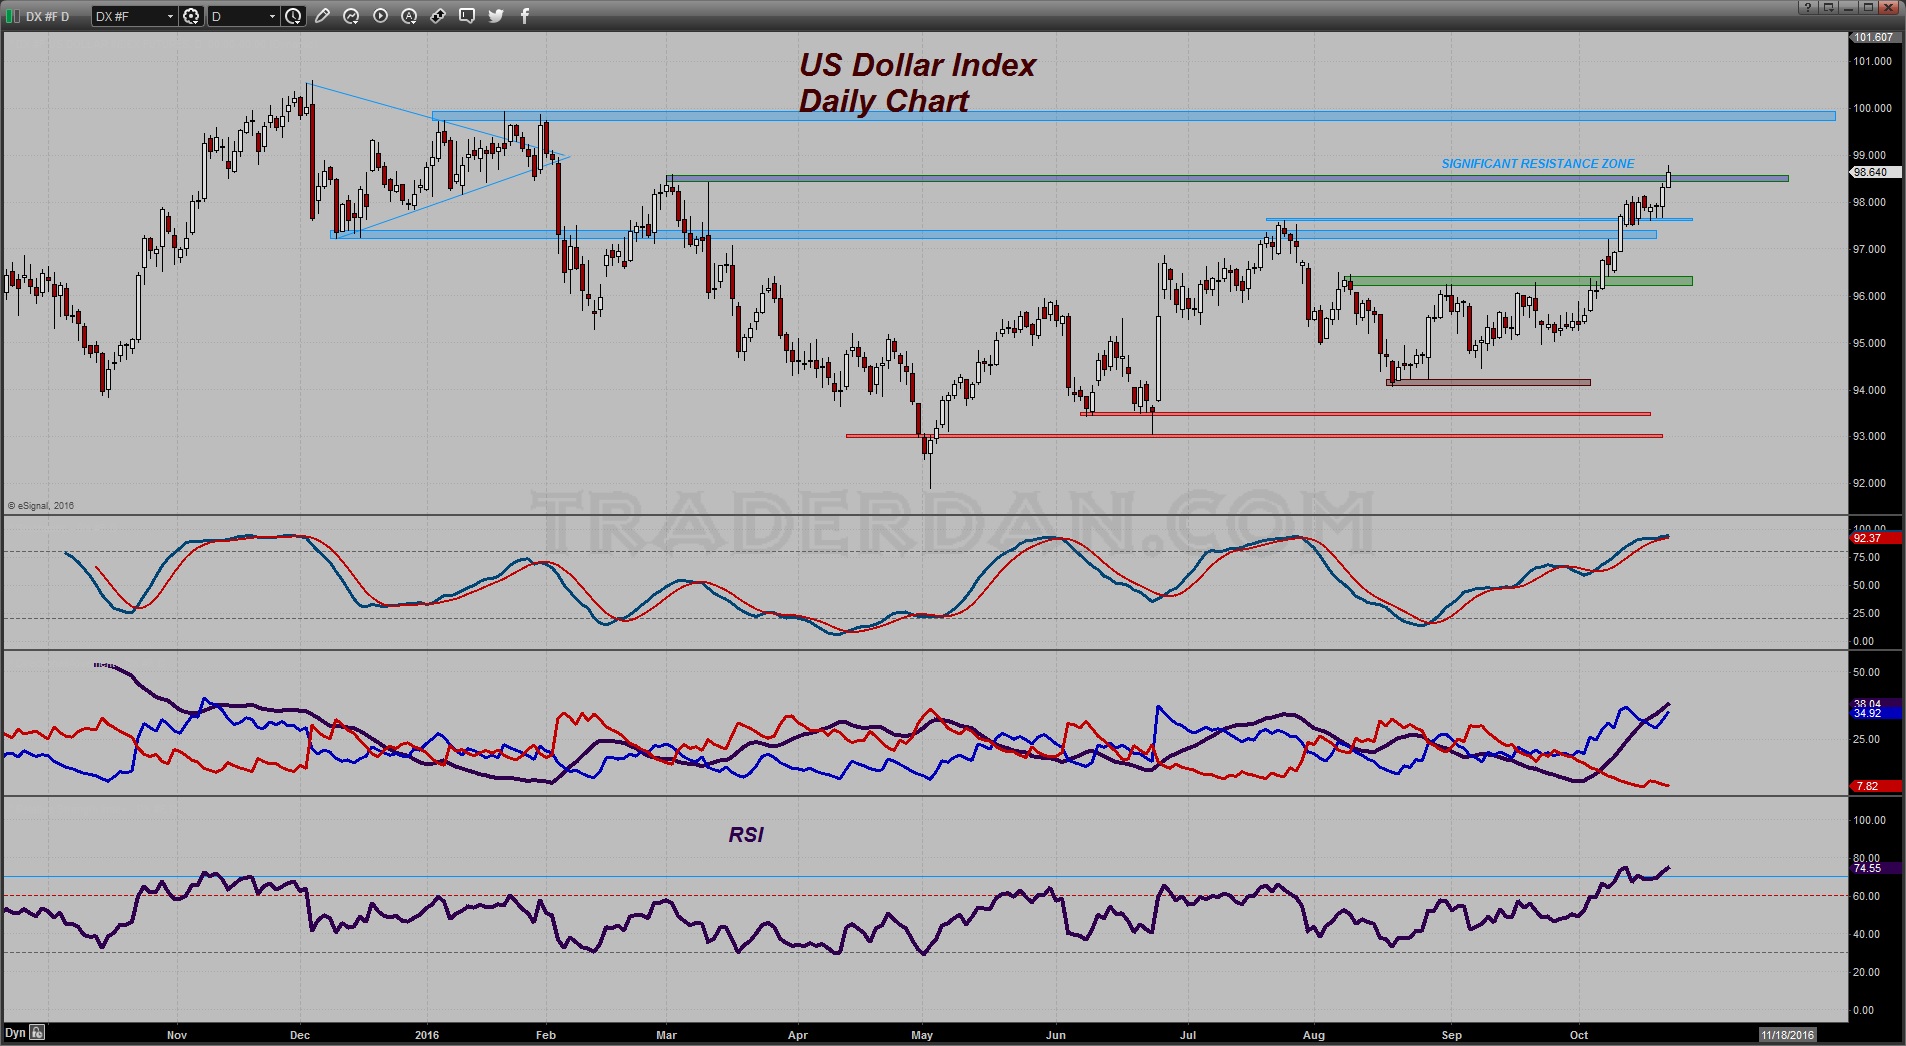
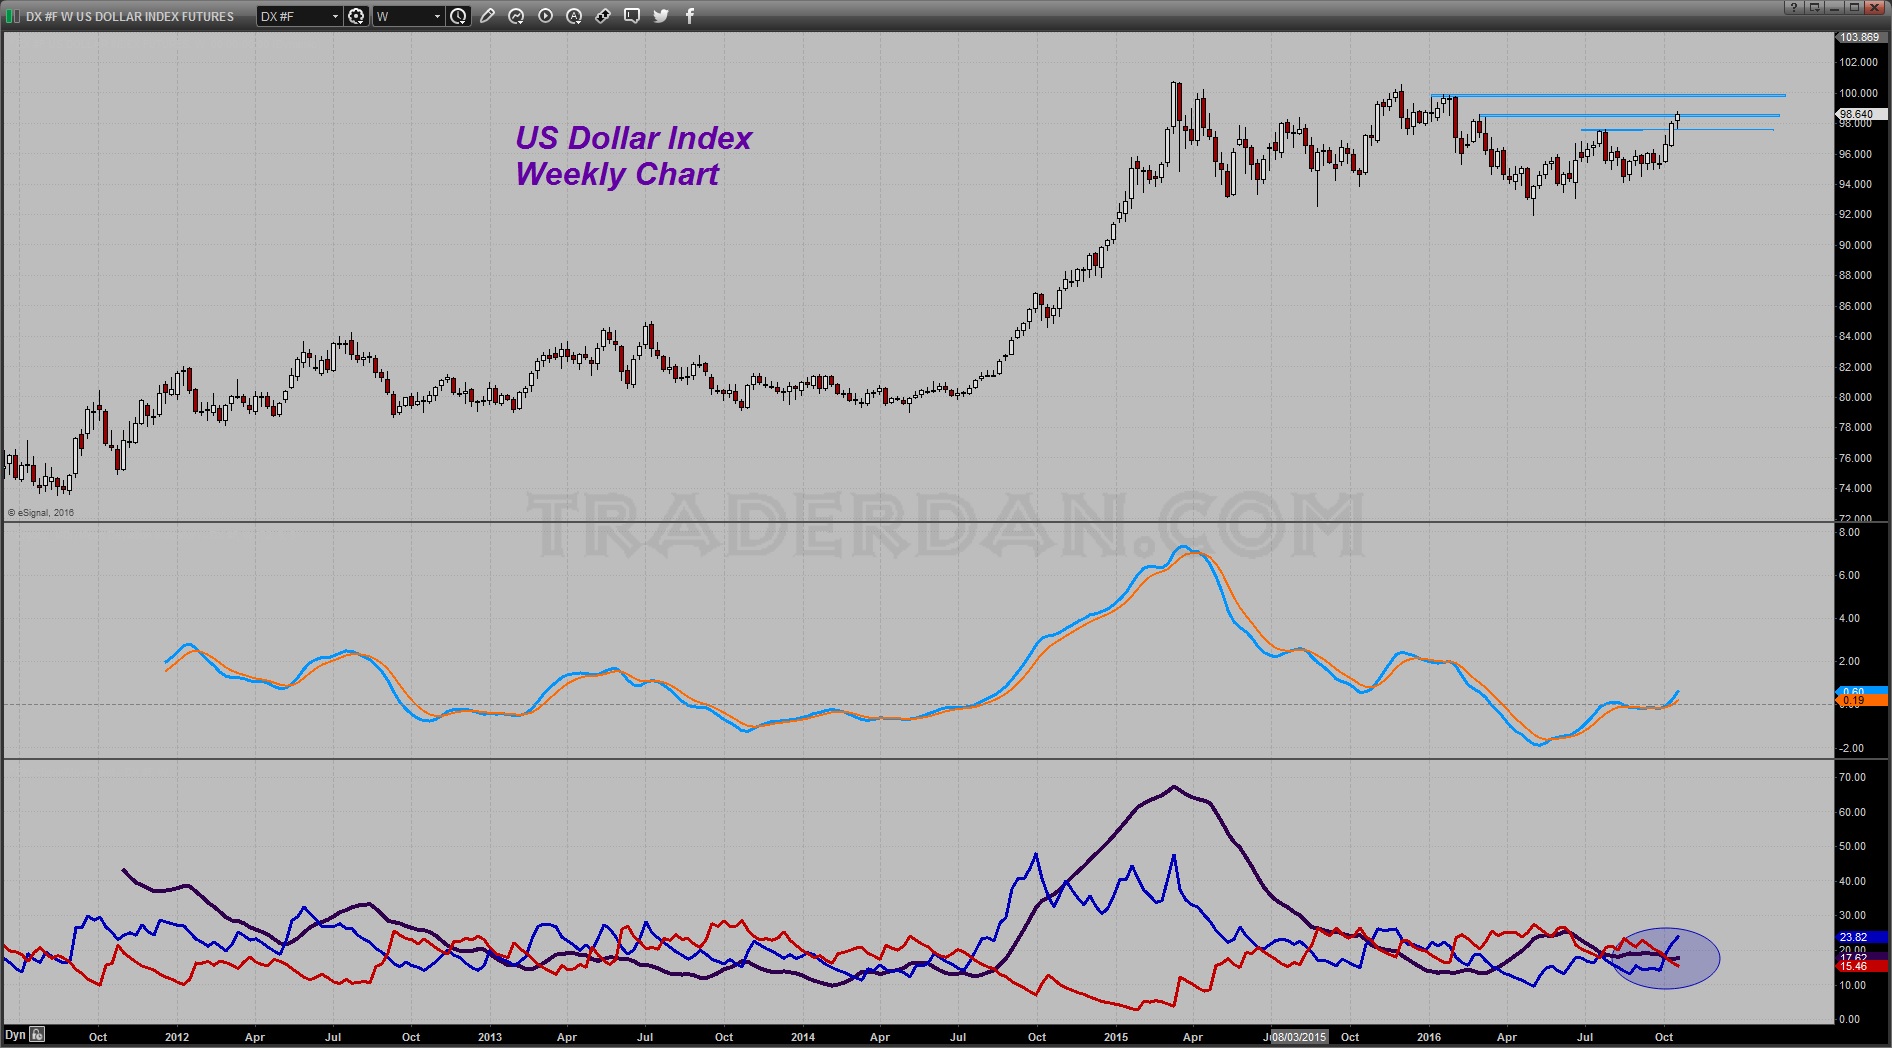
Most notable among these factors is the surge higher in the US Dollar. Simply put, the technical price charts for the Dollar are powerfully bullish.
Gold has been remarkably resilient in spite of the stronger Dollar which I believe is more a function of buying come out of Asia more than anything. That has served to stabilize the price. The problem however remains what it always is when it comes to gold and Asian buying. That buying is good for putting floors under the price of gold but what it is not good for is driving the price of the metal sharply higher. The latter requires strong, sustained and eager Western-based investment demand, the kind of demand that GLD gauges for us. That GLD has bled out so much gold this past week is not an encouraging sign because Asian buyers will not chase the price higher. They are extremely value-conscious; they are not momentum buyers like the Western hedge funds.
I am of the view that the reason the West may be having some second thoughts about gold is not only tied to the strength in the US Dollar, but also to the continued expectation of higher interest rates ahead.
Here again for your convenience is a comparison chart I have created of the gold price overlaid against the big Utilities ETF, namely “XLU”. The two are trading in near perfect lockstep at the moment.
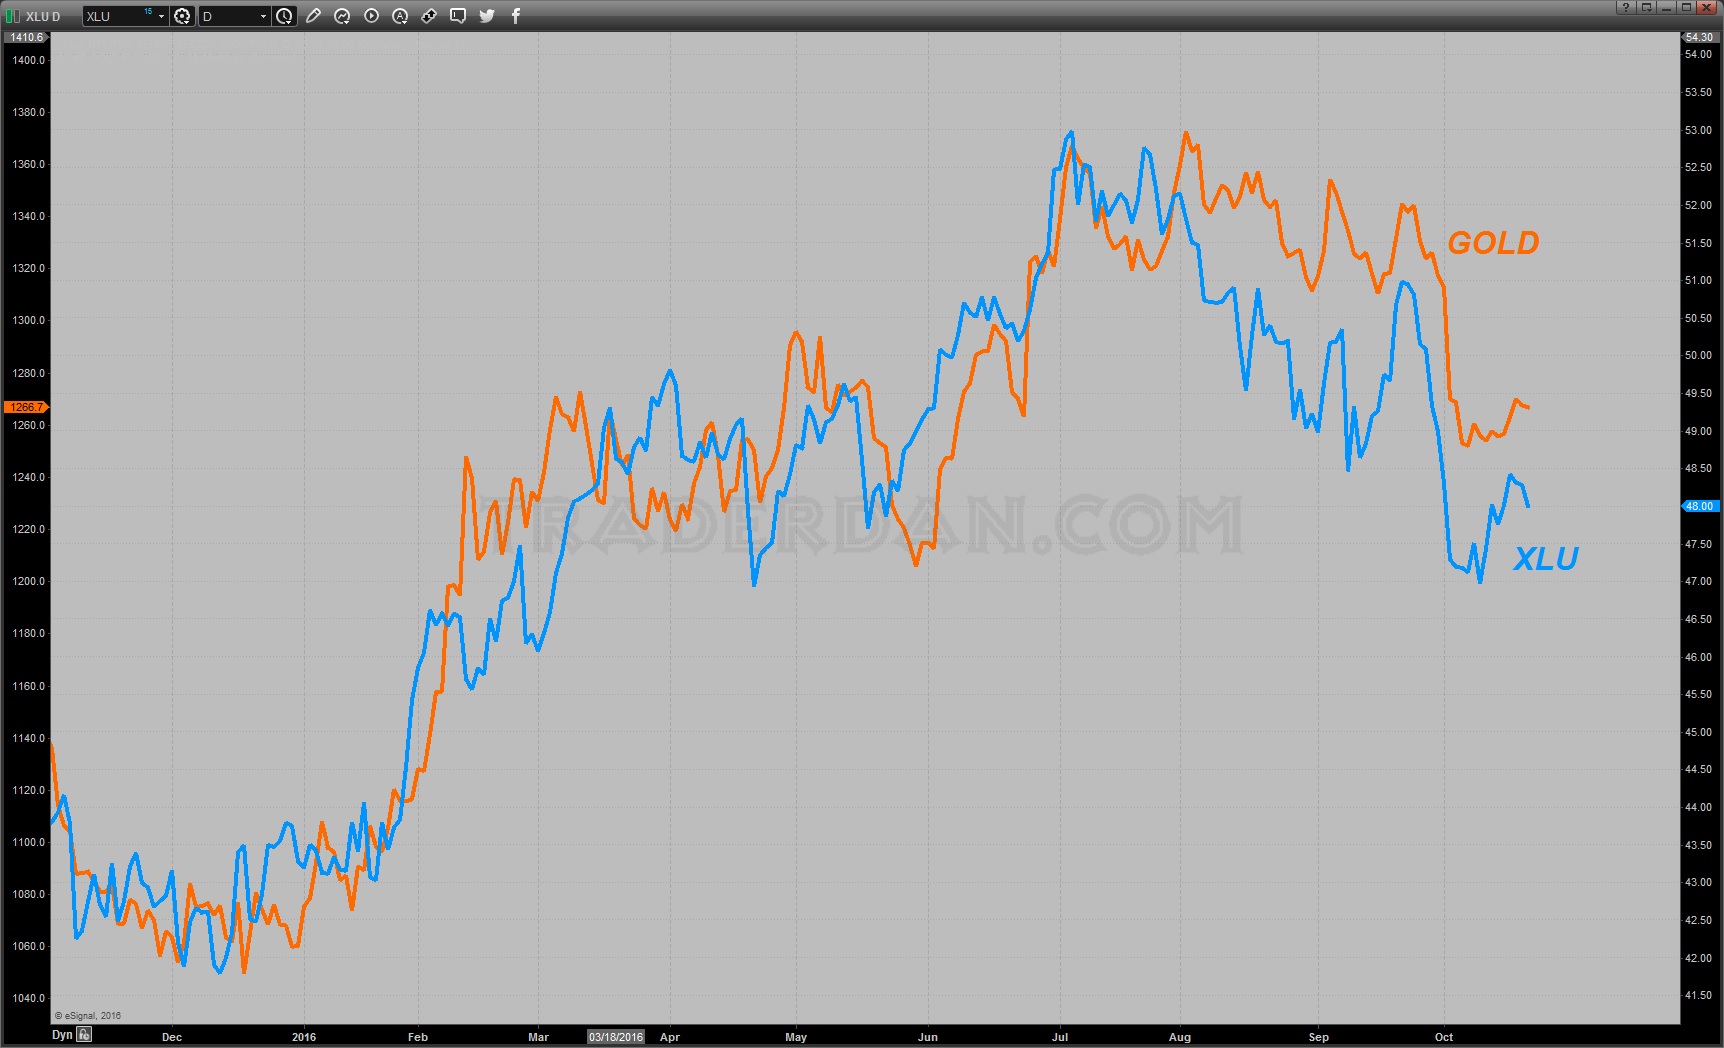
Until the utilities sector gets a bid once more, gold has lost one of the bullish impetuses that were driving it.
Additionally, while the HUI finally showed some signs of stabilizing lately, especially after recovering and moving back above the 200-day moving average ( technically significant), it has thus far failed to garner anything that could remotely be called “bullish follow through enthusiasm”. On the contrary, it cannot even poke its head up into the downside Gap noted on the price chart.
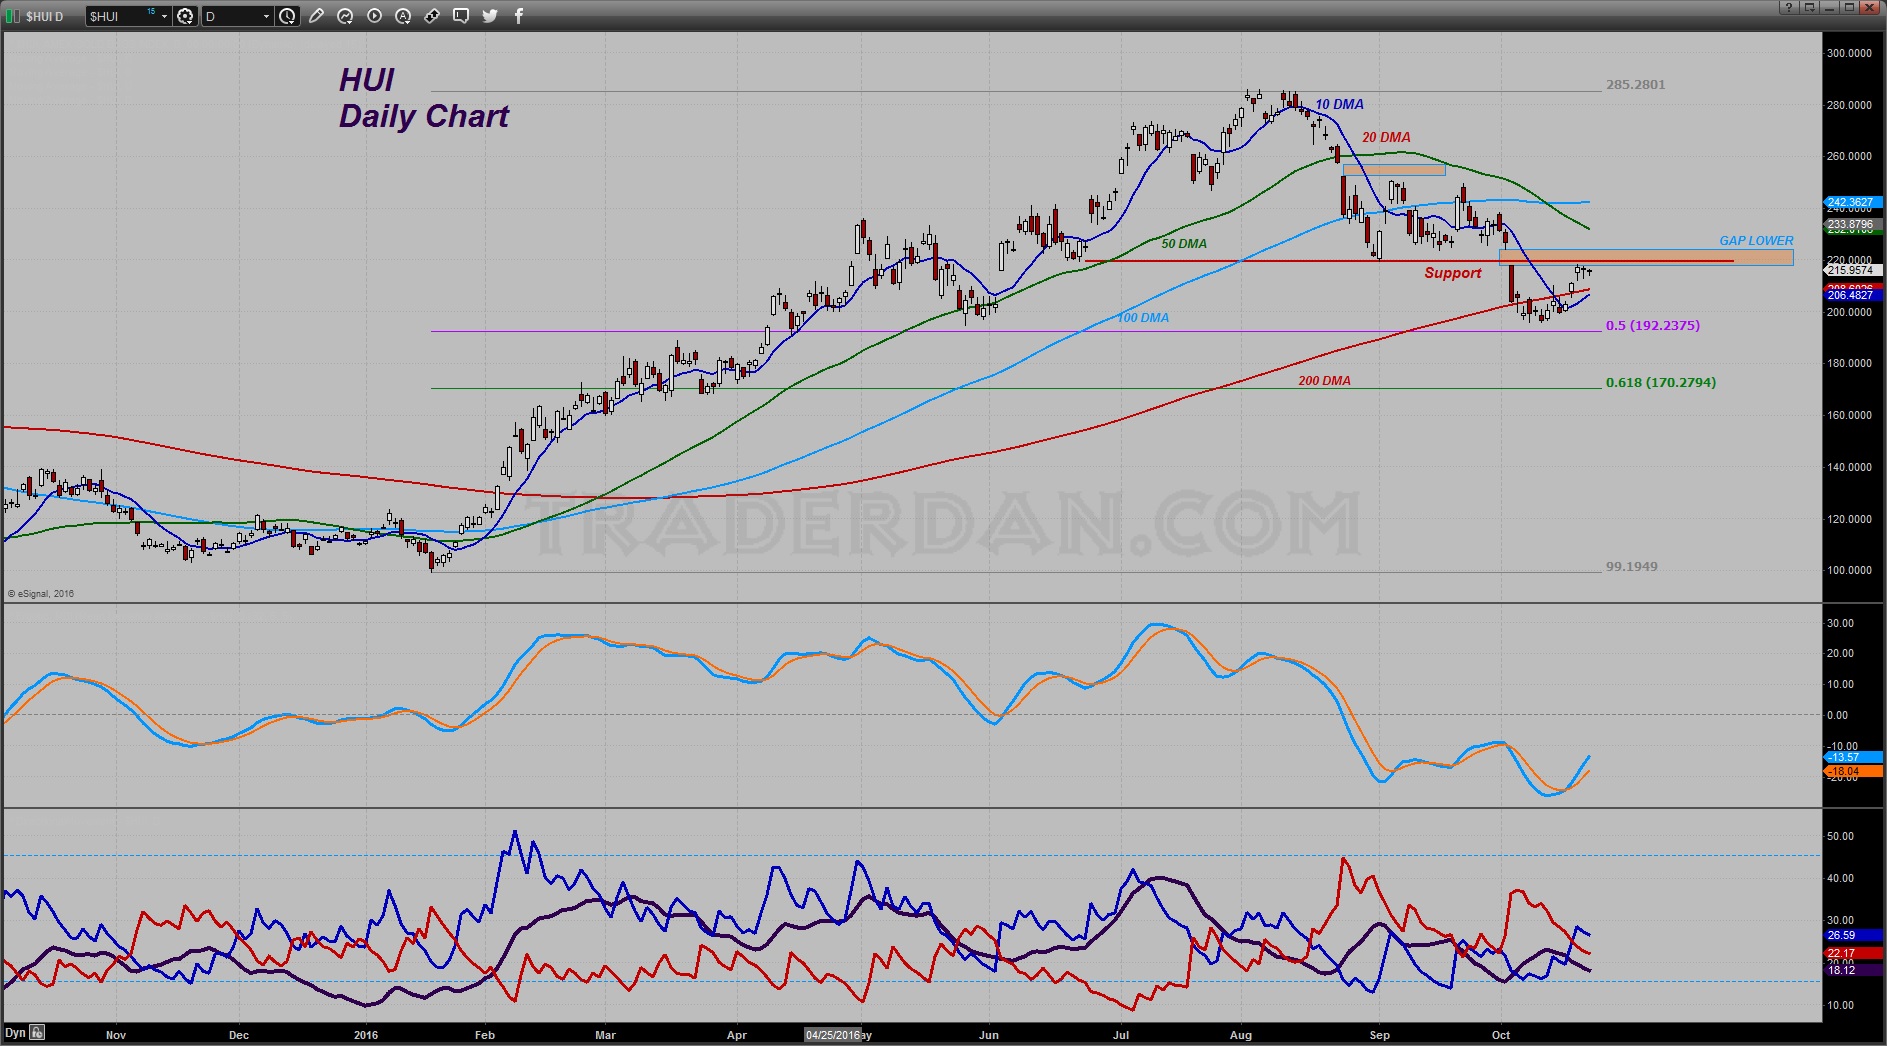
One would have thought that as beaten up as the sector had become lately and as oversold it had been on the price charts, the corrective rally higher would have shown some legs. Instead, it is puking out with the bulls being unable to recruit enough believers to their cause. They are going to have to do better than they have been doing recently to persuade the skeptics, especially when those same skeptics can look over at the Currency boards and see the US Dollar leading practically everything.
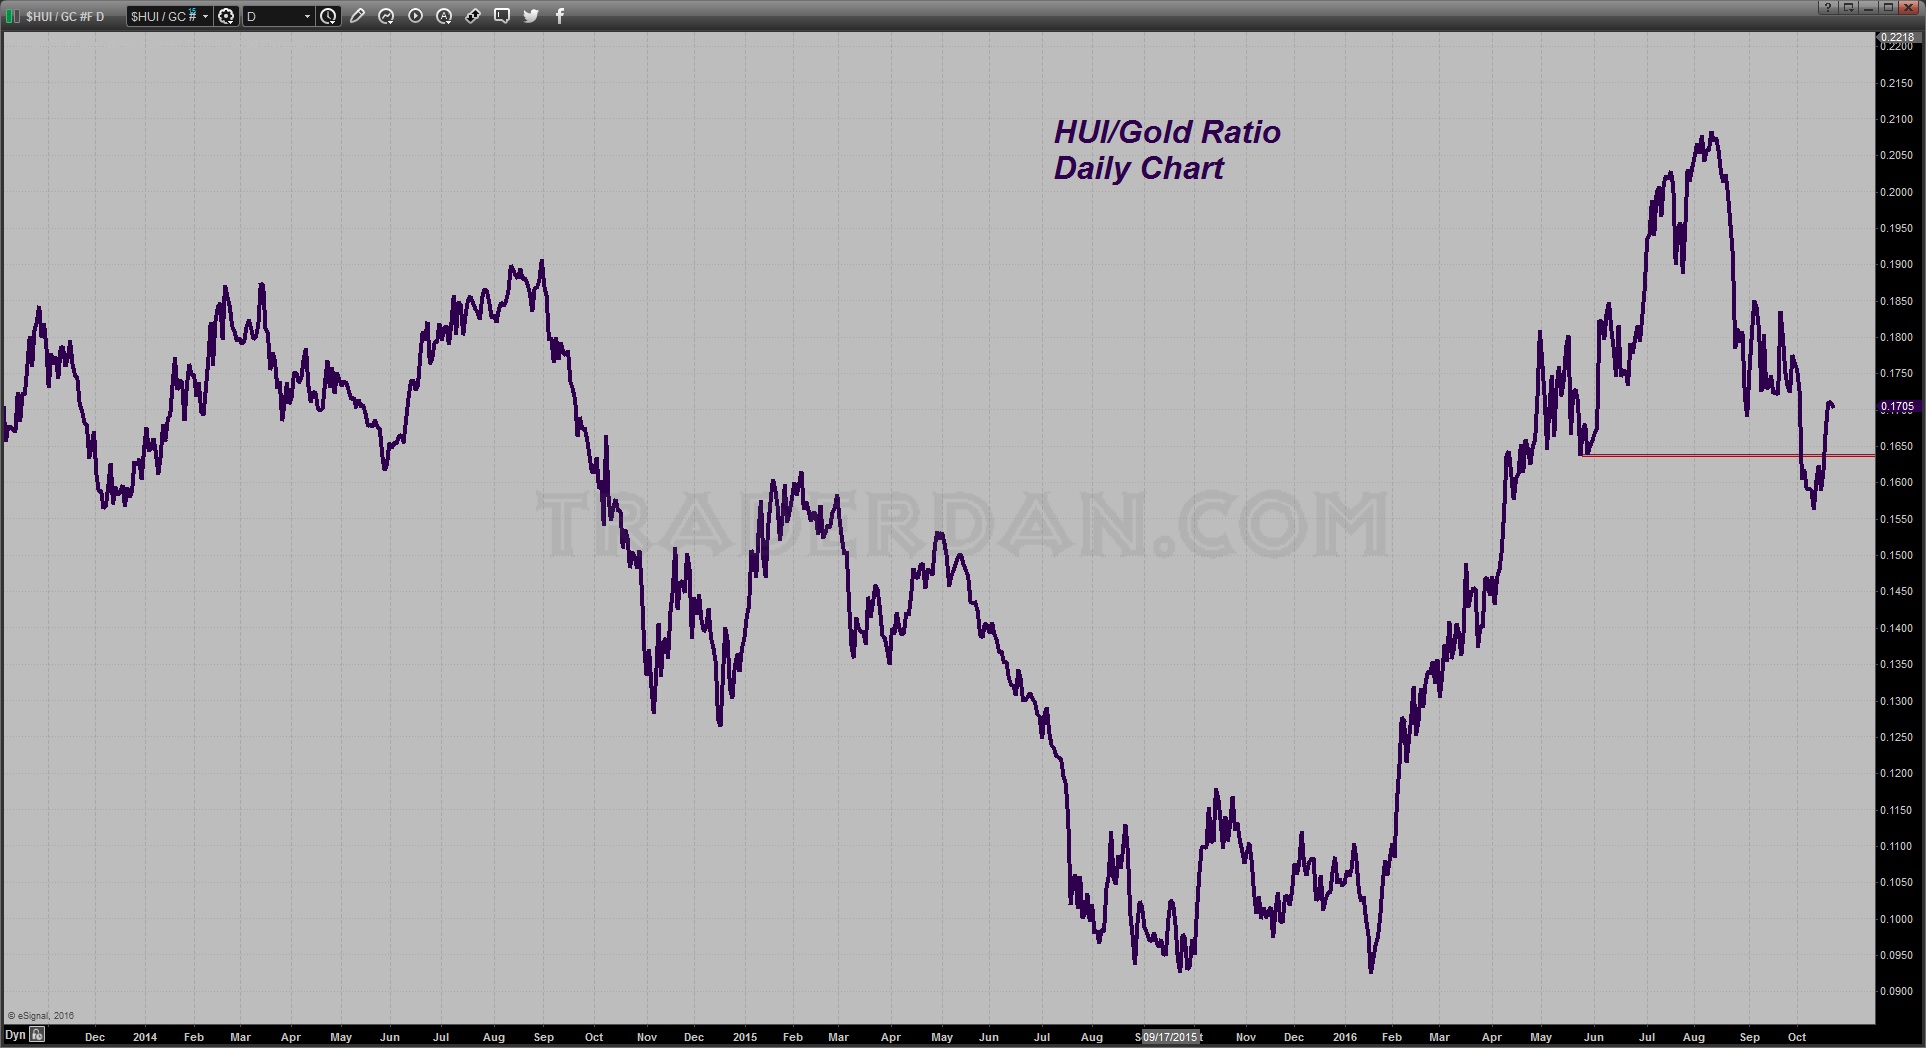
The HUI to gold ratio has improved as it was able to climb back above that broken downside support level formed off the May low but it will need to turn higher immediately next week or it is in danger of collapsing back through that May low. That would be a negative development.
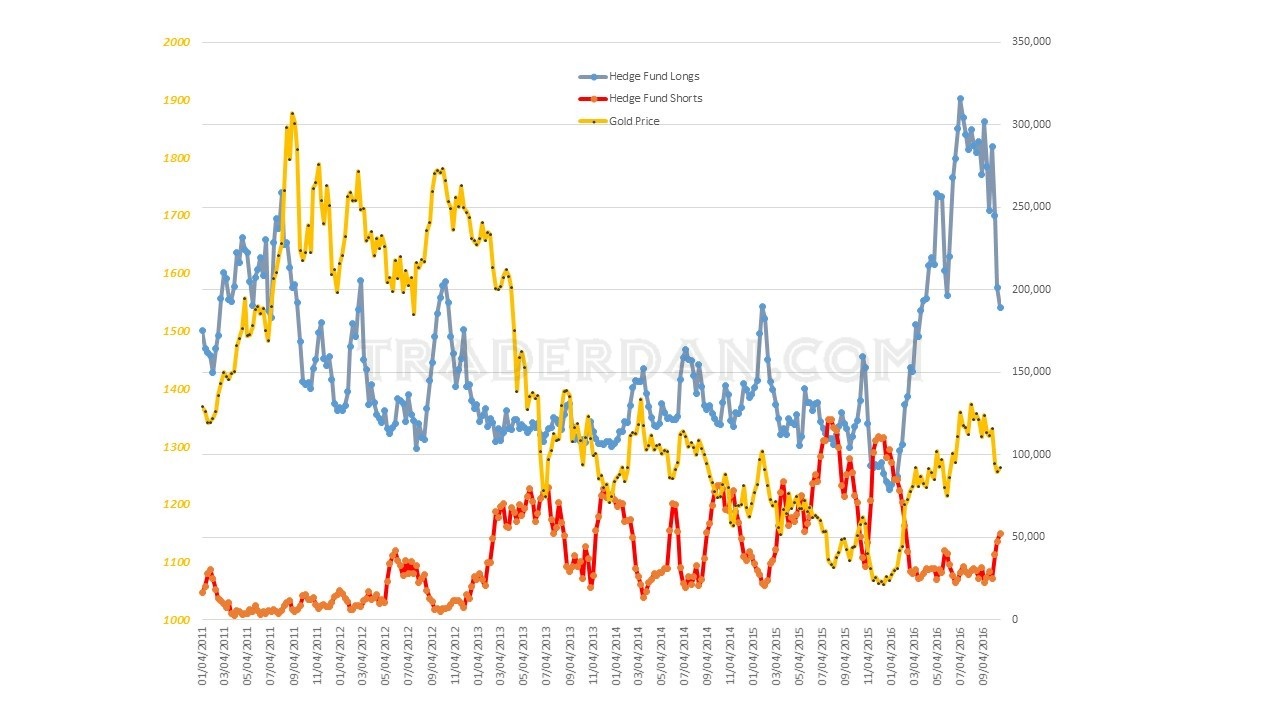
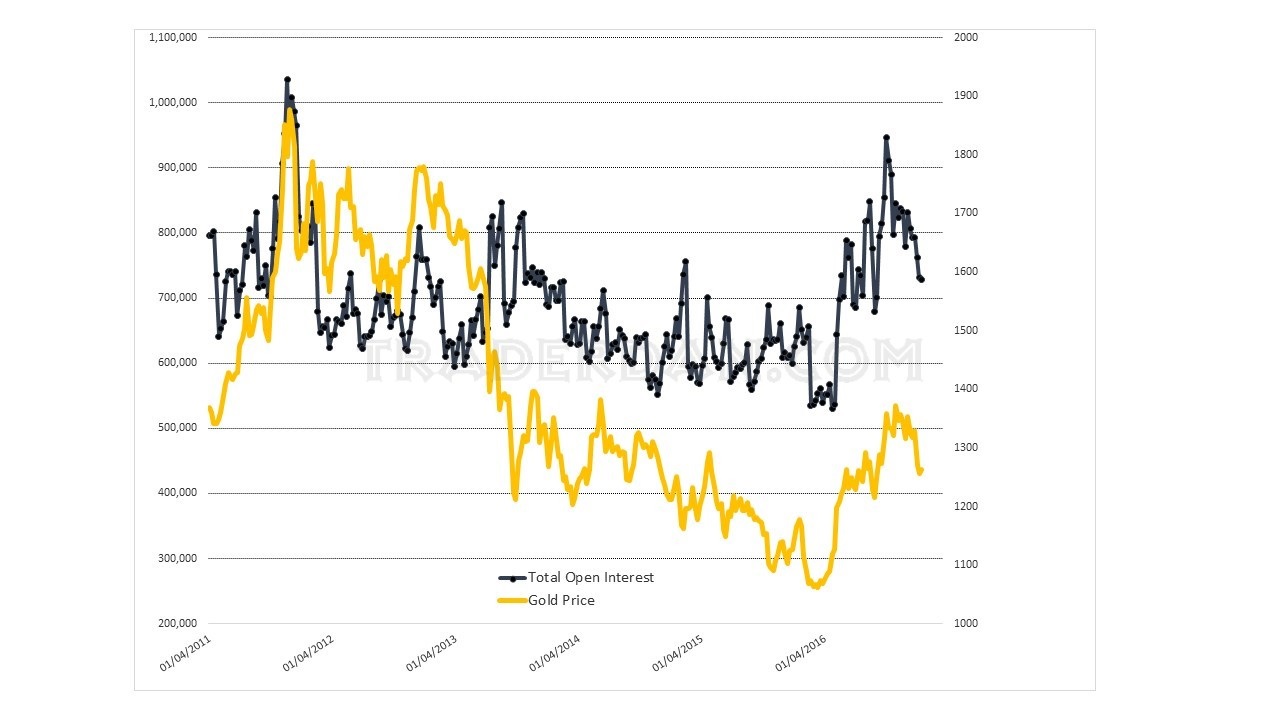
The Commitments of Traders report out today shows more long liquidation from hedge funds and other specs was the order of business over the past reporting period.
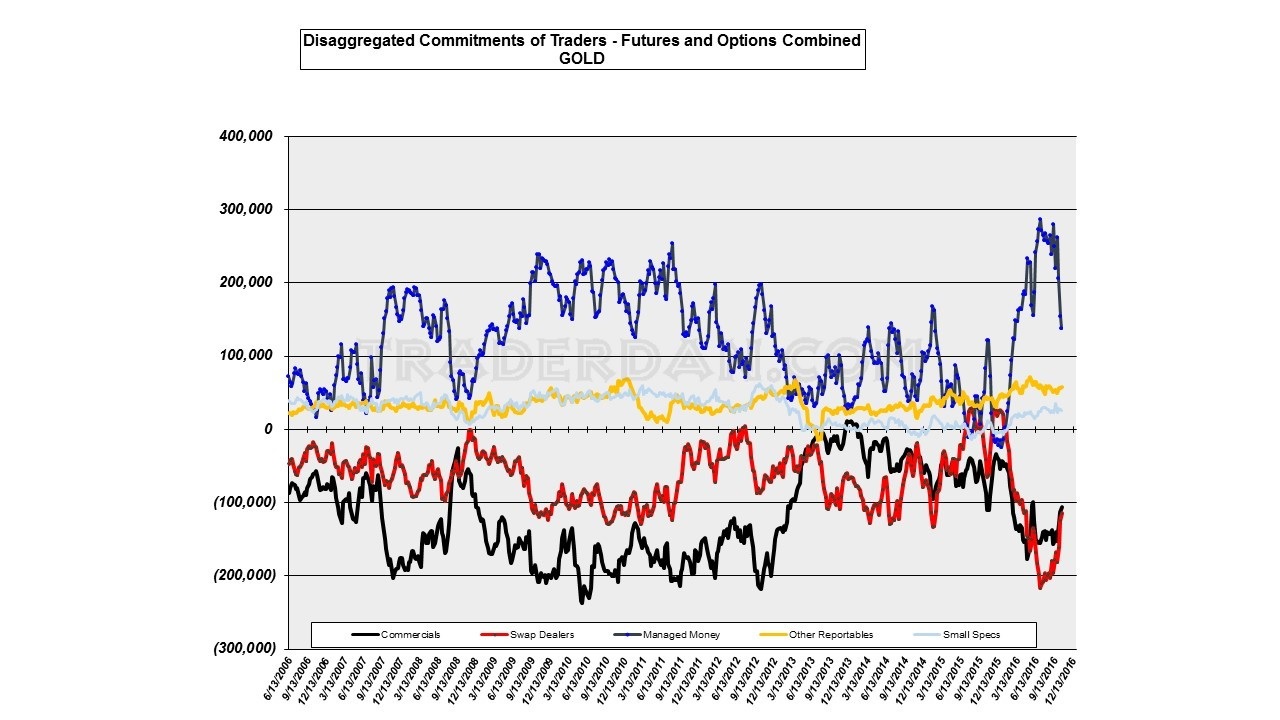
Total open interest continues to decline, something which bears close scrutiny for without an increase here, the path of least resistance for gold is going to be lower.
The weekly or intermediate term gold chart is currently in a negative posture and will remain that way until or if bulls can take the price back up through the bottom of the box (range trade) out of which it fell.
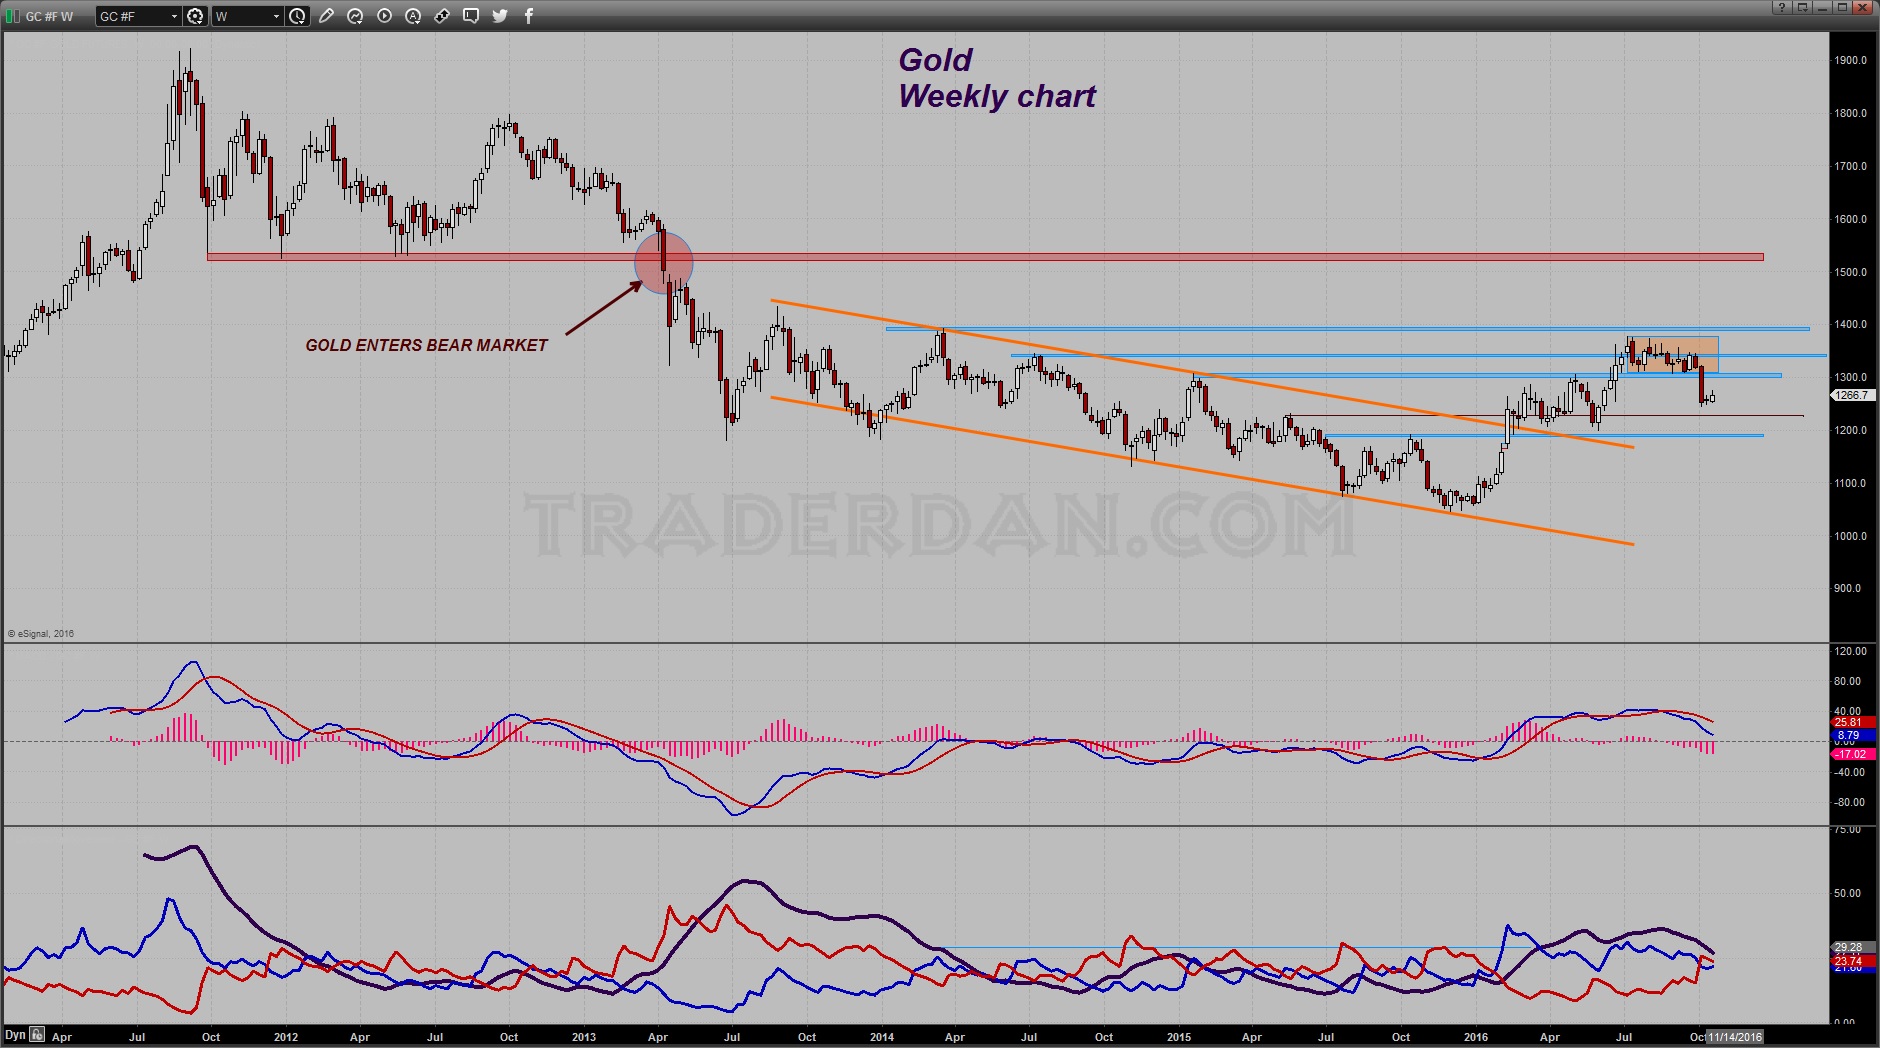
A handle change to “13” will first be necessary if that is to take place.
Downside chart support lies near $1250-$1245. Below that is $1230-$1228.
********
Courtesy of Trader Dan http://traderdan.com/
More from Gold-Eagle


