Gold’s Fresh Highs; Fed’s Cred Demise?


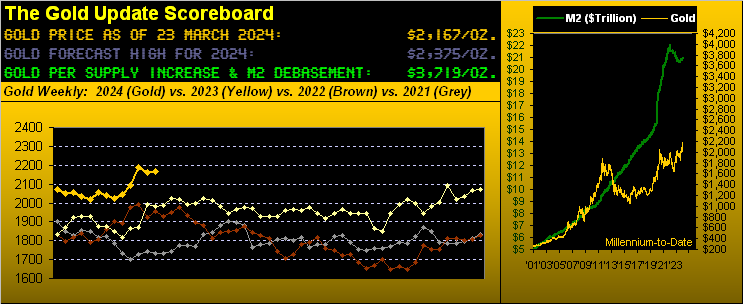
Gold recorded another series of fresh All-Time Highs this past week in eclipsing the 2203 level (from 08 March) in a swift run up to 2225 on Thursday before coming off (as we’ve written “expectedly”) in settling yesterday (Friday) at 2167. Still, given Gold’s momentum with but a week to go in Q1 of 2024, our forecasted year’s high at 2375 remains rightly reasonable.
But let us again head with the Fed, indeed query if ’tis losing its cred. Clearly that which we herein penned a week ago “…Obviously the FOMC shall unanimously vote to do nothing with its Bank’s Funds Rate…” is exactly what occurred per the Open Market Committee’s Policy Statement issued on Wednesday. Our takeaway these many years — rather than watch all the FinMedia bilge — comes from simply reading the Statement, in which for 20 March are these three key sentences:
- “The Committee seeks to achieve maximum employment and inflation at the rate of 2 percent over the longer run.”
- “The Committee does not expect it will be appropriate to reduce the target range until it has gained greater confidence that inflation is moving sustainably toward 2 percent.”
- “The Committee is strongly committed to returning inflation to its 2 percent objective.”
Yet even as inflation is ticking higher — above and beyond 2% — three FedFunds rate cuts remain on the table for the balance of 2024? What? “Curiouser and curiouser!” cried Alice…
To be sure, you’ve already seen the inflation tables we’ve presented in recent missives. So this time, let’s get graphic(!) Thus from 12 months ago-to-date (March ’23 through February ’24), below are the headline and core charts for the Consumer Price Index (CPI-retail inflation), Producer Price Index (PPI-wholesale inflation), and Personal Consumption Expenditures (PCE-Fed-favoured inflation). Note: the PCE February data points are the consensus estimates as the report is not due until next Friday, 29 March (the markets actually being closed that day). Therein: each data point is annualized per that month’s reading; each inflation track is accompanied by its dashed trendline; each panel is identically scaled; and the Federal Reserve’s 2% target level is in red. And again we say: “We’re going the wrong way”. Still, Bloomy ran this past week with “The Great Inflation Scare is Fading.” Clearly they don’t have these charts:
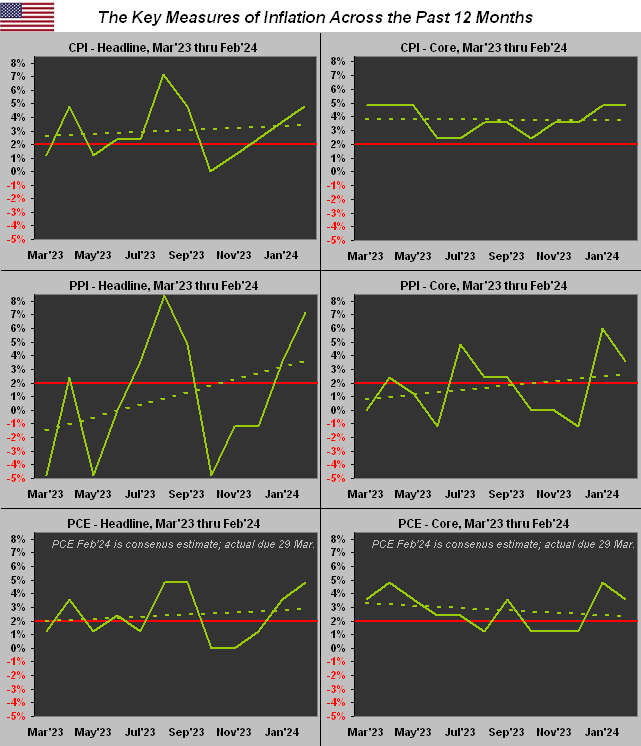
Demonstrably, the rightmost datapoint (February ’24) in every case is above the Fed’s 2% target. Moreover: most of the dashed trendlines are rising up and away from that target, the notable exception ironically being the “Fed-favoured” inflation measure of “PCE – Core”, the trend for which is admittedly nearing said 2% target. But really: three rate cuts? How about a rate hike? (Perhaps we ought apply to be on the FOMC, but the pay cut would be too dear…)
Hardly dear is dear old Gold. Its present 2167 price is -42% beneath our opening Gold Scoreboard’s Dollar-debasement valuation of 3719. So to Gold’s weekly bars we go, the rightmost blue-dotted parabolic Long trend now a young three weeks in duration in this year-over-year view:

However, let us temper the rejoicing of Gold Going Great with some present technical negatives, courtesy of the “Party Pooper Dept.”, albeit with this caveat as penned a week ago: “…they’re clearly stretched to the upside, however great bull markets (or the resumption thereof) do breakout as such…” That for you WestPalmBeachers down there means Gold when technically overbought might actually be considered a good thing.
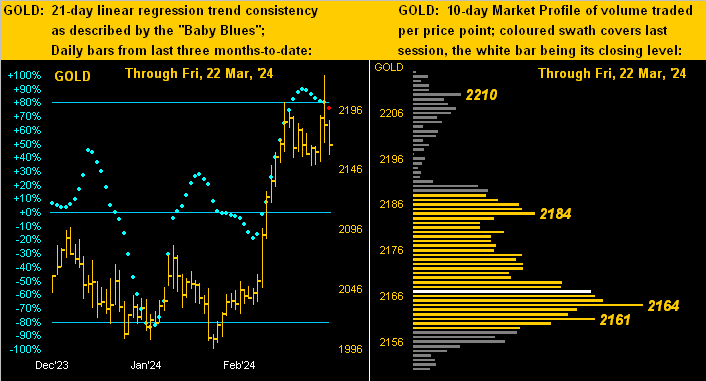
Either way, we’ve the following two-panel graphic. On the left again is Gold vis-à-vis its smooth valuation line from three months ago-to-date. Price at present is +71 points above the smooth line, the red down arrows suggestive of the eventual meeting of price with value, (that line itself on the rise; the points difference between price and value is at the foot of the panel). On the right are Gold’s daily candles across the past 21 trading days (one month) along with the Parabolics study that currently is our leading Market Rhythm for Gold: note the rightmost red-encircled dot which heralds the start of a Short trend. (Too, we’ll later see Gold’s “Baby Blues” of trend consistency suggesting lower price levels ahead). Here’s the graphic:
“So, mmb, the question becomes ‘How low is low’, eh?“
So ’tis, Squire, (barring the technicals instead catching up to price, which again in a bullish breakout is mathematically natural). Regardless, in looking above at the right-hand panel of Gold since a month ago, “The Big Move” in round numbers was +100 points from 2050 to 2150. Thus by structural support, that latter number ideally would be as low as Gold goes near-term. But with three technical negatives all simultaneously in play (price above value, Short daily parabolic trend, and as noted we’ll see, a breakdown in Gold’s “Baby Blues”), we sense 2150 shall bust, (this past week’s low having already touched 2149, but ’twas prior to Thursday’s 2225 All-Time High).
Nonetheless, does all that mean a full retracement back down to 2050 is warranted? ‘Tis dependent on buyside enthusiasm: through the 57 trading days year-to-date, Gold’s average daily COMEX contract volume is 208,633; yet for these past five days, the average is +15% higher at 240,638. We can therefore say that “Gold is in play”: however, Friday’s down day (high-to-low from 2188-to-2158) sported Gold’s largest one-day contract volume this year at 391,750, such “mo-mo suggesting more low” should dip buyers wait out more downside show. ‘Course, broadly on balance, Gold continues to look good to go with eventually higher levels to bestow.
Meanwhile, bestowed upon a needy, stagflative Economic Barometer this past week was improved data for housing. The National Association of Home Builders Index gained ground in March as did February’s readings for Housing Starts, Building Permits, and Existing Home Sales. In an otherwise light week for incoming data, the only “negative” metric was a slowing in March’s Philly Fed Index: but its result (3.2) was positive for just the fourth time in the past 22 months: “Fly, Eagles Fly”[Borrelli/Courtland, ’55]. Here’s the Baro:
Yet does stagflation still lurk for the economy? Next week for the Econ Baro we’ve 14 metrics, just seven of which are expected to show period-over-period improvement. And again, the aforementioned February PCE, along with that month’s Personal Income/Spending, are to be released on next Friday’s holiday, meaning they can’t be traded upon until Monday, April Fools Day … oh baby.
As for the Casino 500, ’tis “nuthin’ but new highs” as the stock market continues to “price in” the same news over-and-over-and-over again. Week-after-week we read of the market rising day-after-day because of “Breaking News: The Fed Will Cuts Rates Three Times This Year!” The S&P is now “textbook overbought” to the tune of 45 consecutive trading days: going all the way back to the year 1980, that streak ranks in the 98th percentile of such overbought condition. Indeed yesterday, Janus’ Bill Gross characterized today’s investing climate as “excessive exuberance”. ‘Course, Smart Alec shan’t sell his shares until he (along with everyone else) is scared, the broker then crediting his account with IOUs when the money isn’t there*. (“Pssst: Got Gold?”)
* As of 22 March ’24: S&P 500 market cap: $45.7T; U.S. liquid money supply (M2): $21.0T.
Next we’ve got more of Gold, and Silver too. Beginning with the yellow metal is our two-panel display of Gold’s daily bars from three months ago-to-date at left and 10-day Market Profile at right. Note the “Baby Blues” which depict trend consistency: we’ve actually coloured the rightmost one in red given its having dropped below the key +80 axis level. That generally leads to lower Gold levels near-term. For example: from one year ago-to-date, such “Baby Blues” slip phenomena has occurred on three occasions, the downside price movement within 21 trading days (one month) ranging from -10 points to -49 points, (i.e. were that to pan out in this case from today’s 2167 level, Gold would head down into a range between 2157 to 2118, just in case you’re scoring at home). As for the Profile, Gold is now sitting just above the trading support labeled as 2164:
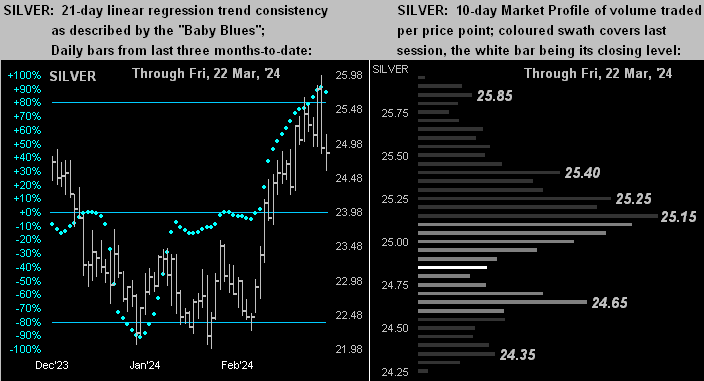
For the white metal, Sister Silver’s resent sweet ascent is now being met with some dissent. With the like drill as shown for Gold, her “Baby Blues” (below left) have just kinked down, and Profile support (below right) shows at 24.65. Should Silver sustain a bit of a hit, the high 23s would likely seem fit:
To close, we’ve these few quick quips.
This past Tuesday we awoke to read that Kazuo Ueda and his mates at Nippon Ginkō — for the first time in 17 years — put positive the bank’s overnight lending rate in raising it from -0.1% to a sought range of 0.0% to 0.1%. Still, it all seems rather wee, but as goes the saying: “Saké to me, Saké to me, Saké to me…”
This past Thursday with Swiss precision at 09:00 CET, Tommy Jordan and his lads at Schweizerische Nationalbank cut — without scheduled notice — both their key lending and deposit rates to 1.50%. This in turn elicited the Swiss Franc’s largest single session high-to-low drop (-1.69%) versus the Dollar in better than a year. Or how would Emmental Robin put: “Holy cheese, Batman!”
And from the “You Can’t Make This BS Up Dept.”, hardly complete would be the week without having learned from “ABC News!” that according to The World Happiness Report, the Good Old USA no longer ranks amongst the Top 20 Happiest Countries. Aw shucks. But when your nation averages some 45 murders per day (per the Kaman Law Firm), ’tis hard to be happy. Indeed, that’s America, babe: “Death and Taxes!”
Rather, seek that which is more life-and-monetary sustaining:
And Gold in any denomination is still Gold!
Cheers!
…m…
www.TheGoldUpdate.com
www.deMeadville.com
and now on “X”: @deMeadvillePro
********

Mark Mead Baillie has had an extensive business career beginning in banking and financial services for two years with Banque Nationale de Paris to corporate research for three years at Barclays Bank and then for six years as an analyst and corporate lender with Société Générale.
For the last 22 years he has expanded his financial expertise by creating his own financial services company, de Meadville International, which comprehensively follows his BEGOS complex of markets (Bond/Euro/Gold/Oil/S&P) and the trading of the futures therein. He is recognized within the financial community of demonstrating creative technical skills that surpass industry standards toward making highly informed market assessments and his work is featured in Merrill Lynch Wealth Management client presentations. He has adapted such skills into becoming the popular author each week of the prolific “The Gold Update” and is known in the financial website community as “mmb” and “deMeadville”.
Mr. Baillie holds a BS in Business from the University of Southern California and an MBA in Finance from Golden Gate University.


