Gold’s Reaction to Moody’s Downgrade


So, Moody’s downgraded U.S. sovereign credit rating from AAA to AA1, which means that the U.S. debt is no longer top-rated. This was the last of the major agencies to cut this rating. What does it change?
Downgrade’s Real Impact
Pretty much nothing from the fundamental point of view, as the U.S. is still the world leader in many categories including GDP, and it has the world’s most powerful army. A change in the opinion of one of the credit agencies of the nation’s debt doesn’t change any of that.
The ratings of agencies seem to have bigger meaning in case of less-known economies, as they help investors to assess the risk premium associated with doing business in or investing in a given country or country’s stock market.
The U.S. is not a less-known economy. I doubt that anyone will pull their funds out of the U.S. based on the downgrade (maybe except some automated systems).
In case of U.S., this downgrade is likely to have a very brief impact, a given where the USD Index already moved, the price moves based on this could already be over.
The two key markets that are affected by the above are the U.S. dollar and the U.S. stock market.
They both have impact on other markets, so what the above does to those two markets is likely important. So, let’s take a look at the charts.
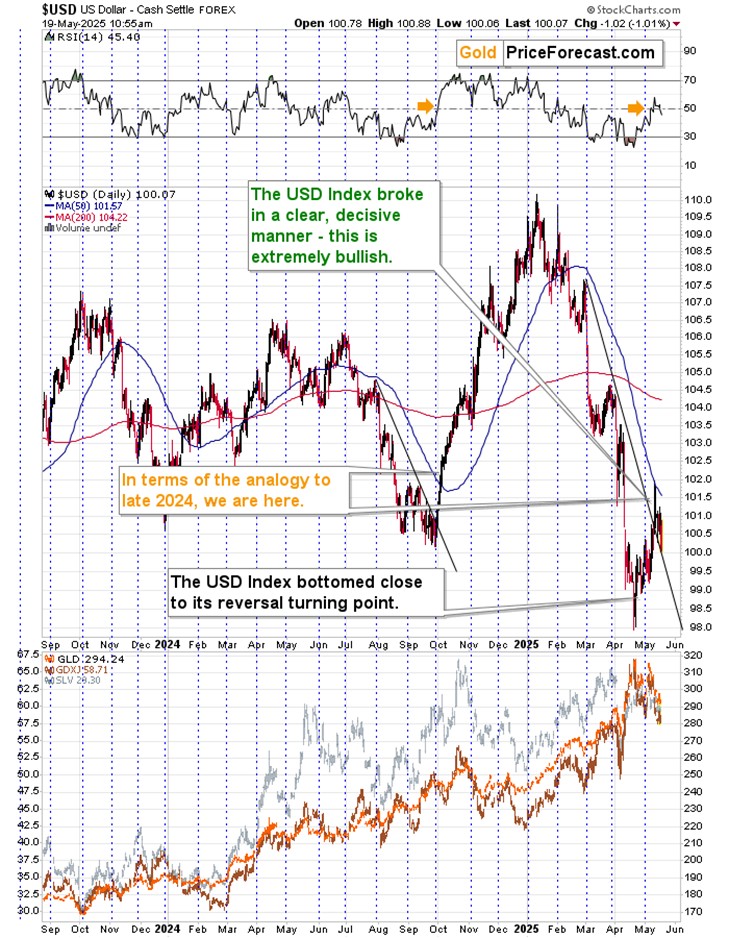
The USD Index moved lower, and it stopped at its previously broken, declining support line and at the psychologically-important 100 level. This is a strong combination of support levels and this is what makes me think that the decline is already over.
After all, the USD is most likely after a major medium-term bottom.
The other affected market are stocks. So far, the S&P 500 Index futures moved lower by about 1%.
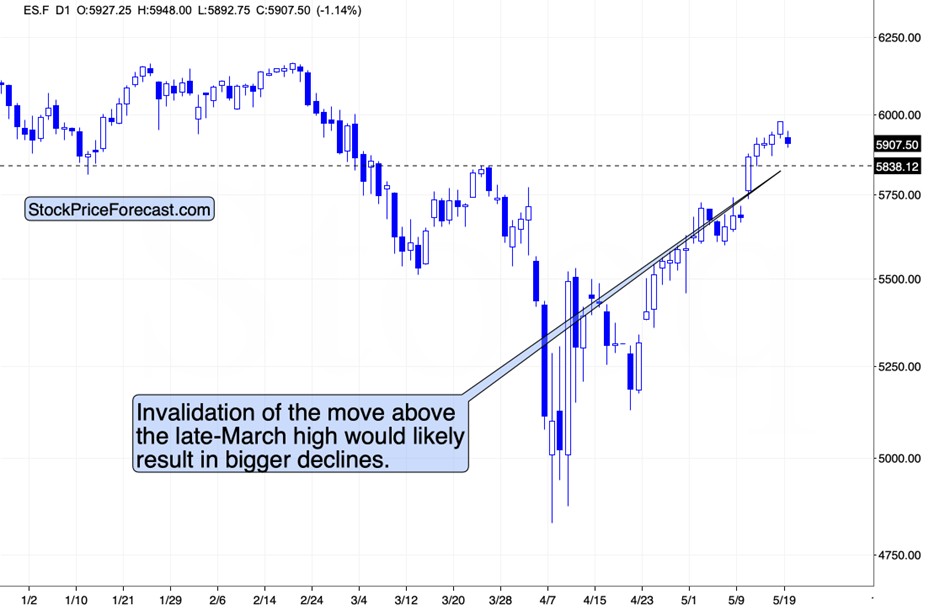
That’s not much, but it could be the first crack in the dam. Once stocks invalidate their move above their late-March high, they’re likely to decline much lower – likely taking many other markets with them.
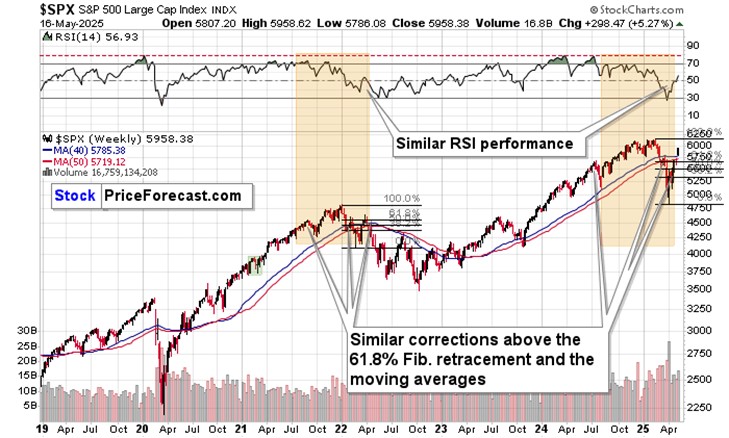
The way stocks are performing is still similar to what they were doing at their 2021/2022 top. They moved a bit above their 61.8% retracement as well as the moving averages, and RSI moved above 50.
Most importantly, though, those are not isolated factors – this comes on top of all the indications that I discussed on Friday.
Speaking of gold, stocks, and mining stocks, I’d like to take this opportunity to show you something that’s been hidden in plain sight – and that’s visible on the chart featuring the ratio between the price of gold and the value of the S&P 500 Index.
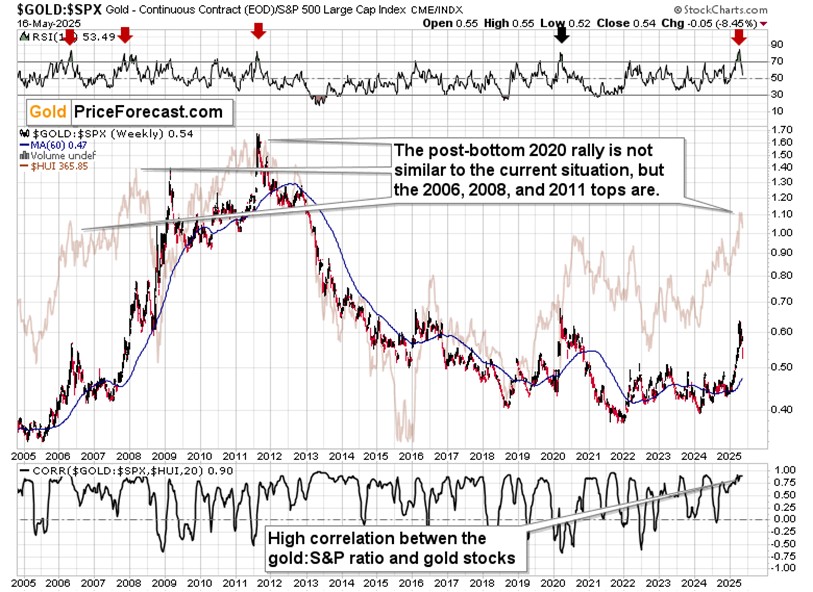
The thing is that the ratio soared this year, but other than that, it’s been rather stable since 2018.
Translation: except for this year, gold was moving higher just like U.S. stocks – not thing more.
Given how profound gold’s rally seems on its own, the above might seem like a bucket of cold water. Yes, gold moved higher, but it didn’t outperform stocks despite this year’s gains. And those gains are now being erased.
What’s even more interesting, is that those short-term upswings in the gold:S&P ratio usually (in all three cases from the previous years except for the 2020 year, which is comparable to any other year) meant major tops – also for gold stocks which you can see in the background of the chart.
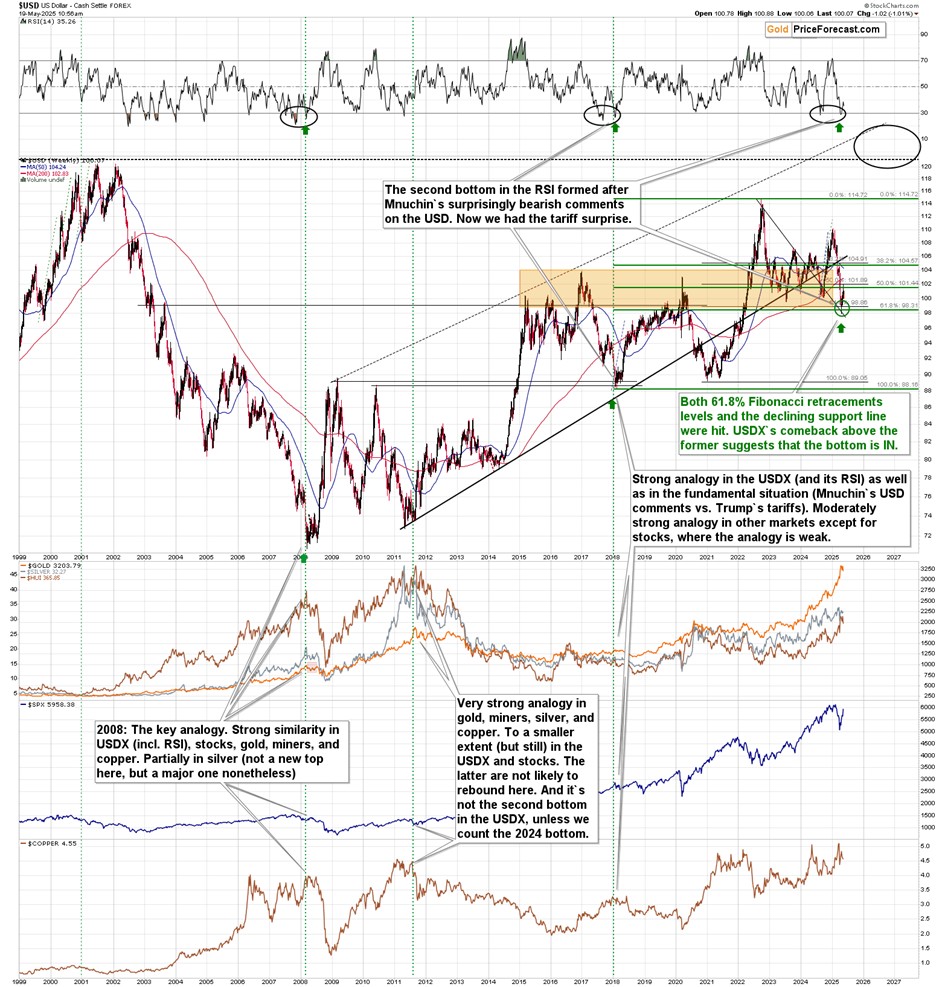
The RSI indicator does a good job of showing when the rallies were excessive – those are the times when it moved well above 70. That happened at the 2006 top, 2008 top and the 2011 top.
As you know, we already have plenty of analogies between 2008, 2011, and today, and the above strengthens them even further.
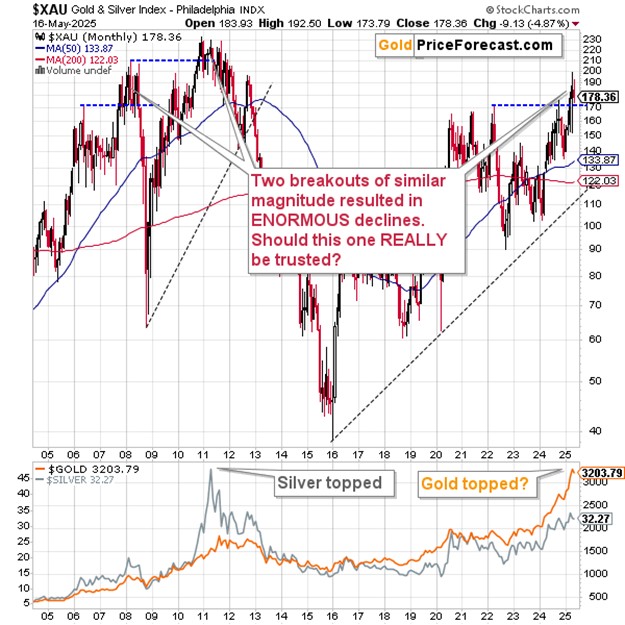
Once the XAU Index (proxy for gold stocks and silver stocks) declines back below its 2022 high, we’ll have a confirmation right from the miners that the next big slide is already underway.
Yes, it’s likely based on other factors, but seeing another confirmation will further reinforce this outlook.
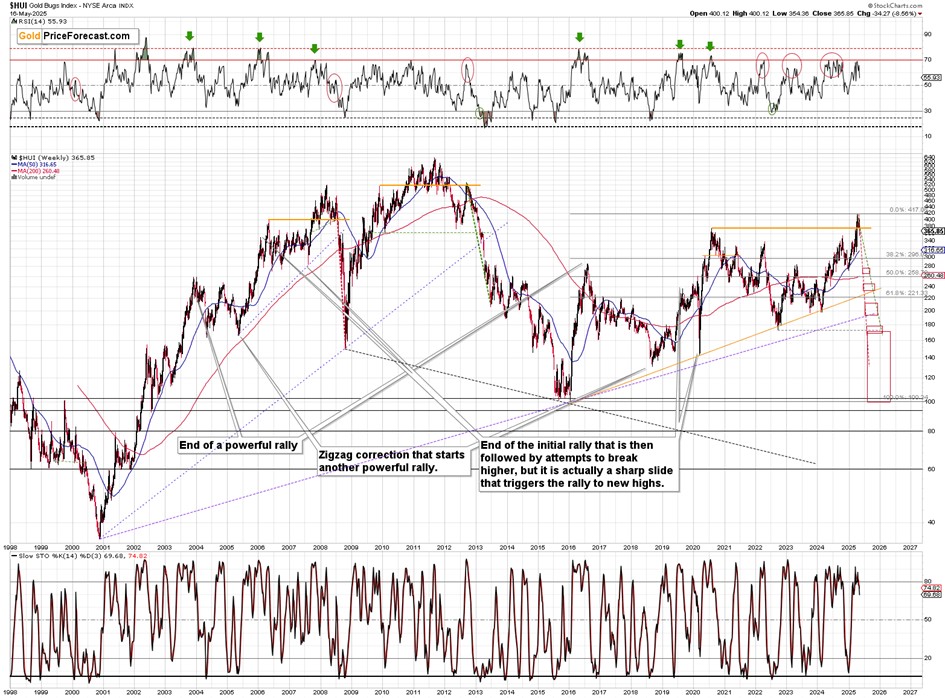
In case of a different proxy for gold stocks – the HUI Index – we already saw an invalidation of the move above the 2020 high, which serves as the canary in the coal (gold?) mine.
A Distraction from Bigger Trends
Summing up, while Moody’s downgrade caught investors’ attention, it seems to be just a blip on the radar screen, and the moves that it triggered are likely to be invalidated soon – at least those in the USD Index and in gold. Much more important indications come from the long-term charts, such as the one featuring the gold to S&P 500 ratio. And those indications point to lower precious metals prices in the following weeks.
Thank you for reading my today’s analysis.
While I save my most detailed projections (like the near-term target for the GDXJ) and specific trading ideas and opinions for subscribers, I remain committed to providing valuable insights in these free analyses as well. It's readers like you who make this work meaningful. Whether you're a long-time follower or just discovering my analysis today, I'm genuinely grateful for your attention and interest in these market developments.
Before wrapping it up, I’d like to take this opportunity to invite you to a webinar where Keith Weiner will tell you how you can turn 100 oz of gold into 121 oz (so gain extra 21%) on top of whatever gold gains. Plus, he’ll discuss his gold outlook for this year and many other gold-related matters. It’s next Thursday at 2 PM EST. Reserve your seat today.
********
 Przemyslaw Radomski, CFA, is the founder, owner and the main editor of SunshineProfits.com. You can reach Przemyslaw at: http://www.sunshineprofits.com/help/contact-us/.
More from Gold-Eagle


