Gold – A Few More Weeks Of Patience


The precious metals sector has been in a pullback for the last three months. Even though prices have not marked new lows in the last eight weeks, the trend-less sideways consolidation has certainly created a lot of stress, pain and question marks especially amongst the many new and unexperienced investors in the sector. After all, gold should have exploded thanks to money printing and the uncertain US election. However, if you follow us at Midas Touch Consulting for a while you are well aware that we have been very vocally warning of a correction in gold in early august. So far, this has played out textbook style and our call for patience was spot on. Gold – A few more weeks of patience.
Review
Since the new all-time high, which the spot gold price reached on August 7th at US$ 2,075, the precious metals sector is in a healthy and expected correction. After an initial sharp sell-off down to US$1,863 and a strong bounce up to US$2,015, a narrowing and sideways running consolidation between US$1,900 and 1,980 followed from mid-August to mid-September. This development apparently lulled many inexperienced gold investors into a sense of security, although the gold price was unable to send out sustained bullish signals at any time after mid-August.
With the slide below US$1,930 on September 21, gold rather confirmed the correction and sold off directly down to US$1,850 in just a few trading days. However, with a double bottom around US$1,850, the bulls came back again. Only with great effort and another pullback down to US$1,860, they were finally able to successfully drive gold prices back up to US$1,965 for a total of six weeks.
Since three-month gold is trading sideways between US$1,850 and US$1,960
However, all bullish advances ended abruptly here on Monday, November 9th, as the spot gold price was brutally pushed down by US$110 to US$1,850 in just five trading hours. The news of a corona vaccine was used as an explanation and reason for this waterfall slide. However, after the strong rally from US$1,860 to US$1,965 within just 12 days, the technical situation was clearly overbought, and gold had reached an important technical resistance level around US$1,962.
Nevertheless, the crash on the gold market certainly raises some question marks. Within only five hours, almost 260,000 contracts were traded on the futures market. This is roughly two and a half times the annual production of the two largest gold producers, Barrick Gold and Newmont Gold combined. In case of doubt, the professional paper jugglers helped out here on Monday and thus set-in motion the cascade effect of stop losses and margin calls.
In the meantime, gold prices have recovered to US$1,895 and closed this trading week slightly below US$1,890. However, the bulls are not yet back on their feet as the support zone between US$1,850 and US$1,860 will probably not withstand another test.
Technical Analysis: Gold in US-Dollar
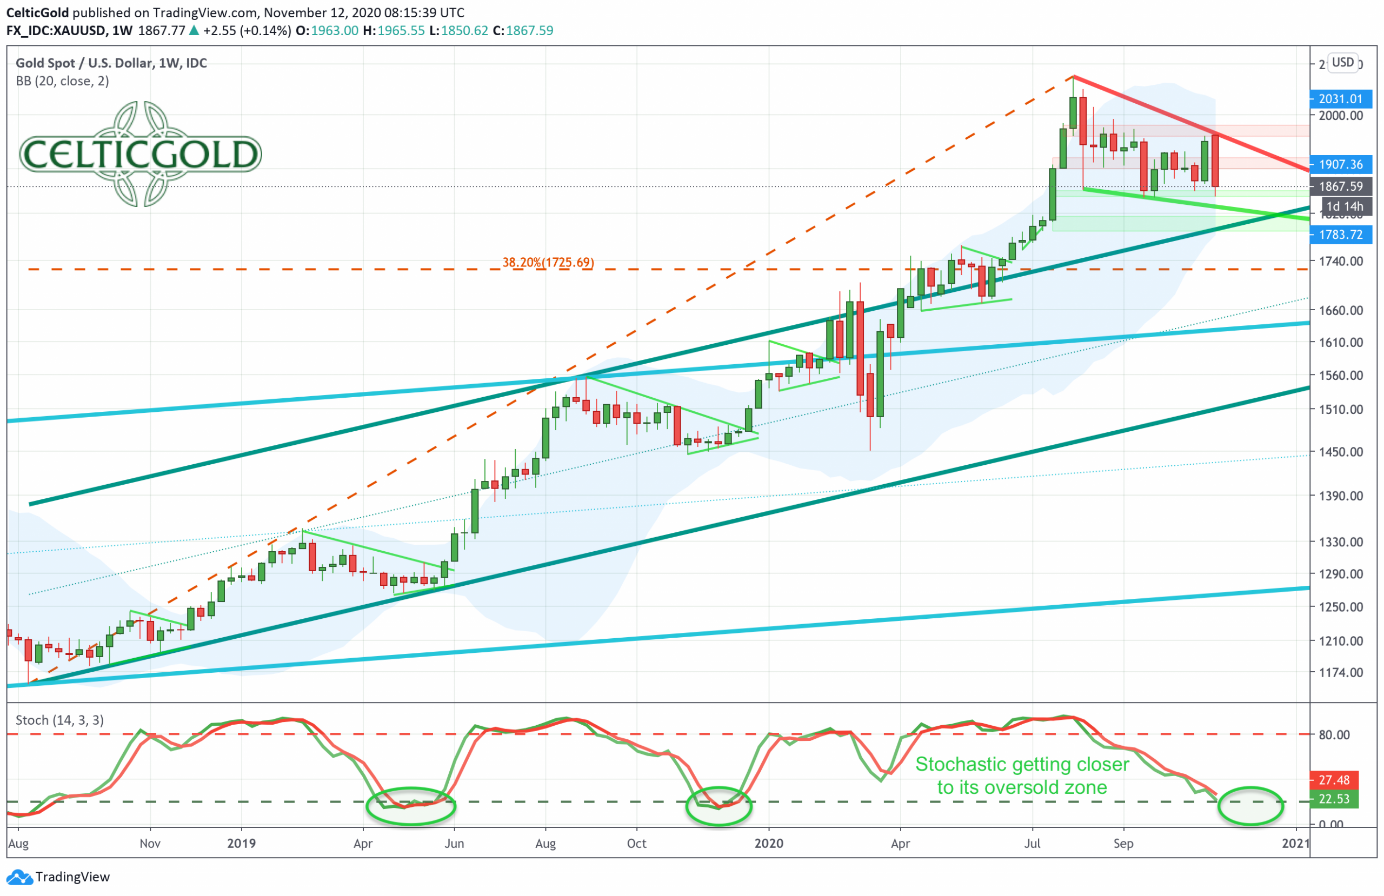
Gold in US-Dollars, weekly chart as of November 12th, 2020. Source: Tradingview
In the large picture, the correction which has been running for three months, fits well into the pattern of relatively mild but tenacious corrections. Similar to the fall 2019 and spring 2019 corrections, a stretch torture is currently taking place, which has so far been played more over time than over price. However, with the weak price performance during last week, the danger of a further slide in prices has intensified.
The logical price target of the ongoing correction would be the upper edge of the dark green upward-trend channel in the range around US$1,800. This upward-trend channel is in place since the fall of 2018 and has dominated the gold market for more than a year and a half. It was not until June that the bulls managed to make a sustained breakout in the course of the final exaggeration and the subsequent rally towards US$2,075. Now gold prices are slowly but surely coming back and could test the upper edge of this trend channel for support.
On the weekly chart, however, the Stochastic Oscillator is showing that it is about to reach its oversold zone. Thus, not only a bottom as well as the trend reversal to the upside is foreseeable in the coming three to six weeks. Rather, the weekly chart finally starts to offer a solid foundation for a rally lasting several weeks or more.
Overall, the weekly chart is still bearish. However, a reversal of the trend is foreseeable and should take place until around mid-December. Either the bulls can save themselves over this time by continuing their sideways movement and thus avoid new lows. Alternatively, the bears can push the gold price one floor lower towards US$1,800 after all. This would finally offer a really good buying opportunity again.
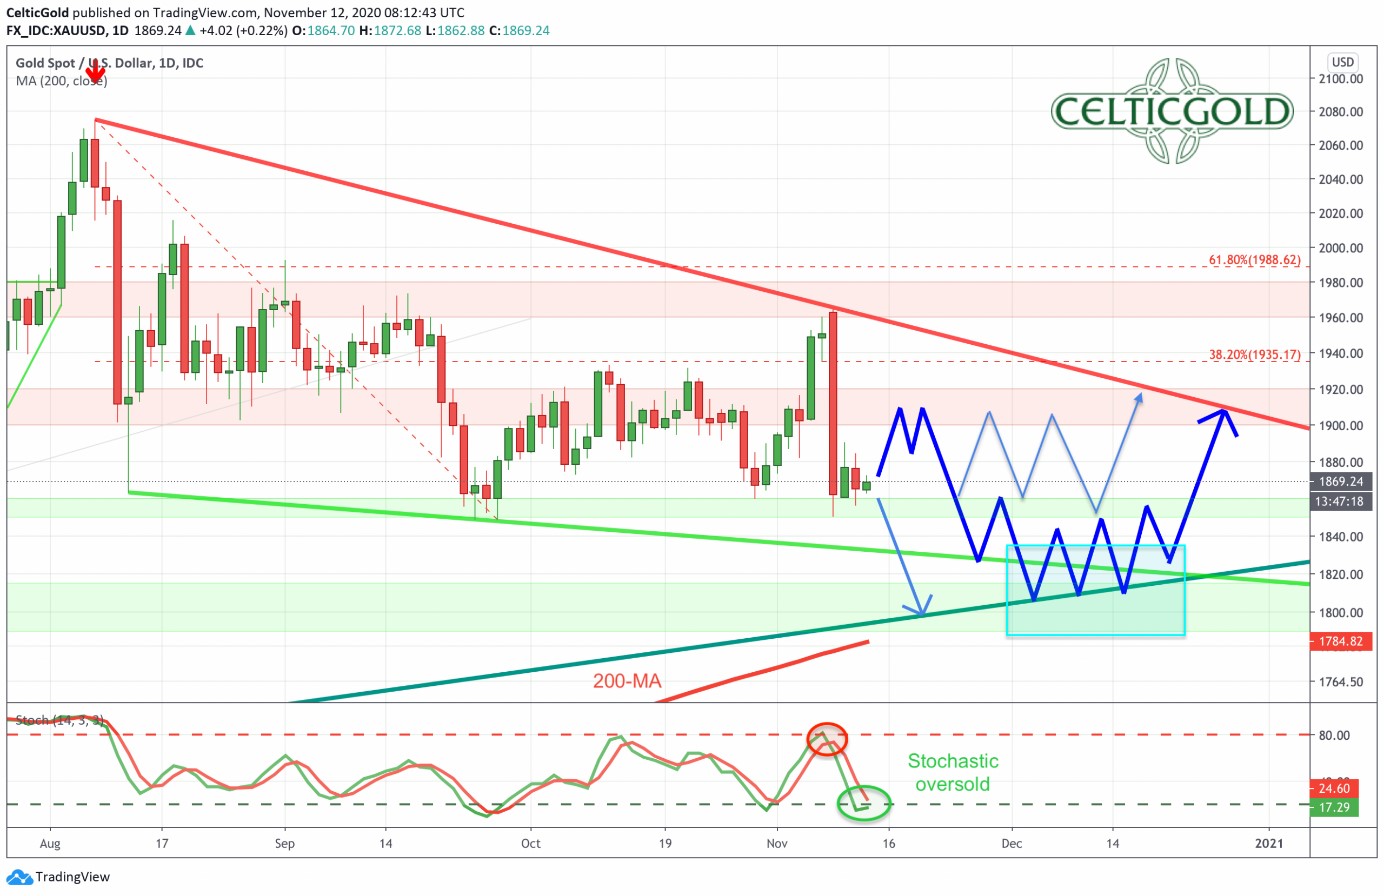
Gold in US-Dollars, daily chart as of November 12th, 2020. Source: Tradingview
After the fiasco at the beginning of this week, the daily chart is over-sold once again. At the same time, the bulls are obviously trying to get another recovery going. As a result, gold has been trading dangerously close to the crucial support zone between US$1,850 and 1,860. Three times in the last three months, the bulls were able to fend off the attacks of the bears in this zone and in each case force a clear countermovement. Whether this will also succeed a fourth time is questionable. In fact, the oversold daily chart should at least lead to a recovery towards around the US$1,910 level. However, the longer it does not come to that, the more the danger of a breakthrough to the downside increases.
On the lower side, prices in the US$1,800 range would be expected in this case. At the same time, the 200-day moving average (US$1,784) continues to rise daily and should exceeded the round US$1,800 level in about two weeks. Together with the upper edge of the old bullish trend channel, the 200-day moving average, and the oversold stochastic on the weekly chart, we can expect to see a ultra-strong support around US$1,800. Add to this the fact that the US$1,800 mark has been massive resistance in 2012 and 2013 it should now act as a massive support in the very big picture.
In summary, the gold price is still threatened by a possible final sell-off towards US$1,800. In the short term. However, the chances are not bad that the bulls will succeed in making one last detour to recover, and thus prices above US$1,900 are likely in the near-term. Subsequently or immediately, the final slide in the price towards US$1,800 however is still likely.
But prices around US$1,800 would then provide a very good entry opportunity. Note that intraday dips below US$1,800 are quite possible. On a daily and especially weekly closing price basis, however, the US$1,800 should hold and act as a massive support.
Commitments of Traders
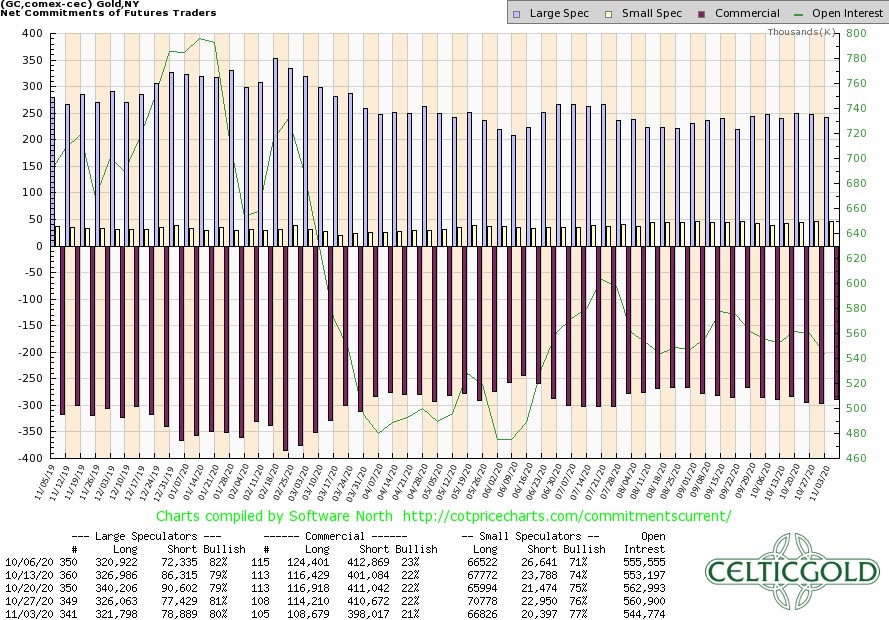
Commitments of Traders for Gold as of November 3rd, 2020. Source: CoT Price Charts
In the week before the US elections, the number of open contracts (= open interest) in the gold futures market fell by almost 16,000 contracts. Otherwise, little has changed in the constellation of the last few months, as commercial traders continue to hold an extremely high short position. This currently amounts to a cumulative 289,338 short contracts.
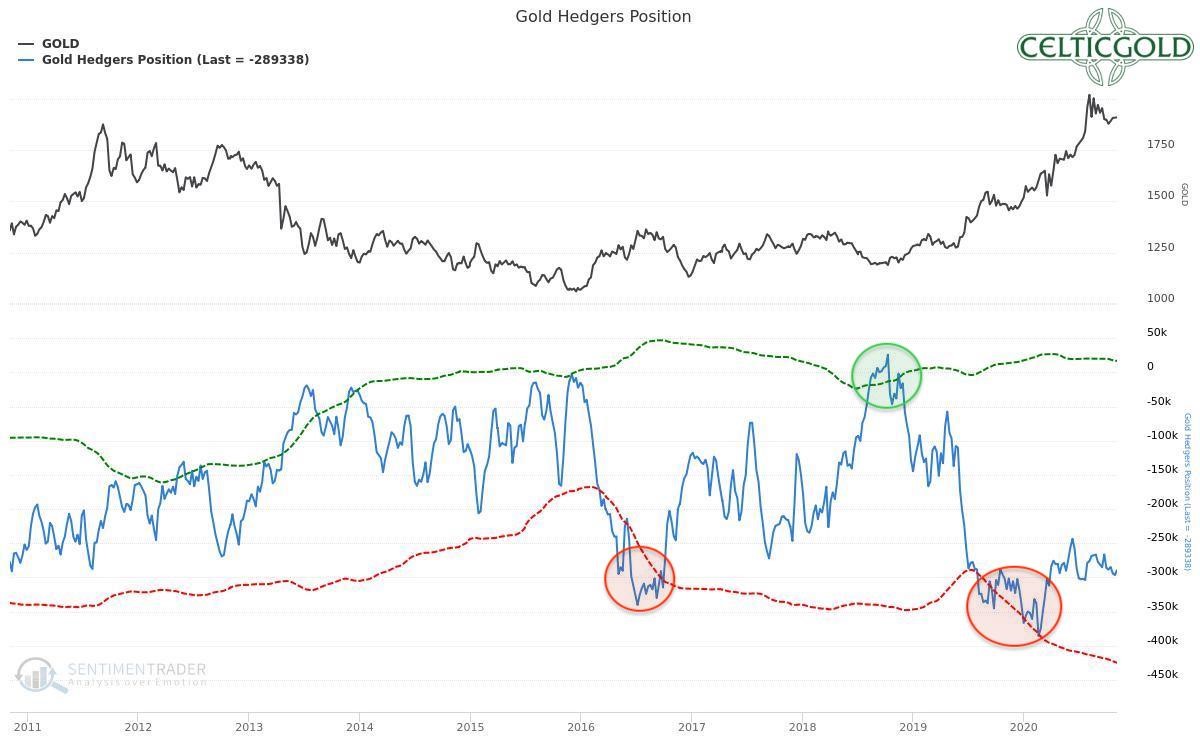
Commitments of Traders for Gold as of November 3rd, 2020. Source: Sentimentrader
Overall and only in isolation, the CoT report continues to provide a clear sell signal, as it has for over a year already, thus signaling a continued need for a major correction. But of course, it must be also noted that the paper gold market has likely lost control over price.
Sentiment: Gold – A few more weeks of patience
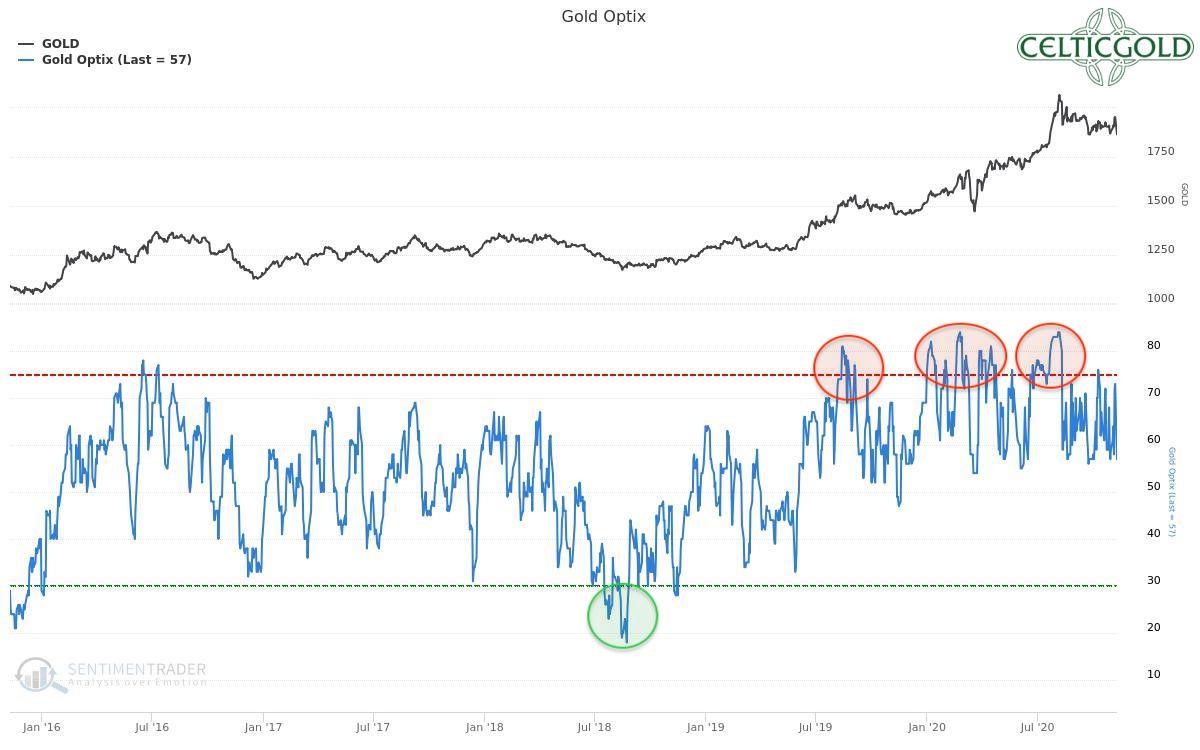
Sentiment Optix for Gold as of November 10th, 2020. Source: Sentimentrader
Following the great euphoria this summer, the mood in the gold market has gradually calmed or neutralized somewhat over the past three months. At the same time there is still no sign of a surrender or panic. This however would be important and probably necessary for a sustainable bottom and turnaround.
In this respect, the sentiment analysis also continues to urge patience. Should the gold price pullback one floor lower towards US$1,800 or lower, fear and panic should return to the gold market. However, in this case the turnaround and the beginning of a new uptrend are likely close.
Seasonality: Gold – A few more weeks of patience
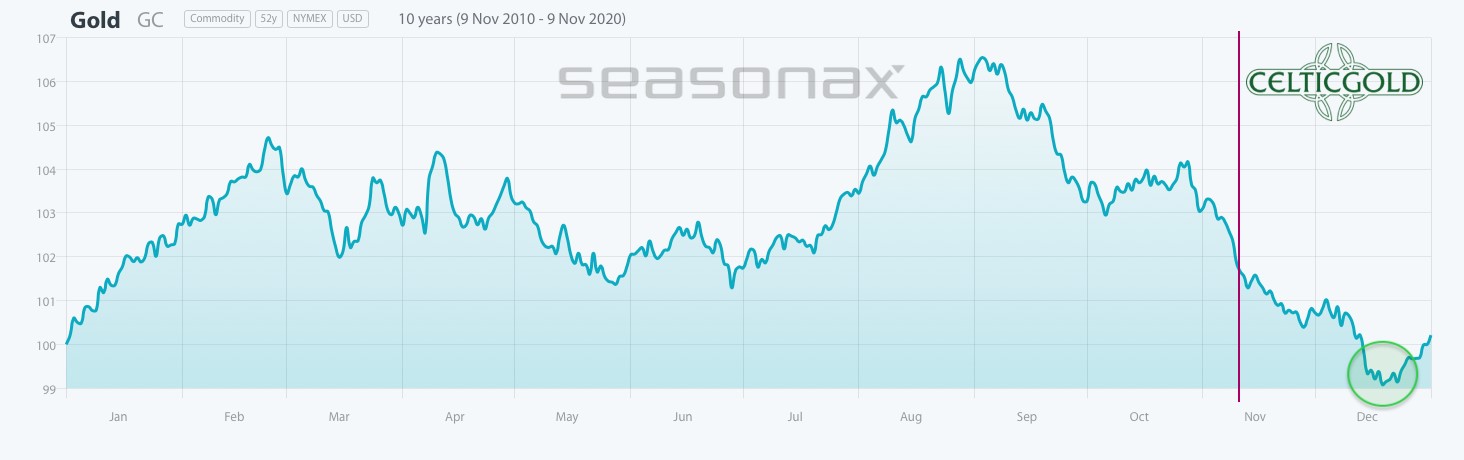
Seasonality for Gold in US Election Years as of November 9th, 2020. Source: Seasonax
So far, the gold price has followed the statistical pattern of the last 10 years fairly closely during this year. Accordingly, the downward phase that has been underway since August should not reach its final low until mid-December. As well the typical trend reversal should provide for a strong 1st quarter 2021.
All in all, seasonality also continues to call for patience. Statistically speaking, the correction should be over in about five weeks.
Bitcoin/Gold Ratio
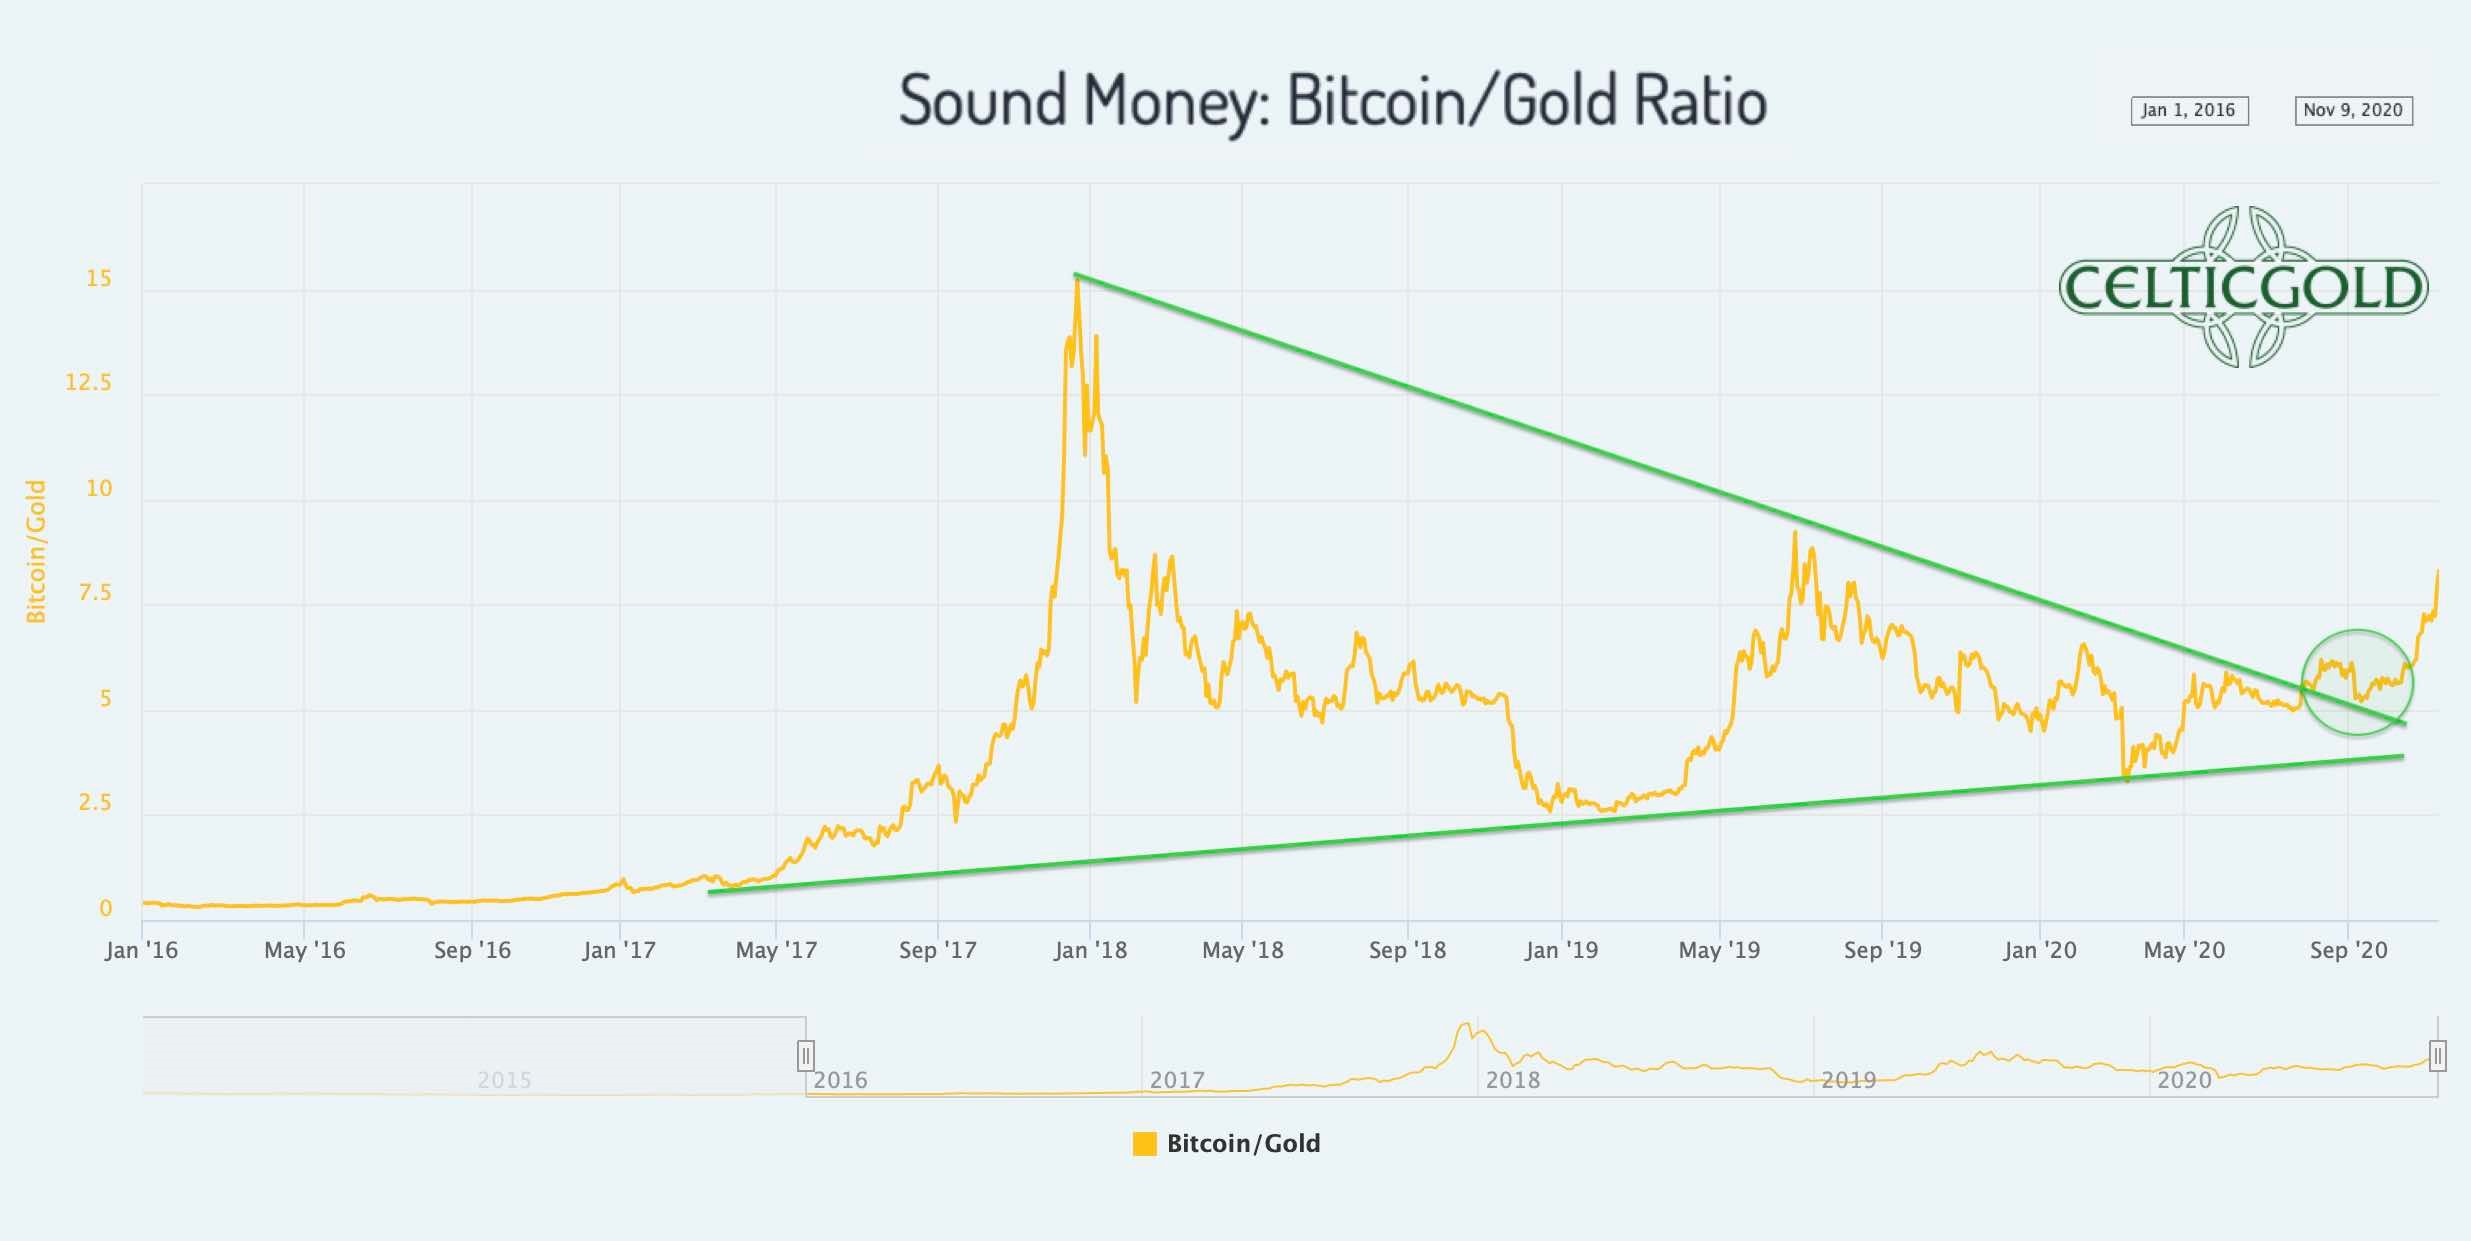
Sound Money Bitcoin/Gold-Ratio as of November 9th, 2020. Source: Chaia
At prices of US$15,977 for one Bitcoin and US$1,889 for one troy ounce of gold, the Bitcoin/Gold ratio is currently at 8.45. This means that you now must pay more than 8 ounces of gold for one Bitcoin. In other words, a troy ounce of gold currently costs only 0.118 Bitcoin, which is a decrease of over 30% in the last six weeks!
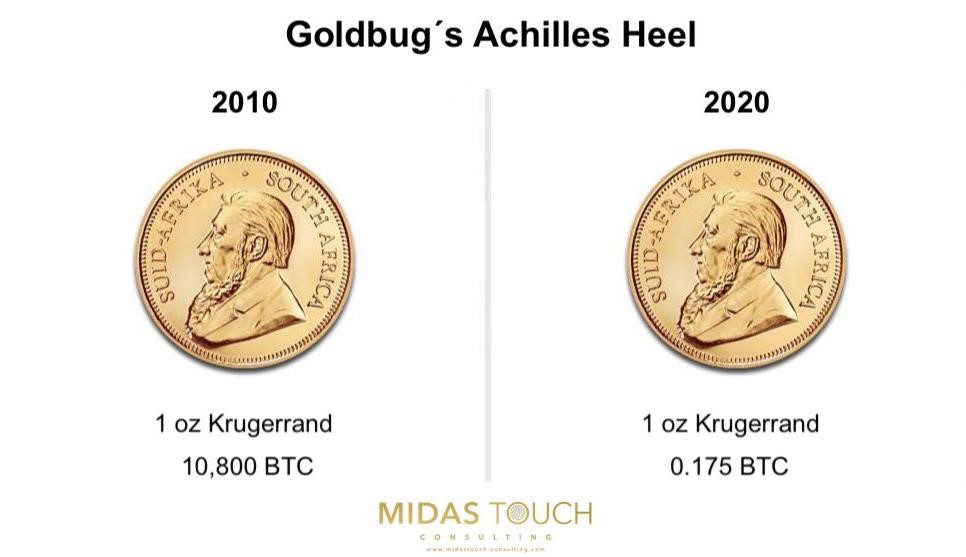
Goldbug´s Achilles Heel as of October 15th, 2020. Source: Midas Touch Consulting, © Florian Grummes 2020
As in the last few months again and again in time announced, Bitcoin should and likely will substantially outperform gold. The two-and-a-half-year correction in the Bitcoin/Gold ratio ended this summer in favor of Bitcoin. Since then, Bitcoin has clearly outperformed gold and the Bitcoin/Gold ratio should be on its way towards 1:10. Given the outperformance of the last ten years, a gold investor can no longer afford to ignore Bitcoin.
Generally, buying and selling Bitcoin against gold only makes sense to the extent that one balances the allocation in the two asset classes! At least 10% but better 25% of one’s total assets should be invested in precious metals (preferably physically), while in cryptos and especially in Bitcoin, one should hold at least 1% but not. more than 5%. Paul Tudor Jones holds a little less than 2% of his assets in Bitcoin. If you are very familiar with cryptocurrencies and Bitcoin, you can certainly allocate higher percentages to Bitcoin and maybe other Altcoins on an individual basis. For the average investor, who usually is primarily invested in equities and real estate, 5% in the highly speculative and highly volatile bitcoin is already a lot!
“Opposites compliment. In our dualistic world of Yin and Yang, body and mind, up and down, warm and cold, we are bound by the necessary attraction of opposites. In this sense you can view gold and bitcoin as such a pair of strength. With the physical component of gold and the digital aspect of bitcoin (BTC-USD) you have a complimentary unit of a true safe haven in the 21st century. You want to own both!”– Florian Grummes
Macro Update and Conclusion: Gold – A few more weeks of patience
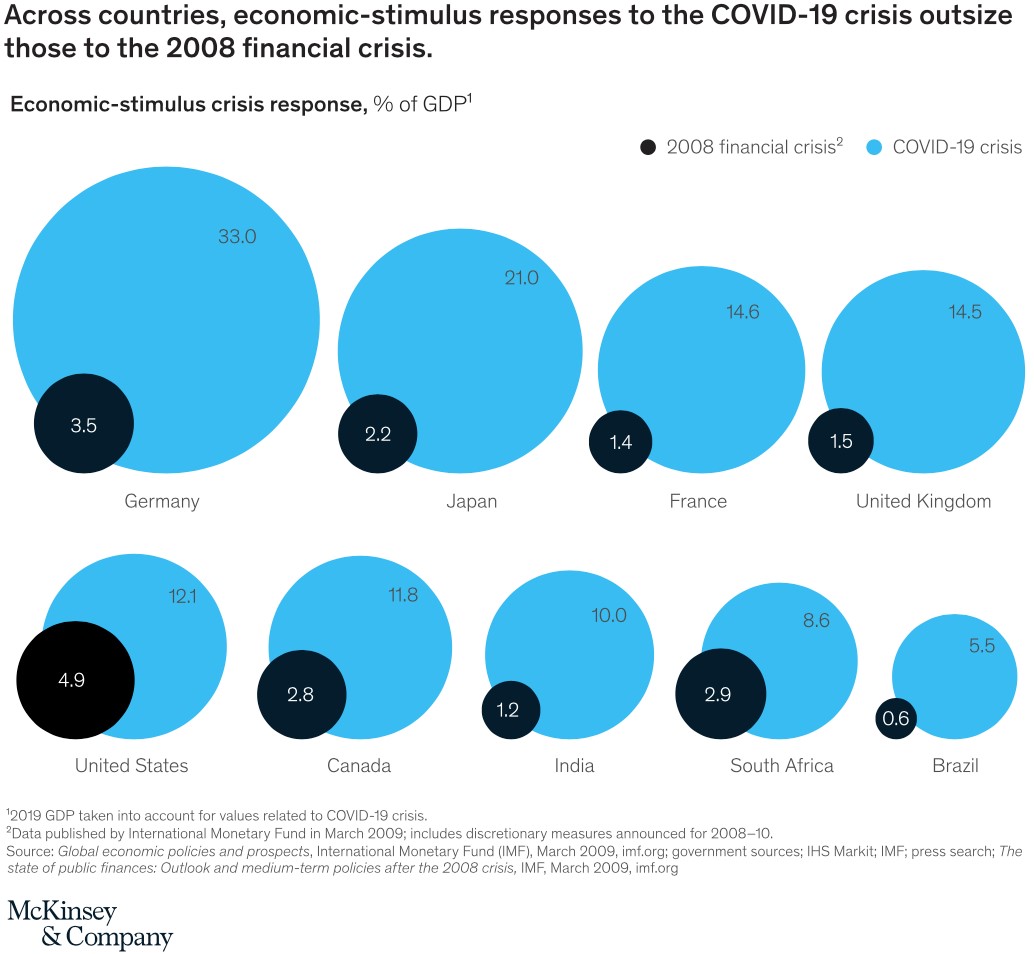
Economic Stimulus 2020 outsize the 2008 financial crisis 101120, Source McKinsey & Company 2020
In recent months, central banks and governments around the world have been creating currencies on an unprecedented scale. In comparison, the expansion of the money supply in the wake of the financial crisis in 2008 is almost tiny. Since 1971, the entire global economy has gradually become dependent on the constant expansion of the money supply. Since 2008 and the numerous rescue programs that followed, this trend has accelerated steadily. In the meantime, the financial markets are only concerned with the next injection of liquidity. Developments in the real economy, on the other hand, no longer play an important role and are deliberately concealed or glossed over.
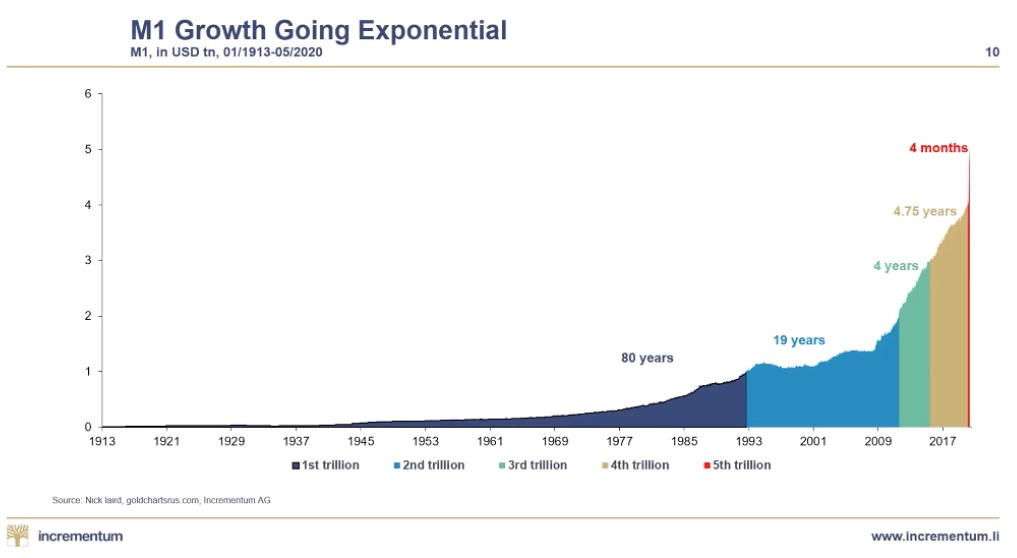
In Gold We Trust 2020, Source and © Incrementum
Thus, since the founding of the FED in 1913, it initially took 80 years for the M1 money supply to rise to one trillion US dollars. The next doubling to two trillion US dollars took only 19 years. For the increase from two to three trillion US dollars only 4 years were necessary. The increase from three to four trillion US dollars took a little longer. The expansion to the next trillion (5 trillion US dollars), on the other hand, took only four months this year! From now on the exponential function takes over. There is no going back.
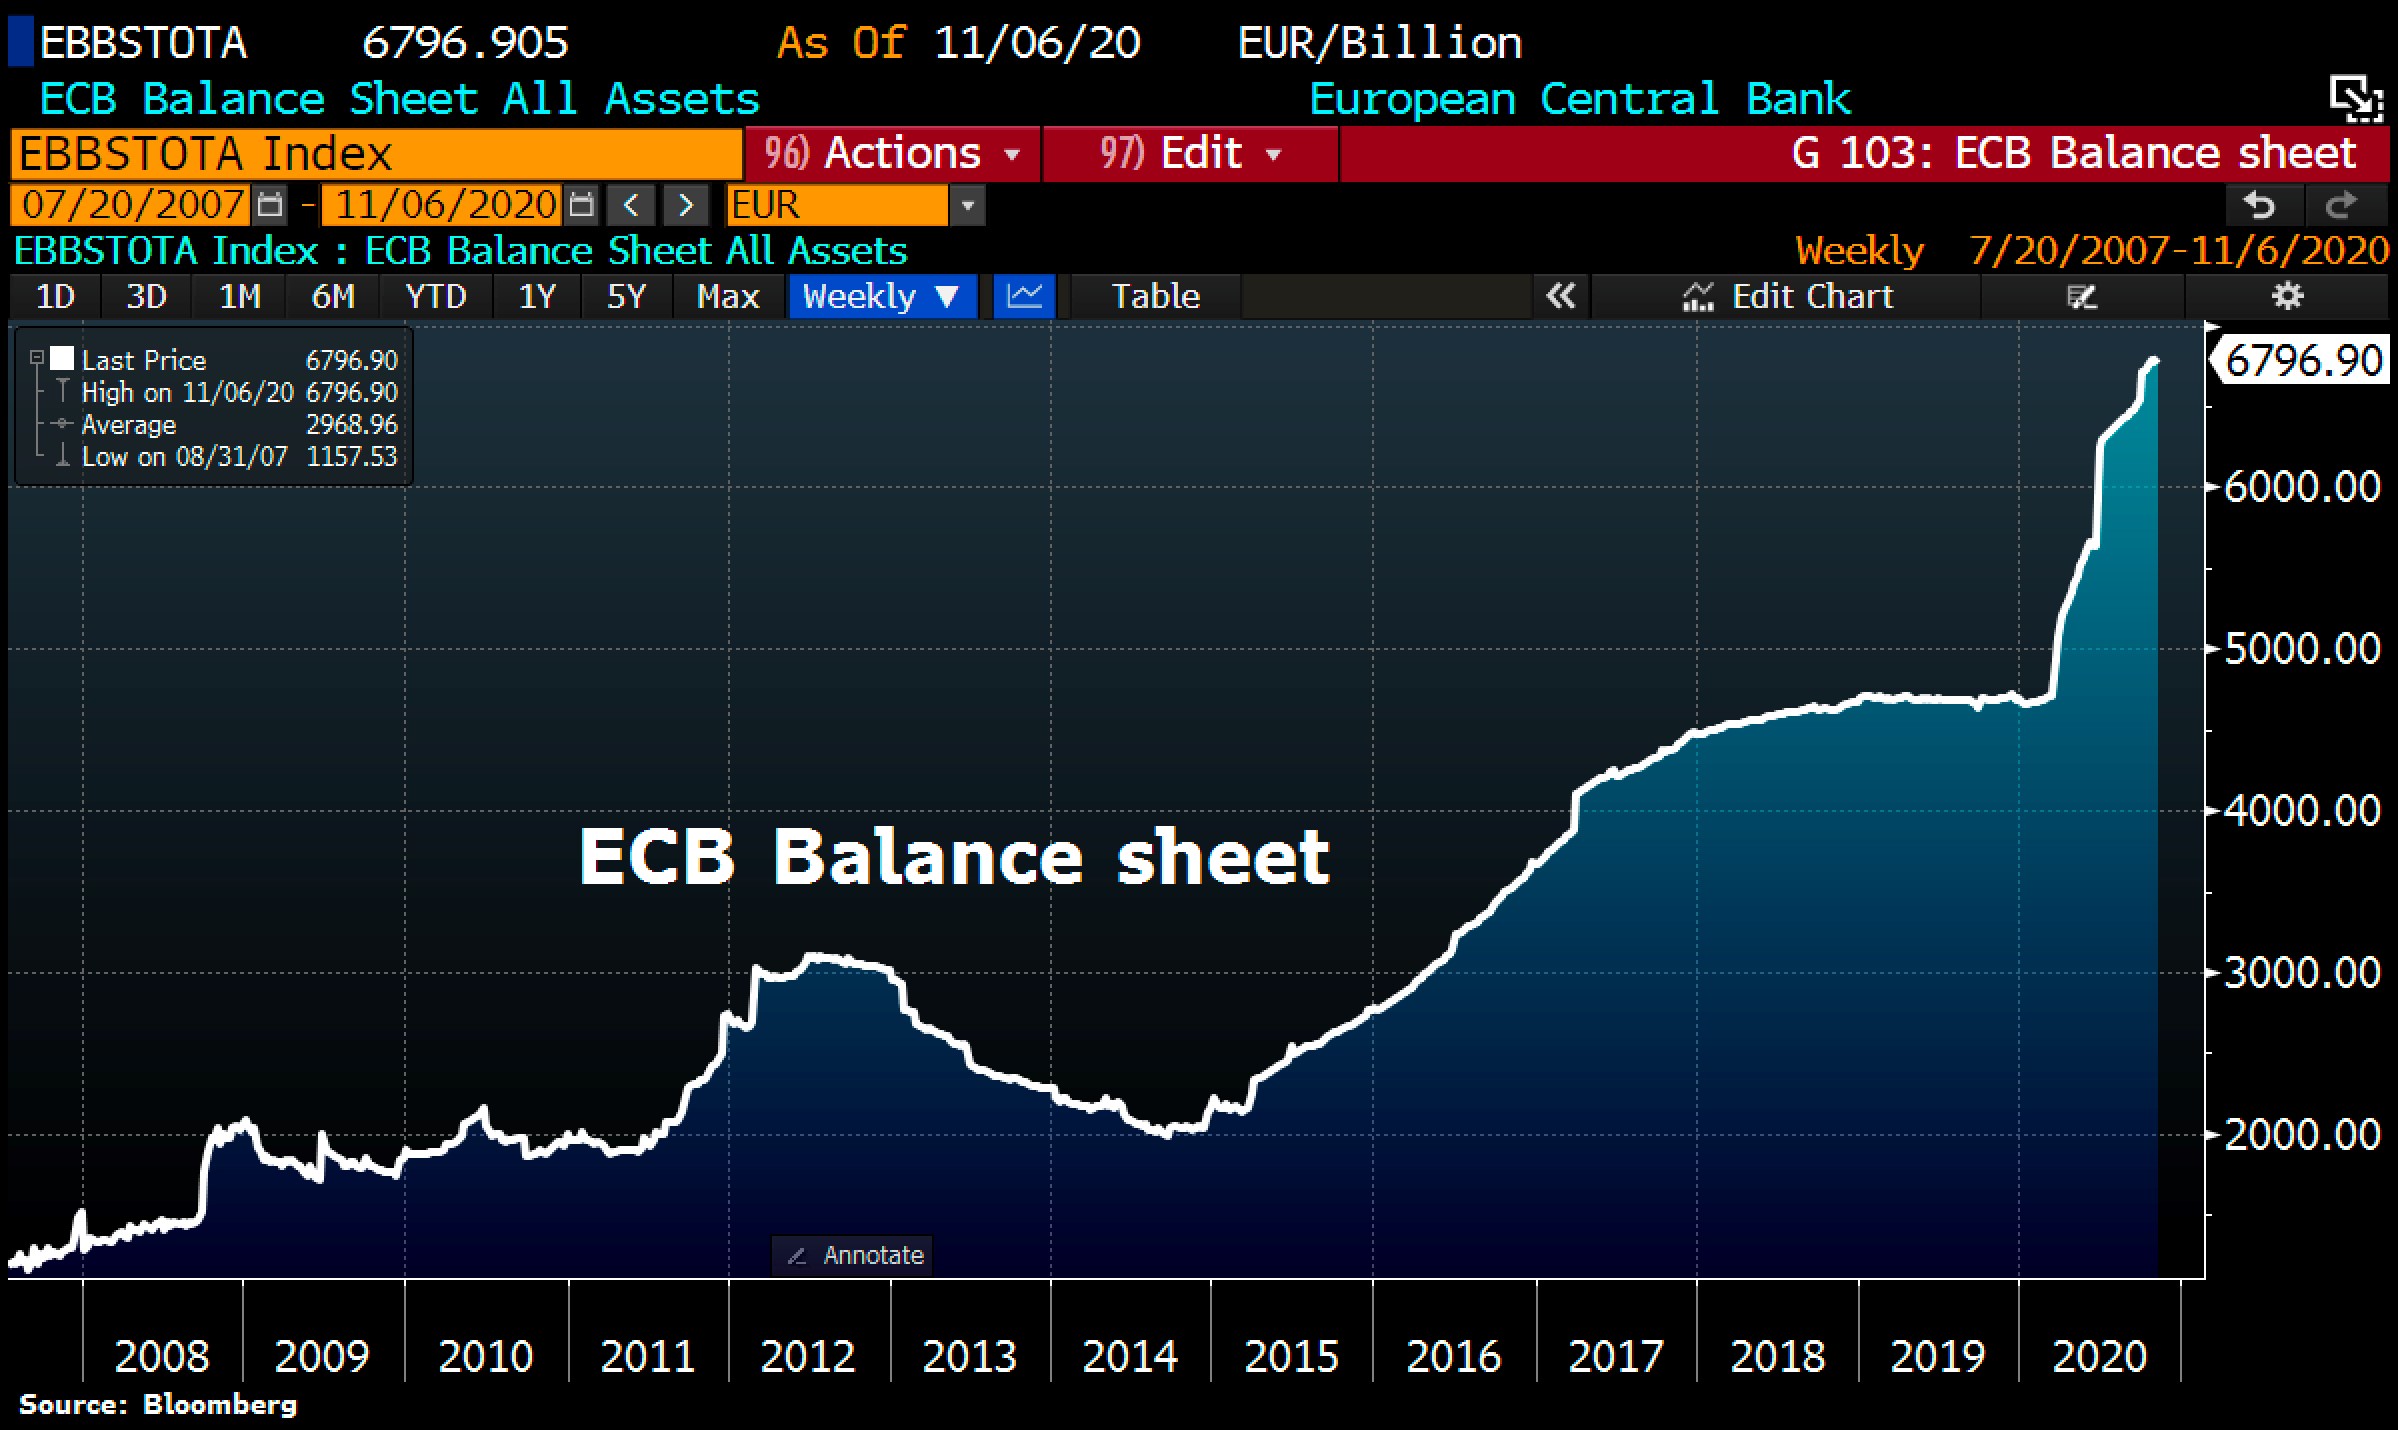
©Holger Zschaepitz, Schuldensuehner, 10th of November 2020
Of course, the ECB and Madame Lagarde are not going to let themselves get away with this and continue to press the accelerator. Most recently, the total assets of the ECB rose by a further 21.1 billion euros to 6,796.9 billion euros. This corresponds to 67.3% of the GDP of the euro zone. The ECB has recently slightly increased the rhythm of weekly currency creation to around 15 to 35 billion euros per week.
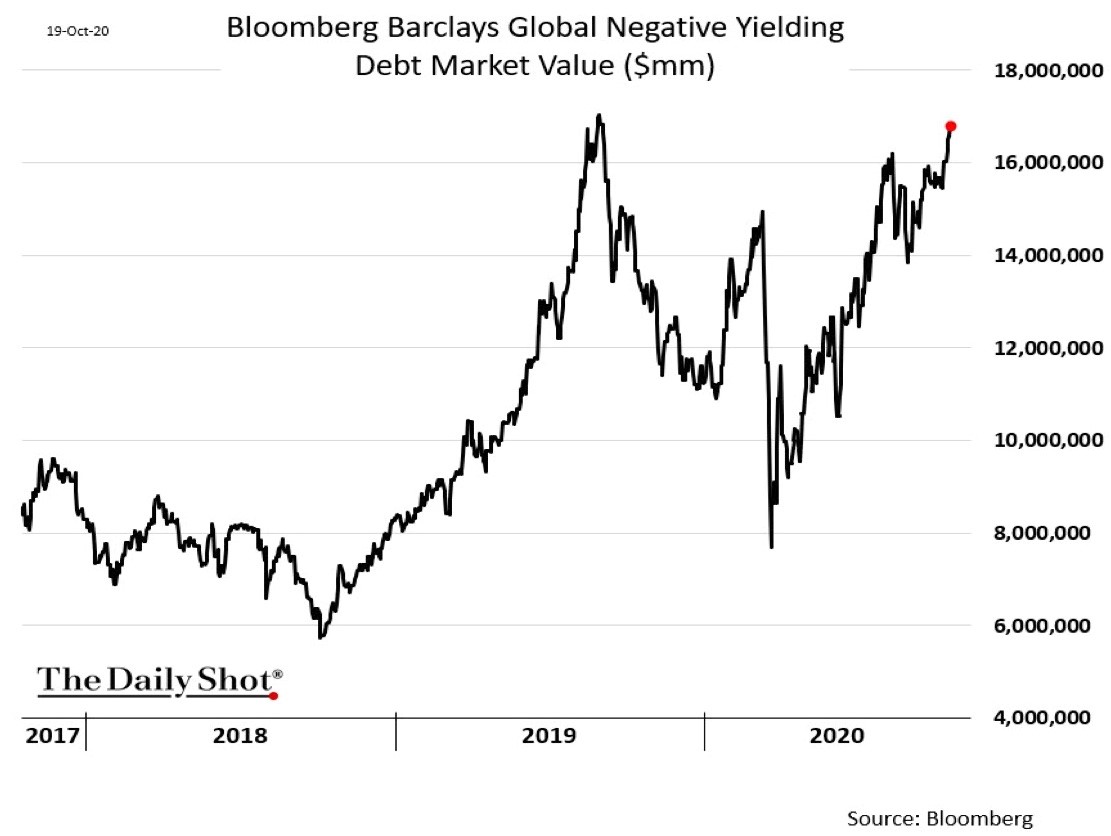
Global negative yielding debt market. Source: The Daily Shot and Bloomberg, 19 October 2020
Thanks to this global “confetti party”, bonds worth over US$ 17 trillion are now outstanding, which are yielding negative returns. After deducting the inflation rate, the real interest rate is even more negative. In contrast, the gold market comes to a total of about 12 trillion US dollars. You don’t have to be a prophet to ascribe the much better prospects to gold in this environment. After all, negative interest rates, credit rating downgrades or increases in the risk premium are unknown to gold. Gold cannot go broke. Government bonds, on the other hand, can deprive investors of their entire purchasing power thanks to currency devaluation.
Gold – A few more weeks of patience and two scenarios
Even though the gold price has been in a treacherous correction phase for three months now, the strong fundamentals have not changed at all! The current financial system, based on “paper currencies” such as the euro or the US dollar, is in the endgame. There is no escape from this game. In the end, gold will be one of the main beneficiaries, because you can’t create gold out of thin air with a mouse click. As so often in the history of mankind, the attempt of a fiat money system will fail. If the powerful elites in this world do not intervene undemocratically, the whole thing will end in hyperinflation. Otherwise, there will be a reset and a switch to digital national currencies (IMF – The Great Reset). With physical gold and silver, you are well prepared for both scenarios.
In the short term, the gold market’s only remaining question will likely be “how low can gold prices actually still fall before the trend reversal heralds the next up-wave with price targets above US$2,500”.
Within the current crack-up boom, there should actually only be relatively mild pullbacks. So far, the gold price has only corrected US$225 from its new all-time high. In view of the preceding “US$ 900 rally” over the past two years, this is an extremely strong performance. Nevertheless, a final pullback towards US$1,800 and the rising 200-day moving average would be typical and would shake off the weak hands in time for the next rally. Alternatively, the bears will bite out their teeth at the US$1,850 range in the coming weeks and thus at least cause uncertainty and prolong the correction into December.
Source: www.celticgold.eu
We post real time entries and exits for the silver market in our free Telegram channel.
If you like to get regular updates on our gold model, precious metals and cryptocurrencies you can subscribe to our free newsletter.
********
 Florian Grummes (born 1975 in Munich) has been studying and trading the Gold market since 2003. In 2008 he started publishing a bi-weekly extensive gold analysis containing technical chart analysis as well as fundamental and sentiment analysis. Parallel to his trading business he is also a very creative & successful composer, songwriter and music producer. You can reach Florian at: [email protected].


