The Gold ‘Fear Trade’ Is On


Keynote speaker Frank Holmes, CEO of U.S. Global Investors, often kicks off resource investment conferences talking about the “fear trade” and the “love trade” in gold.
Holmes is saying there are two demand drivers for gold.
The fear trade has to do with demonetization, currency destruction, and negative real interest rates (interest rates minus inflation), which are usually gold positive. A newer term would be de-dollarization, as central banks around the world dump dollars and US Treasuries for other currencies and precious metals.
The love trade is motivated for demand for gold for special occasions. It’s often associated with Asia and the Middle East, where gold is given as gifts during, for example, Ramadan, the Season of Lights in India, Chinese New Year and Christmas. Weddings too are popular occasions for gold gifting, especially in Asia.
Holmes says gold does well when the fear trade and the love trade coalesce, such as when gold hit $1,900 an ounce in the summer of 2011. At that time, the fear trade in gold, evidenced by the Eurozone debt crisis and the debt ceiling battle in America, coincided with the beginning of Ramadan, a “love trade” event.
Other factors causing gold to rise or fall include interest rates, real interest rates, inflation, the US dollar, geopolitical tensions, and economic events such as recessions, or the trade war currently being waged by US President Donald Trump.
Usually, we can explain how gold has been tracking over a period of time by comparing a gold price graph to a graph plotting, say, the US dollar index DXY, the Consumer Price Index or real interest rates.
Lately, though, we can throw traditional gold-price factors out the window because they do not correlate to gold’s incredible run over the past 18 months.
Gold’s meteoric rise
Take a look at the five-year gold chart below.
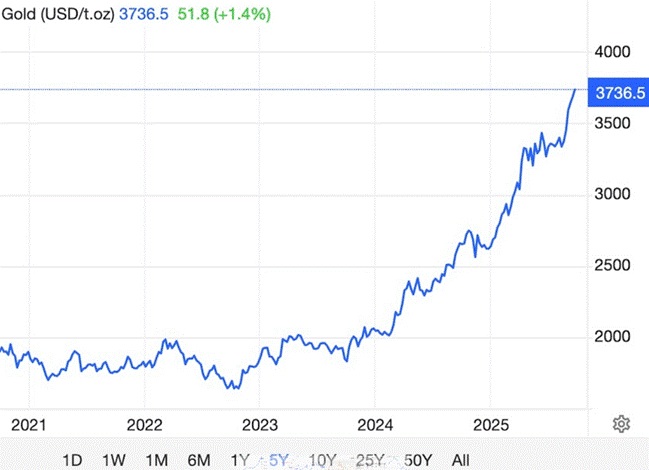
Five=year spot gold. Source: Trading Economics
After trading within a relatively narrow range — ~$1,600 to ~$2,000 — for four years, gold started a steep climb in February 2024. From Feb. 26, 2024 when gold was @ $2,044.10, the precious metal has added an astounding $1,692.40, as of this writing, to reach its current $3,736.50, a gain of 82.7%!
On Monday, Sept. 21, Comex gold futures hit a fresh record high of $3,756.60 per ounce, driven by the Federal Reserve’s recent quarter- point interest rate cut, and expectations of further policy easing as the US economy shows signs of flagging, especially the labor market.
But here’s where it gets weird. The previous trading day, US stock markets also hit a record high, with the S&P 500 closing up 0.49% on Friday Sept. 19, to 6,664.36.
Gold is supposed to act as a safe haven in times of economic or political turmoil, like when stock markets crash, yet instead, stocks and gold appear to be riding the same elevator to new heights.
Deutsche Bank says it’s because investors are both bullish and afraid. At AOTH, we tend to agree. In this article we look at why gold is rising and conclude that’s it’s all based on fear.
We prove our theory first through the use of a number of chart comparisons — gold versus other variables — then get into a discussion of the less-quantifiable fear factors.
What it isn’t
Interest rates
If we look at a chart of the federal funds rate — the rate set by the Federal Reserve — over the past decade, we notice the interest rate was very low in 2016, just 0.5%. The Fed started raising rates in December 2016 and continued with a series of “stepped” raises until the FFR was 2.5% in December 2018.
The rate held steady for about six months, then the Fed started cutting again, reaching 1.75% at the end of February 2020. Notice this was right before the covid-19 pandemic started, kicking the legs out of the global economy. The rate plunged 1.5% within two weeks as the Fed tried to rescue the economy, which had been practically shut down by the disease.
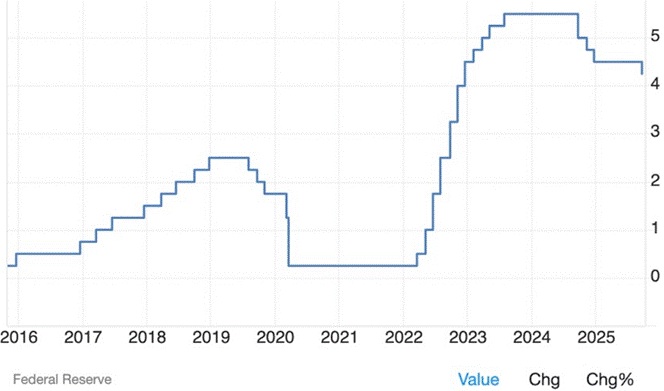
Federal funds rate over 10 years. Source: Trading Economics
As cases and deaths spiked, people started working from home, downtown offices were closed, and millions were laid off. From March 15 to Feb. 28, 2022, rates stayed at a quarter percent, the idea being that such a low rate would get consumers and businesses borrowing again and re-start the stalled US economy.
Widespread vaccine rollouts, despite many anti-vax crusaders, nipped covid-19 in the bud and hospitalizations and cases started to drop. The Fed however had another elephant in the room: inflation.
As the chart below shows, the Consumer Price Index was 1.4% in January 2021. By September 2021 it had jumped to 5.4%. The Fed went to its old playbook from the 1970s and ‘80s and started raising interest rates to quell inflation. The first raise, a quarter percentage point, came on March 16, 2022. The battle between the Fed, with its interest rate bazooka, and inflation was on.
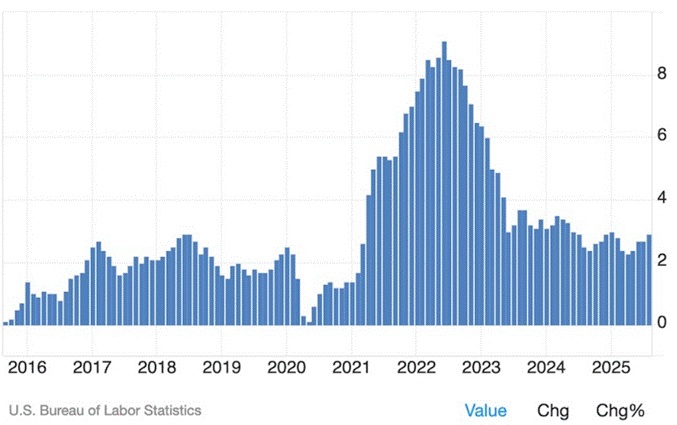
10-year inflation (CPI). Source: Trading Economics
A series of rate hikes took the federal funds rate from 0.5% to 5.5% in July 2023. Rates were unchanged until August 2024. One 50-basis-points cut, and two 25-bp cuts took the FFR down to 4.5% in January 2025. The first interest rate cut in nine months then took place on Sept. 17, 2025, bringing the rate down to its current 4.25%.
What was gold doing during this 10-year period?
Many investors believe that, since rising interest rates make bonds and other fixed-income investments more attractive, money will flow into higher-yielding investments (such as bonds and money market funds) and out of gold when rates move higher. Therefore, when the Federal Reserve raises its benchmark federal funds rate, weakness in gold should follow. (Investopedia)
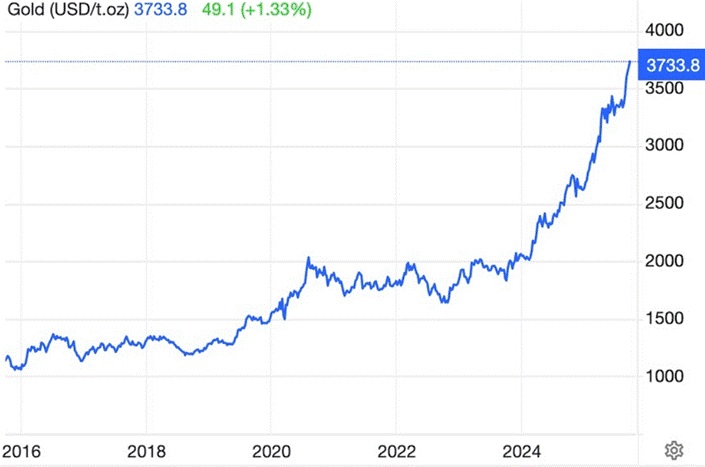
10-year gold price. Source: Trading Economics
If this theory is right, gold should be falling between 2017-19, as the rate climbed, rising between mid-2019 and 2020, as the rate fell, and falling again between 2022 and 2025, as the Fed aggressively raised the rate to fight skyrocketing inflation.
But this isn’t what we see.
Gold chugs along at around $1,200 an ounce from late 2015 to February 2020, when it begins to rise above $1,500. This coincides with the pandemic — gold climbs when it attracts safe-haven demand — but is out of step with interest rates. Remember, the FFR was climbing between 2017 and 2020, but gold was unaffected. It kept going at around $1,200.
The Fed’s intervention during the pandemic took the FFR down to 0.25%. Gold should have shot up, if the correlation between interest rates and gold holds. But it didn’t. Gold indeed climbed, hitting a high of $2,031 on Aug. 10, 2020, but it slipped under $2,000 for the rest of the year. Despite rock-bottom rates, gold continued its mediocre performance, dropping as low as $1,537 in October ’22.
Remember, the Fed started raising rates in March 2022. All the way to 5.5% in July 2023. Rather than falling, as expected, during the rate-raising cycle, gold gained. From Oct. 10, 2022, gold advanced from $1,517 to $2031 on Feb. 19, 2024, the start of gold’s latest up-leg to its current $3,739/oz. That’s an addition of $514, or 33%.
Our conclusion? Interest rates had nothing to do with, or at least had a very low correlation, to gold during its current bull run.
“Ah,” gold bugs say. That’s no surprise because the stronger correlation is between gold and real interest rates, which is the interest rate adjusted for inflation. To find the real interest rate, simply subtract the rate of inflation from the federal funds rate, or the 10-year US Treasury yield, which acts as a proxy for rates.
Gold prices tend to increase significantly only during the periods of negative real interest rates. This is because negative interest rates, i.e. the situation when the inflation rate is higher than the nominal interest rate (the rate which is actually paid), means that creditors are losing money, therefore they are more prone to buy gold, even though it does not bear interest or dividends. In other words, gold reclaims then its traditional role as money and a store of wealth, which will at least keep pace with inflation to preserve the purchasing power of the capital, while bonds guarantee a real loss at negative real interest rates.
In the chart below, notice that the real interest rate is negative for only a short period, between March 2020 and September 2021. Even during these 18 months, real rates popped up from negative to positive in April 2021.
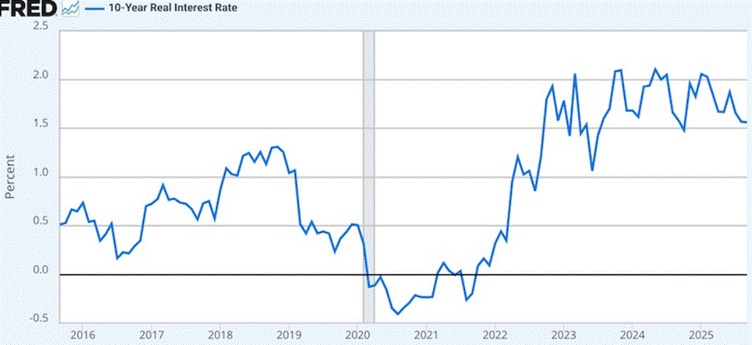
Source: FRED
If the theory is correct, gold should have shot up during this year and a half. But it didn’t. Gold bumped along between $1,750 and $2,000, only once breaching $2,000, in August 2020. The rest of the time real interest rates were positive, i.e., above zero. The 10-year peak was 2.10 in May 2024. By this time, gold had hit about $2,300, and it was about to go a lot higher.
Our conclusion? Real rates, whether positive or negative, appear to have had no impact on gold’s dramatic rise from ~$1500 in August 2022 to ~$3,500 three years later.
The dollar
When the US dollar depreciates against the world’s major currencies such as the euro and the yen, gold prices usually rise. Because the price of gold is traded in dollars, when the dollar weakens, gold is cheaper compared to other currencies that investors hold, boosting its appeal to investors.
Take a look at the US dollar index DXY chart below. The first thing we notice is that the buck is quite volatile. It hits a high of 102 in March 2020, as fear over the pandemic drove investors to buy safe havens like the US dollar. The low was 86 in February 2018, closely followed by 89 at the end of December 2020, coinciding with the pandemic’s negative effects on the US economy.
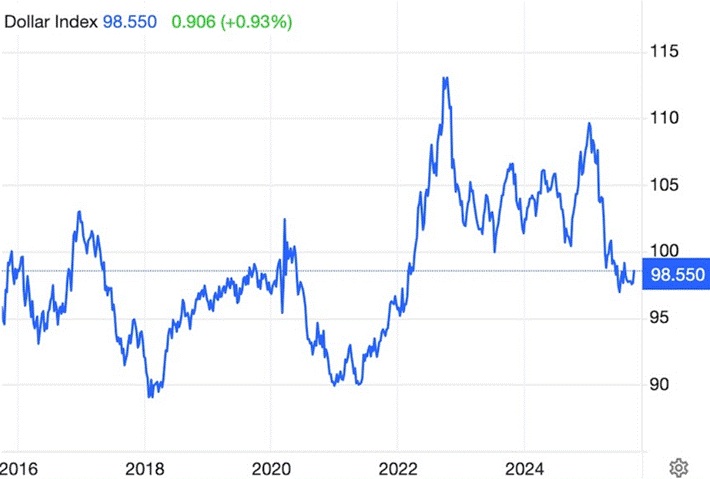
10-year DXY chart. Source: Trading Economics
What did gold do during this period? It was generally flat between 2015 and 2019, with a rise starting in August of that year. If gold is negatively correlated to the dollar, gold should have dropped between 2018 and March 2020, DXY’s first peak in the chart above. Instead, gold rises from about $1,205 to $1,710, about a $500 jump.
Next, take the decline in the dollar index from early 2020 to mid-2021. How did gold do during what should have been a gold-positive environment? Well, gold was basically flat. It rose, but not by much. For easy numbers, call it $1,500 to $1,800, a 20% gain.
We then enter the Biden administration, 2021 to 2025. This was a positive period for the dollar, as Biden sought to grow the economy through job-creation programs like the Inflation Reduction Act and normalize relations with allies following Trump’s bumpy first term.
From May 2021 to September 2022, DXY spiked from 89 to 113, a gain of 26%. What was gold doing? Again, it was flat. During a period that should have been negative for gold, the precious metal puttered along at around $1,800.
The second Trump administration has been characterized by a low dollar, which is just the way Trump likes it, since a weak dollar is good for exports, and backs Trump’s mantra of repatriating American manufacturing jobs lost to overseas competition.
This is the only time in 10 years that we see a positive correlation between a falling dollar and rising gold prices. From Trump’s inauguration in January 2025, DXY has fallen from 109 to the current 98, a loss of 12%. Gold meanwhile has rocketed from about $2,600 in early January to its current $3,750, a gain of 44%.
Three factors why the dollar has been in decline, by Visual Capitalist:
- GDP growth projections are soft
- Inflation expectations are stable but elevated
- Interest rates are down
Inflation
Let’s briefly look at inflation and gold. It’s generally believed that gold rises during periods of high inflation, since gold, unlike fiat currencies, does not lose its value when the prices of goods and services go up.
From the chart above, see inflation running from 0.1% in May 2020 to a 40-year high of 9.1% in June 2022. During this period, gold rose from about $1,700 to $1,800 — only a $100 gain certainly represents a weak correlation between the two variables.
What it is
The fact is when you cut through all the charts and numbers being thrown around above, and come right down to the nitty gritty of the situation we’re now in, interest rates, real interest rates, bond yields, the dollar and inflation are all suppose to be factors affecting the gold price, but we have shown none of them are responsible for gold’s meteoric rise of the past two years.
So, what gives? In a word: Trump.
Trump
During Donald Trump’s first term as president, gold rose from $1,209 to $1,839. Factors included trade wars, geopolitical tensions and the covid-19 pandemic. Trump’s protectionism and MAGA rhetoric incited BRICS like China, Russia and India to move away from the US dollar as the global reserve currency, and increase their gold reserves, pushing gold higher.
Gold has received a significant boost from President Trump 2.0, and it has kept climbing as his trade war continues.
With Aug. 7 tariffs going into effect, including bumping Canada’s tariff rate from 25% to 35% on goods not covered by the Canada-US-Mexico Trade Agreement (CUSMA), increasing steel and aluminum tariffs to 50, slapping a 50% tariff on select copper products, and identifying 26 countries whose goods are now subject to US tariffs greater than 15%, gold has benefited, big time.
Yahoo Finance reported on Sept. 23 that Fears that Donald Trump could undermine America’s fiscal health by driving up borrowing, and his undermining of the US Federal Reserve, are also making gold look an attractive safe place for traders.
Spot gold surged to a fresh record $3,728.36 per ounce on Monday, Sept. 21 following the Federal Reserve’s 0.25% rate cut and expectations of more to come before the year is out.
US gold futures were 1.3% higher at $3,755.20 in New York.
Bad US economic news
We’ve already seen spectacular gains, but we believe that we are going to see a lot more before this precious metals and commodities bull market is over.
If the employment situation worsens and inflation keeps climbing, look for economic growth to sputter as the US enters stagflation — an unsavory mix of inflation, low growth and high unemployment.
According to a recent survey, a growing number of manufacturers are exiting the US market amid tariff pressures, economic unpredictability and rising costs.
Roughly one in five international manufacturers have withdrawn operations or scaled back presence in the U.S. over the past year, putting America among the top three countries from which firms are pulling back, alongside China (22%) and Russia (30%).
How has gold done during stagflation? As it turns out, quite well. The chart below by Sunshine Profits shows the gold price climbing during the stagflationary 1970s, surging from $100 per ounce in 1976 to around $650 in 1980, when CPI inflation topped out at 14%.
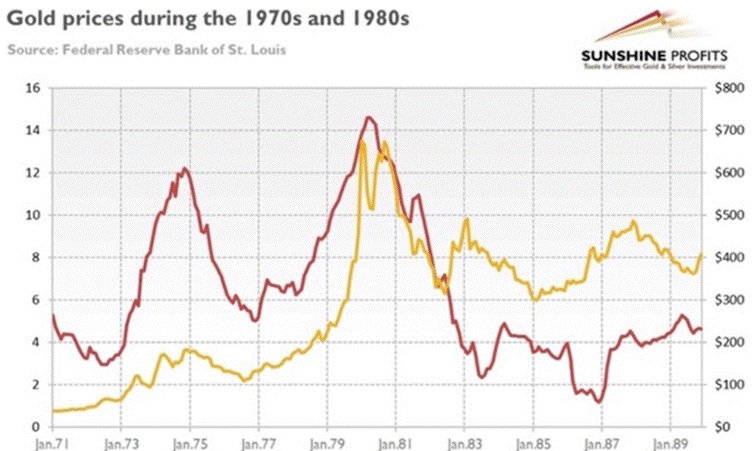
Gold prices in yellow compared to inflation in red.
Source: Sunshine Profits
In fact, gold outperforms other asset classes during times of economic stagnation and higher prices. The table below shows that, of the four business cycle phases since 1973, stagflation is the most supportive of gold, and the worst for stocks, whose investors get squeezed by rising costs and falling revenues. Gold returned 32.2% during stagflation compared to 9.6% for US Treasury bonds and -11.6% for equities.
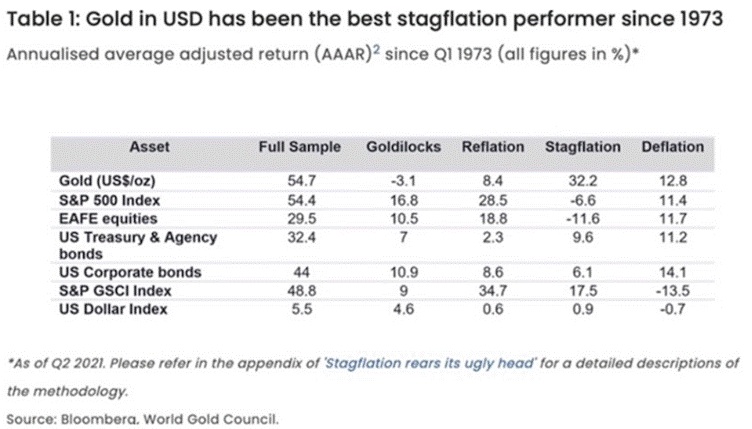
Bad economic news leads to precious metals being are an attractive alternative to stocks. Gold/ silver perform even better if the dollar weakens. Investors also like gold and silver when inflation is high; unlike fiat currencies, precious metals don’t lose their value.
(On Sept. 25 silver rose above $45 for the first time since 2011, the year it hit a record. Gold’s sister metal has beaten its year-to-date performance, +55% to +44%.)
Gold is actually cheap relative to the current global fiat money supply, states Katusa Research, via Market Sanity.
- If gold matches its 2011 money-supply ratio, you’re looking at about $4,400 per ounce.
- If gold matches the 1980s ratio, it’s about $9,700 per ounce.
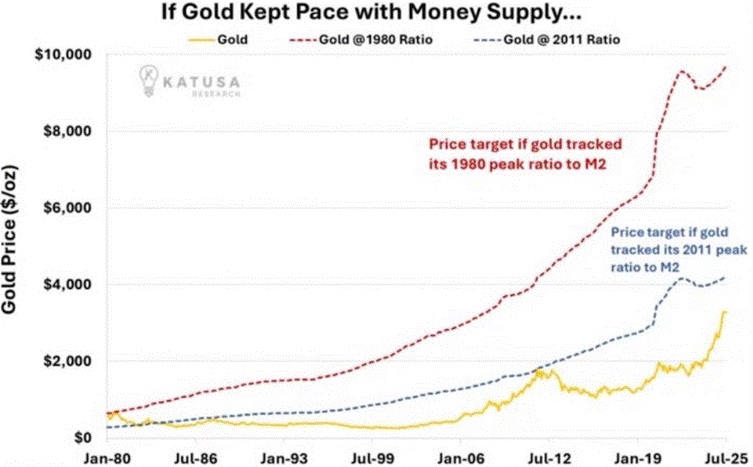
Source: X
Central bank buying
The World Gold Council (WGC) says gold is attracting more attention from central banks than at any time in the last decade.
In its annual central bank gold survey, published in June, the WGC said 95% of respondents expect global gold reserves to increase over the next 12 months. 43% of central bank reserve managers said they plan to increase their gold holdings this year, compared to 29% in last year’s survey. (Kitco News)
Over the past three years, central banks have purchased over 3,000 tonnes of the precious metal. Analysts predict they could add another 1,000 tonnes to their reserves this year.
Demand is largely being driven by emerging market central banks, which are diversifying their holdings away from the US dollar, more so than developed market central banks.
Central banks worldwide are on track to buy 1,000 tonnes of gold in 2025, which would be their fourth year of massive purchases as they diversify reserves from dollar-denominated assets into bullion, consultancy Metals Focus said, via Reuters.
French bank Société Générale (SocGen) upped its gold allocation from 7% to 10% for a protective hedge as the US Federal Reserve begins a rate lowering in the face of rising inflation. The French bank expects gold prices to average $4,128 an ounce in 2026.
“From an asset allocation perspective, we have looked at gold in the context of the USD’s dominance being challenged. The key drivers supporting gold remain firmly intact,” the analysts said.
They added that they expect gold prices to remain well supported as falling interest rates and elevated inflation push real yields lower, increasing demand for gold as an alternative store of value.
Kitco News quoted the managing director and global head of commodity strategy at TD Securities stating that Gold has a very good chance of reaching $4,000 per ounce in short order as China and other emerging market central banks will need to buy millions more ounces to reach the reserve ratios of leading developed nations.
De-dollarization
The decline in the value of the US dollar is, so far, one of the most newsworthy trends of 2025, along with the Trump tariffs.
The US dollar index (DXY), which reflects the dollar’s value against a basket of other currencies, is down 12% year to date. According to CNBC, it was the worst first half of the year for the dollar since 1973.
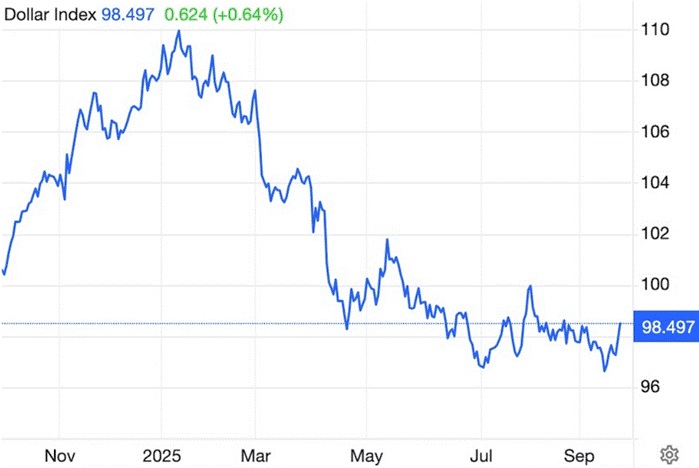
1-year DXY. Source: Trading Economics
June’s global fund manager survey from the Bank of America showed the net underweight position in the dollar is the largest in 20 years.
The same survey in August found investors were 16% underweight the dollar, the lowest level since 2006.
Moreover, “short dollar” was among the top three “most crowded trades”, just behind “long gold” and “long Magnificent 7” stocks.
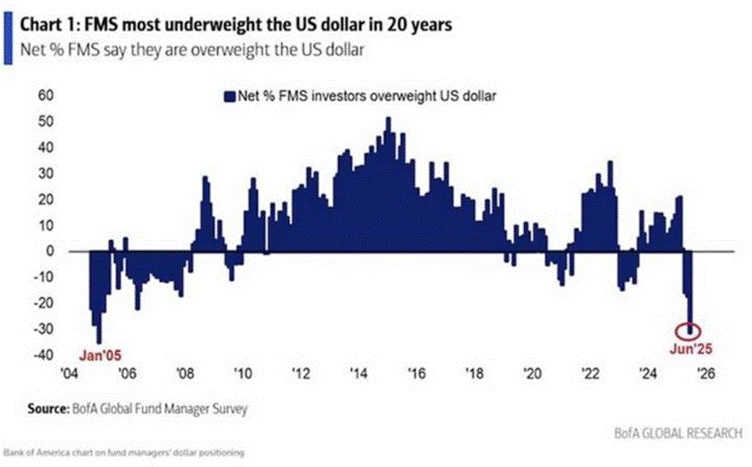
Reuters columnist Mike Dolan says the 20-year high in dollar underweighting by asset managers indicates both wariness of US assets at large — due to concerns about the current US administration’s approach to global trade, geopolitics and institutional integrity — and a more structural dollar retreat.
He quotes Vincent Mortier, chief investment officer at Amundi, saying, “The name of the game will be diversifying away from the U.S. and into European and emerging market bonds.”
Over at U.S. Global Investors, Frank Holmes notes that UBS says the dollar is now “unattractive.
The de-dollarization trend continues, with foreign vendors from Latin America to Asia asking US importers to settle invoices in euros, pesos and yuan to avoid USD currency swings.
Holmes observes the inverse relationship between gold and the dollar “has been on full display this year.”
Holmes confirms what was said above about more emerging-economy central banks buying gold than developed-economy CBs, and he notes that many of these nations are exploring alternatives to the dollar-based financial system which they increasingly see as a source of vulnerability rather than stability.
After the 2022 invasion of Ukraine, the US and its allies froze $335 billion of Russia’s foreign exchange reserves, which alarmed other nations. They bought and are buying gold to prevent the same thing from happening to them.
Geopolitics
Precious metals have been on a tear this year and that is no surprise considering the current political climate south of the border, and the geopolitical tensions throughout the globe, particularly Israel-Iran missile strikes and the ongoing war between Russia and Ukraine.
Trump’s tactless remarks have many speculating he could stumble into World War III. On Tuesday, Trump said NATO countries should shoot down Russian aircraft if they enter their airspace.
The background here is that Poland and Romania have reported violations of their airspace by Russian aircraft, prompting NATO to scramble fighter jets in response.
Polish Foreign Minister Radek Sikorski, who had been critical of Trump’s approach to Russian President Vladimir Putin in peace negotiations, responded quickly to Trump’s comments that NATO allies should shoot down Russian drones in their airspace.
“Roger that,” Sikorski wrote on X.
Scary.
We also can’t forget the South China Sea. China is sending aircraft carriers out into the Pacific and making big waves against Taiwan.
A standoff occurred in June between the Chinese and Philippine coast guards off the Philippine province of Palawan. Three Chinese coast guard ships challenged a group of Philippine vessels about 60 miles offshore — well within the country’s 200-mile limit.
The Chinese ships took umbrage to the Philippine Coast Guard escorting what appeared to be a fishing vessel into waters south of Half Moon Shoal, an atoll west of Palawan and on the edge of the contested Spratly Islands archipelago. (Newsweek).
China claims 80% of the South China Sea as its territory.
Incidents like these — wars, territorial disputes, and bad economic news such as inflation, low economic growth or a pending recession — normally push investors towards safe havens like gold and silver.
Gold supply
With the gold price elevated, gold miners are making money hand over fist and shareholders are reaping their rewards.
The problems facing gold producers are going to become apparent in the next few years.
Gold mines have been mining at a higher grade than the reserve grade for much of the last decade. Mining areas of the orebody with the highest-grade material is known as high grading.
Mining high-grade accessible areas of their deposits is one way for operations to bolster margins when facing low metal prices.
Gold head grades declined 7.5% to 13.4% between 2012 and 2022.
Global tonnage of ore and waste in 2023 was the highest on record with further increases expected for 2024.
The average strip ratio for primary gold mines in 2022 was 4.24:1. Slightly down from the highest ever recorded in 2021 at 4.29:1.
S&P Global Commodity Insights shows that gold discovery rates continue to decline.
A total of 353 new gold deposits hosting 3 billion ounces of reserves, resources and past production was discovered between 1990 and 2024. The peak was in 1995 where 28 major discoveries were made.
Most of the new ounces were from deposits discovered decades ago.
Since 2020, only six major discoveries have been made.
The average discovery size from 2010-19 was 7.7Moz, but since 2020 has declined to 4.4Moz.
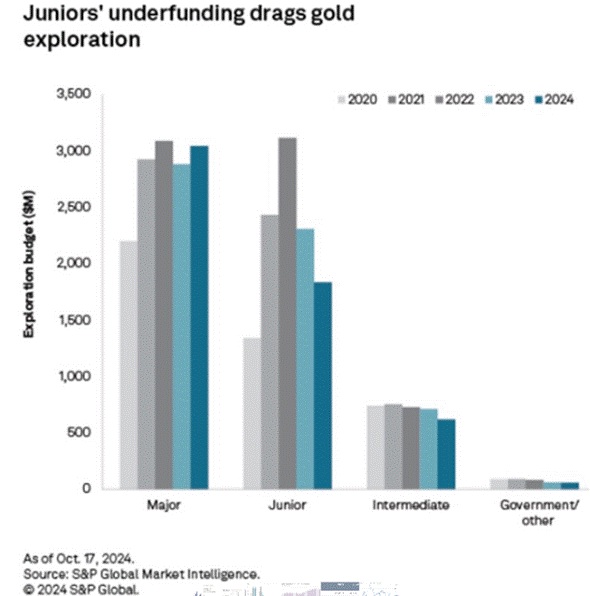
Exploration budgets fell by 22% over 2023 and 2024. Just 19% of the existing budget for exploration in 2024 went to greenfield exploration.
S&P Global expects brownfields exploration to remain the focus moving forward but equity raises for juniors in the first half of 2025 have already passed the total for 2024.
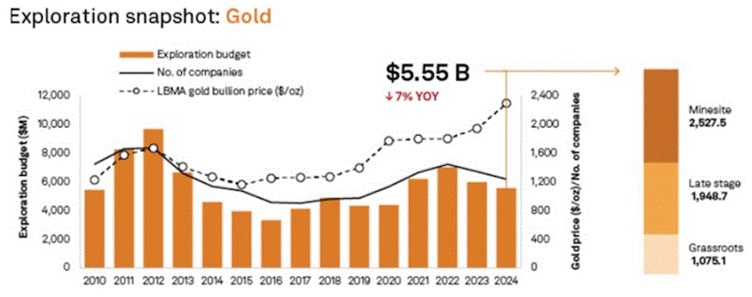
Source: S&P Global
Source: S&P Global
The concept of peak gold should be familiar to most readers. Like peak oil, it refers to the point when gold production is no longer growing; It reaches a peak, then declines.
If gold is indeed becoming scarcer, prices have only one way to go and that’s up, so long as demand for the precious metal is constant or growing, which it is.
The latest full-year World Gold Council report shows a 1% increase in total gold supply in 2024, compared to 2023, 4,974.5 tonnes versus 4,945.9t. In fact, gold supply in 2024 surpassed the record reached in 2018.
According to WGC, 2024 mine production reached an all-time high of 3,661.2 tonnes, beating 2023 mined output and just surpassing 2018’s record 3,656t.
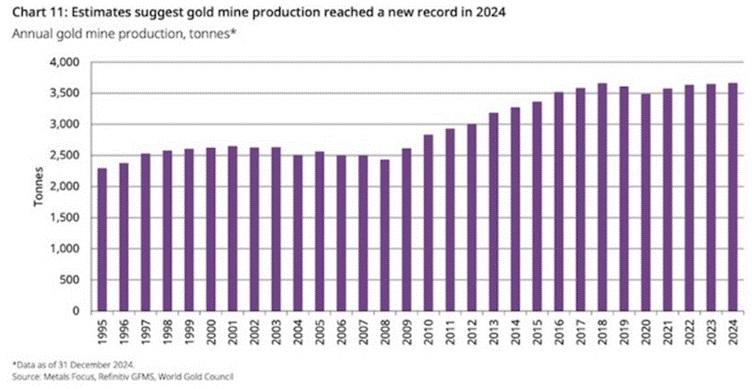
Source: World Gold Council
In 2024 total gold demand (including OTC investment) rose 1% y/y in Q4 to reach a new quarterly high and contribute to a record annual total of 4,974t.
The World Gold Council (WGC) reports that 2024 mine production was 4,974.5t.
Gold jewelry recycling was 1,370t, bringing total gold supply in 2024 to 4,974.5t.
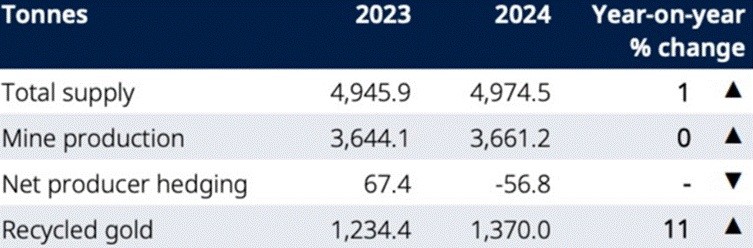
Source: World Gold Council
If we stop there, we show that mined gold supply exactly meets gold demand at 4,974t. No peak gold here, right? Demand is satisfied by supply.
Not so fast, let’s think about those numbers for a minute. In calculating the true picture of gold demand versus supply, we, at AOTH don’t, and won’t, count jewelry recycling. What we want to know, and all we really care about, is whether the annual mined supply of gold meets annual demand for gold. It doesn’t! When we strip jewelry recycling from the equation, we get an entirely different result. i.e. 4,974 tonnes of demand minus 3,661.2 tonnes of production left a deficit of 1,312.8 tonnes.
This is significant, because it is saying even though major gold miners are high grading their reserves, mining all the best gold and leaving the rest, they still didn’t manage to satisfy global demand for the precious metal, not even close. Only by recycling 1,370 tonnes of gold jewelry could demand be satisfied.
This is our definition of peak gold. Will the gold mining industry be able to produce, or discover, enough gold, so that it’s able to meet demand without having to recycle jewelry? If the numbers reflect that, peak gold would be debunked. We’ve been tracking it since 2016, and it hasn’t happened yet.
In a world of resource depletion, it falls to gold exploration companies to fill the gap with new deposits that can deliver the kind of production required to meet gold demand, which is currently out-running supply.
Wood Mackenize says to avoid a perpetual decline in mined gold; the industry must see a rise in the number of gold projects under development that have a good chance of becoming mines.
How many projects? 44, to be exact.
Intuitively, that seems virtually impossible – Wood Mackenzie agrees.
“If all our probable projects were to come online before 2025, this would almost meet the requirement to maintain 2019 production levels,” said Rory Townsend, Wood Mackenzie’s head of gold research.
“The likelihood, however, is that we see some degree of slippage among a number of these assets due to permitting delays, prioritization of other capital projects and changes in scope,” said Townsend.
Consider: in the 1970s, ‘80s and ‘90s, the gold industry found at least one +50Moz gold deposit and 10 +30Moz deposits. Since 2000, no deposits of this size have been found, and very few 15Moz deposits.
Don’t believe us? Here’s Ian Telfer, former Goldcorp chairman, and gold industry expert, giving his argument for peak gold, in 2018:
“In my life, gold produced from mines has gone up pretty steadily for 40 years. Well, either this year it starts to go down, or next year it starts to go down, or it’s already going down… We’re right at peak gold here.”
To get world gold mine production back to the point where it can meet the required annual demand without recycling jewelry, the industry has two choices: it can mine more gold, or it can discover new gold.
Squeezing more gold out of existing deposits has its challenges. Reserves are getting depleted, and mines are having production problems, including lower grades, labor disruptions, protests, etc.
But finding and exploiting new gold deposits is even harder, more expensive and riskier.
Few gold exploration projects have the economics, scale, jurisdiction and money-raising capabilities backing them, to become mines. Those with the staying power to make it through the various development stages, from initial discovery to drilling to resource definition to first production, will be the belle of the ball, so to speak, with many major gold miners cueing up for the first dance.
Gold demand is climbing in the face of structural supply problems. The gold industry is in trouble. Only by massive investment into junior resource companies looking for the precious metal will supply problems be alleviated.
Conclusion
We started this article by observing that investors are both bullish on equities and afraid that there are major downside risks.
The latter is pushing them in the direction of precious metals, which offer comfort during periods of extreme volatility and market fear.
What are investors afraid of? Inflation and a stock market crash.
“U.S. inflation is priced to linger above target in the next few years, which is far from ‘perfect,’” Deutsche Bank’s Henry Allen wrote in a note to clients seen by ‘Fortune’ magazine.
“That links up with lingering tariff fears, with reviews still due into sectors like pharmaceuticals and semiconductors. Prediction markets think a U.S. government shutdown at the end of the month is increasingly likely. And markets are clearly worried about the payrolls slowdown too, hence rapid rate cuts are priced in. So, the reality is there are lots of downside risks priced in…”
Investors are shying away from bonds due to inflation. The inflation threat has them demanding higher yields especially on long-term bonds. The yield on the 10-year Treasury as of this writing is 4.17%, while the 30-year continues to flirt with the disastrous 5% level, 4.75%.
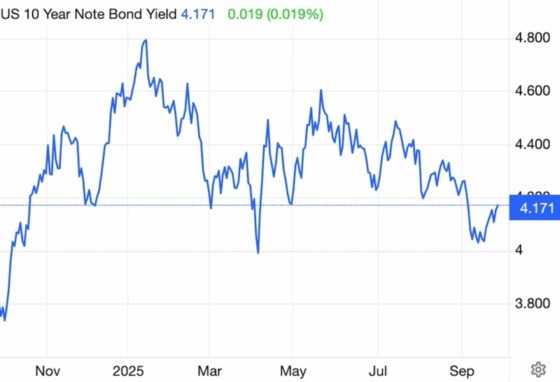
US 10-year Treasury yield. Source: Trading Economics
Central banks continue to purchase gold bullion at a torrid pace. They are on track to buy 1,000 tonnes of gold in 2025, which would be their fourth year of massive purchases.
While some retail investors have sat out this gold bull due to how expensive the physical metal is (bars and coins), retail is starting to get in the game through gold-backed exchange traded funds.
Bloomberg reported that inflows into gold ETFs surged to a record $10.5 billion so far in September, with YTD inflows exceeding $50 billion, citing Citigroup data.
The Globe and Mail noticed something about the current bull market in US stocks.
From January through the first week of September, Canadian stocks returned 22.5% in US dollar terms, outpacing US stocks which returned just 12.2%.
Despite underperforming its global competitors, the newspaper warns that the US stock market is “bubbly”. US stocks trade for 44 times their average inflation-adjusted earnings of the past decade, compared to “only” 29X for Canadian stocks.
If Wall Street’s and Bay Street’s ratios revert to their long run means over the next decade, the Globe further warns that investors’ returns over the next few years will be substandard.
There has been plenty of talk about AI stocks being in a bubble, similar to the 1999-2000 dot-com boom and bust.
Another red flag to markets is bitcoin. Marketwatch noted the cryptocurrency fell on Sept. 21 while gold rallied. Why is that important? Because according to Eric Teal, chief investment officer at Comerica Wealth Management, this combination might not bode well for the US stock market.
“We’ve had several weeks of risk-on approach,” Teal said in a phone interview. “And now we’re entering the late September and early October [period], historically some very volatile sessions,” he said. “We’re inclined to take pause, here,” he said, adding that after the recent rally the market looks likely to shift into more of a risk-off mode.
Market fear is starting to pile high and deep.
One source notes that, with stocks consistently hitting new highs, investors are overlooking the US dollar, which as mentioned is down 12% so far this year — the sharpest drop in 50 years.
“Yet equities rising in nominal terms doesn’t erase the reality that the currency itself is shrinking in value. That illusion can lull markets into complacency,” Goldsilver.com writes.
The website adds that the OECD expects the Fed to cut rates three more times, bringing them down to 3.25-3.5% by spring 2026.
“With U.S. growth slowing to 1.8% this year and inflation stuck above target at 2.7%, the OECD sees room for monetary easing despite sticky prices.”
The managing director and global head of commodity strategy at TD Securities has stated that gold has a very good chance of reaching $4,000 per ounce in short order. Bank of America agrees gold could reach $4,000 by the second quarter of 2026.
“Since 2001, gold has pushed higher every time the Fed has cut rates when US CPI is above 2%,” said Bank of America’s precious metals team led by Michael Widmer.
Specifically, Bank of America noted that gold prices have seen average gains of around 13% within 12 months after the Federal Reserve has cut interest rates in a stubborn inflationary environment. (Kitco News)
I can’t think of a better time to invest in gold and silver, or the junior resource companies that explore for the precious metals.
Richard (Rick) Mills
aheadoftheherd.com
********


