Gold And Silver Prices Break Below Support


Is this a major break in the long term trend for gold and silver? A break that can be expected to set in place a bearish trend for a good part of 2018? After perhaps the most relentless, intense pressure of the past 6 years since the high in 2011, prices of gold and silver have broken below significant medium to longer term support. How bad is this really and what does the future hold now?
Comments from a majority of non-establishment commentators on precious metals during recent months have mentioned increasing scarcity of these metals, silver in particular. Opposed views are also published, but as a rule these lack the market details needed support their views on ample supply with solid facts. The behaviour of those parties who are heavily short on Comex, such as the recent intense selling to force prices to new lows, also tend to support the view that increasing lack of reserves is building up to a crisis that could cripple the effort to suppress prices and the ability to enable timely deliveries against long positions.
The increasing interplay between Comex and the LBMA in London suggest that gold and probably silver obtained from the hub of the physical metal trade in the UK are now being relied upon to reduce the risk of default on Comex. Should the time be running out for the sustained effort to keep the metal prices in check as evidence suggests, it means that for the big banks it has become of paramount importance to reduce exposure to their short positions before they become caught in a short squeeze. They have taken on too much risk in their effort to keep metal prices low to protect the dollar, but they have to be realistic and consider their own survival as being of greater importance than the health of the dollar.
Is it working? Are the precious metal longs running away to reduce the risk for the shorts? Comex open interest on 8 September, when the current campaign against the metals kicked off, was 577 444 for gold and 188 341 for silver. For Friday 8 December, the preliminary report had the gold OI at 454706 – a massive 122 738 down from 3 months ago. So that part of the campaign has worked; the exposure to short positions in gold is lower by 21%. However on Friday the silver OI was just below 200 000 at 197 197, up by 8 856 over the three months, nearly 5%.
A three month period of sustained selling to frighten off the longs, with the price of silver down from $18.21 to $15.82 (14%) and the OI jumps almost 5%. Unreal! It means that despite all the effort to get rid of the longs, pressuring prices is actually inspiring the silver bulls to buy more. Counter-productive and a recipe for disaster.
One wonders if, as evidence also suggests, the relentless rise of the DJIA and the SP500 means that Wall Street is receiving outside support to the same degree as the metals are being subjected to selling pressure. Any dips in the stock market indices are being bought as eagerly as rallies in the metals are being sold; also with good effect, as serial all time highs in die DJIA, SP500 and the Nasdaq attest, at the same time as the precious metal prices last week break their below medium term support to signal fresh weakness.
December is normally a good month for gold, but the regular nemesis for gold – the non-farm payroll number on the first Friday of a new month, but this time it was last week, the second Friday of the month – may hold a key to the extended attack to keep prices as low as possible. If so, this week should see a rebound from the new recent lows, perhaps to rally back above the earlier support. If success cannot be achieved, it could mean a bad start to 2018 for gold and silver.
In the meantime, Bitcoin is becoming very volatile, with daily swings approaching 20% and the price starting to jump better than $1000/day. The market is becoming unstable between increased profit taking and many new buyers rushing in. Beware!
Euro-Dollar
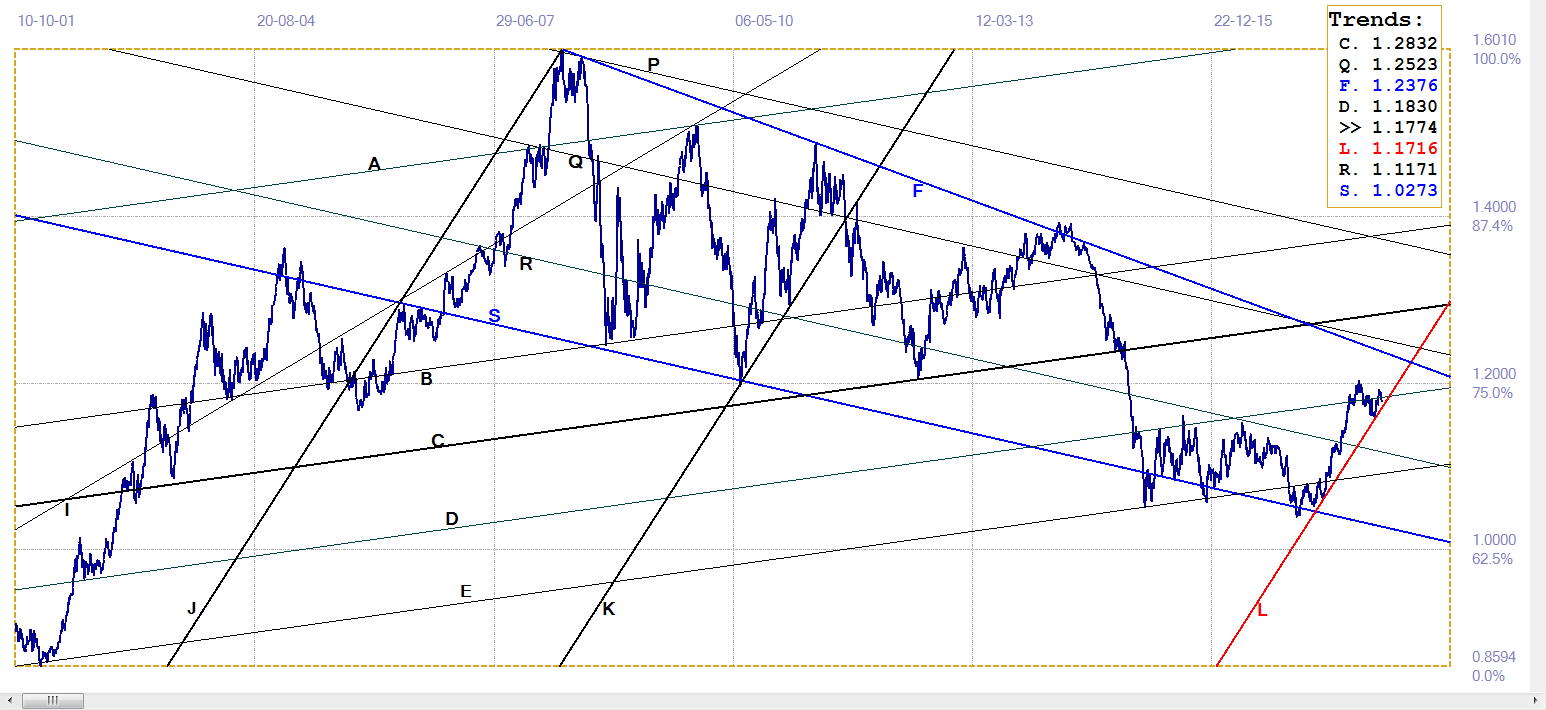
Euro-Dollar, last = $1.1774 (www.investing.com)
On the forex front, the markets were relatively quiet, with the dollar strengthening a little against the euro and the yen. The euro pulled back to end the week a little below the support of line D ($1.1830), but still holding above the steeply rising support of line L at $1,.1716.
The outlook therefore still has a bullish bias, but then the euro has to continue to hold above the steep support. This week should also see the new bounce for the euro – there is not much of a cushion before the steeply rising support is tested.
DJIA
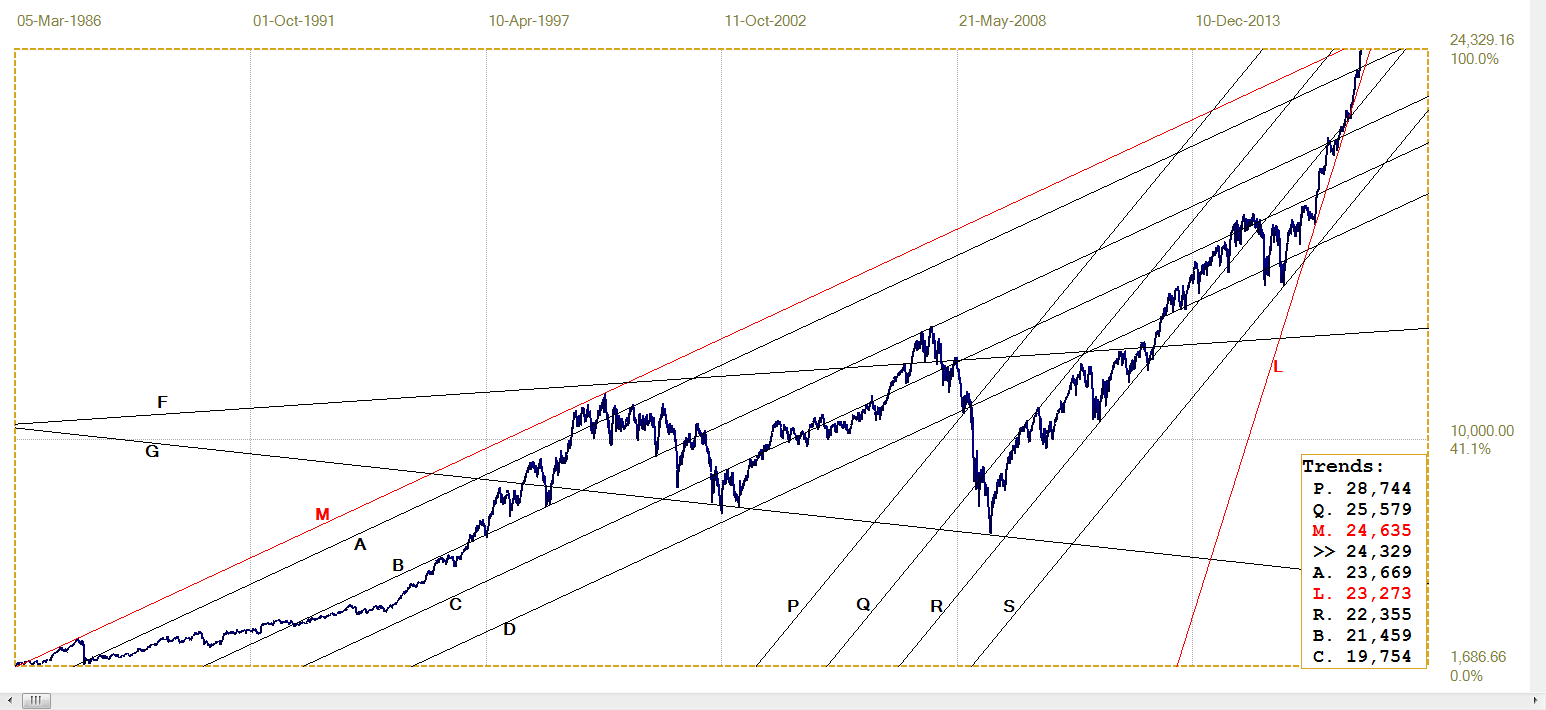
DJIA, Last = 24329.16 (money.cnn.com)
Last week experienced another of the regular weekly all time highs, this time on the Friday, when the DJIA closed at 24 329.16. The near consistently rising trend of the past year has only another 300 points to go before the DJIA gets to test line M, the master gradient used for this analysis. Line M was generated between the high of 1987, just before the big October Crash, and the spike high of 14 January 2000 – the end of the relief rally after fears about the change to Year 2000 proved to have been without grounds.
Will be watching the progress to the meeting between line M and the chart of the DJIA with great interest. Will there be three momentous readings for Wall Street all lying as significant highs along the length of one straight line?
Gold PM Fix - Dollars
Poor gold. Not only is the open interest plummeting under the onslaught of selling, but the price has now again broken below the medium to longer term support of line D ($1270), but also below the more recent, steeper support of line L ($1376) – a more important technical sign of near term weakness.
Gold’s bullish march to challenge the $1300 barrier again, in came to an abrupt halt early in September and has been in retreat since then, holding sideways above line D at best. Then last week, in the run-up to NFP the last blow had the price breaking below the recent bull channel KL by a substantial market. December will have to be at its best for gold if the price is to rally back above the recently broken support in time to give all the gold bulls the kind of Christmas present that will bring a broad smile to their faces!
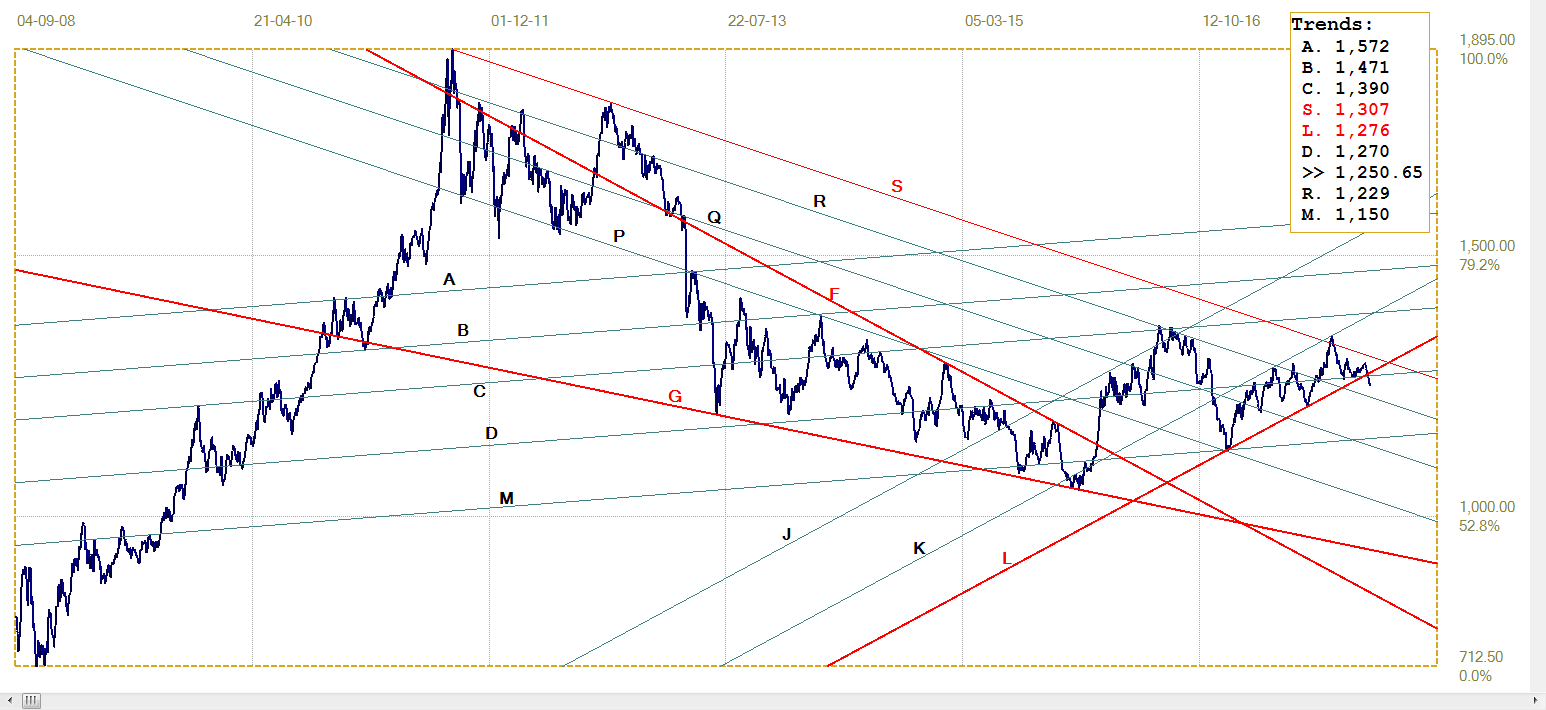
Gold Price – London PM Fix, Last = $1250.65 (www.kitco.com )
Euro-Gold PM Fix
Even the weaker euro of last week could not assist the euro price of gold to hold at or above its own critical support along the line T (€1088) that was used in the chart analysis last week. That break seemed to be a little too fortuitous for the euro price of gold and a new analysis was developed for this week. The fit is good and it was used on that basis.
A new analysis is of course has to be based on a good fit to available history, but a proof that it is really a useful analysis can only be is only obtained over time as the price develops within the new analysis. This coming week has to show that the euro price either rebounds from the support of line C (€1066) or tests and rebounds off line Q (€1054).
Alternatively, if weakness is to persist, the price has to break clear below lines C and Q. Then it is a long way down to the next level of support at line D (€986).
Euro Gold Price – PM Fix In Euro, Last = €1063.8 (www.kitco.com)
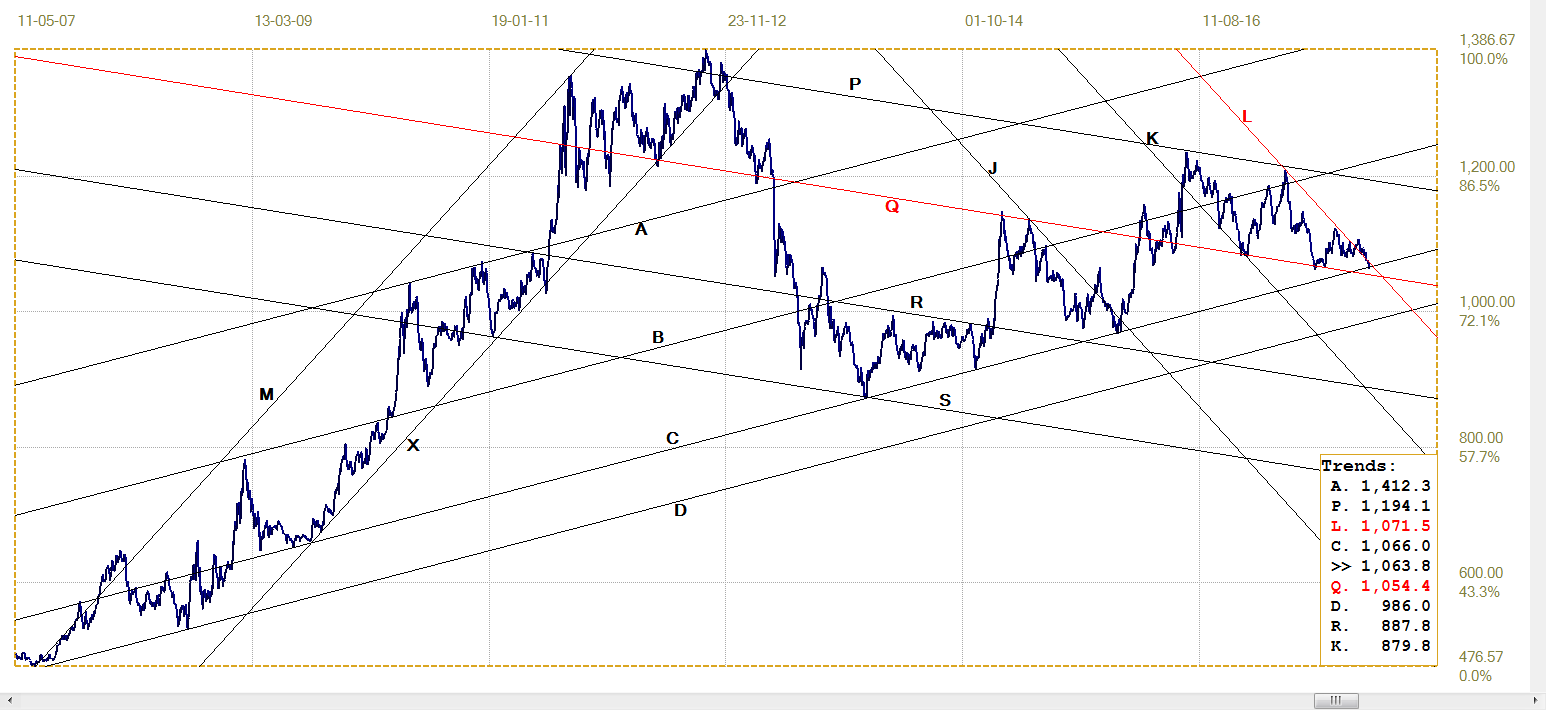
Silver Daily London Fix

Silver Daily London Fix, Last = $15.83 (www.kitco.com)
Here the fit of the existing analysis is too good over too long a time to discard the analysis and attempt a new one that could provide a better fit. The break below support at the bottom of channel KL ($16.78) and at line B ($16.17) therefore is an indication of the severity of the selling pressure exerted to compel longs to close their positions. While many are perhaps doing so, there are too many bulls opening new long positions to maintain and even increase the OI during the three months of sustained selling.
The shorts now have two options; either persist with the selling in the hope that a lot more bulls will leave the market than what are keen to open new positions at the current low prices, or they can accept the situation and taper off on the selling pressure so that the price can recover. More open positions at lower prices is not a good thing if a short squeeze should develop and letting price rise gradually brings in more new bulls. The best therefore might be to launch the opposite of the typical waterfall attacks and clean out the offer stack all the way up to say $18 or $19 and thereby close many of their short positions without giving much opportunity for new long positions to be opened at recent low prices. Are they brave enough to do so?
U.S. 10-Year Treasury Note
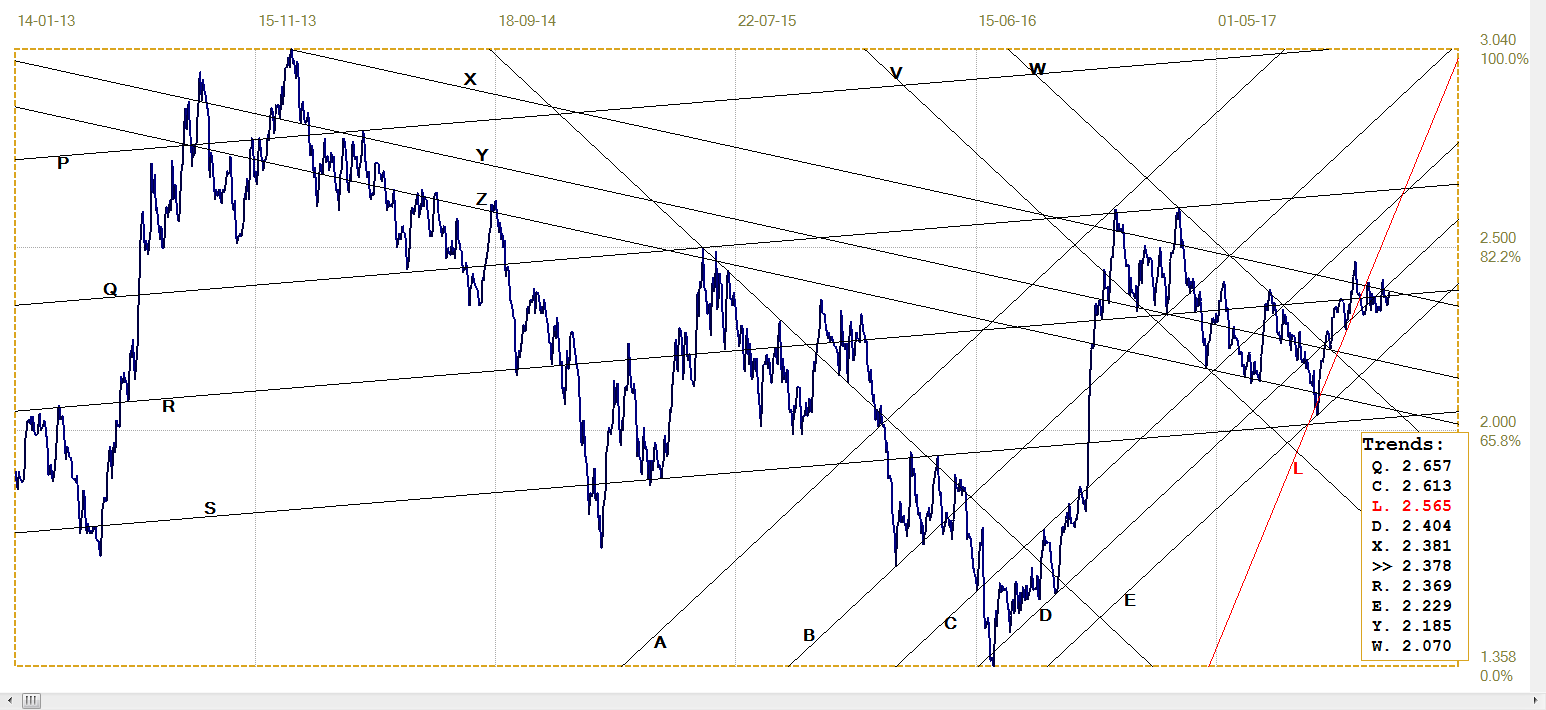
U.S. 10-Year Treasury Note, Last = 2.378% (www.investing.com )
The bond market still has no clear near term direction. The spike higher to 2.415% and above line X (2.381%) two weeks ago, failed to hold, while the rallies to below line R (2.369%) failed to extend. Wait for the sideways trend to end with either a definite and sustained bearish break above line X or a bullish break that extends to well below line R and then holds or extends lower.
Given the degree of intervention visible in other markets, it would not surprise if much later it should become known that the market for US Treasuries, the largest global market, has also been subjected to manipulation to suit official interests and present a picture that has only marginal overlap with the reality of the market.
West Texas Intermediate Crude. Daily Close
The rising trend in the price of crude appears to have difficulties making much headway. This, after having made a break above resistance along bear channel FG ($54.78), followed by what seems likely to be a goodbye kiss on line G – except that the departure higher now has stalled along line F ($56.60) and below line R ($59.85).
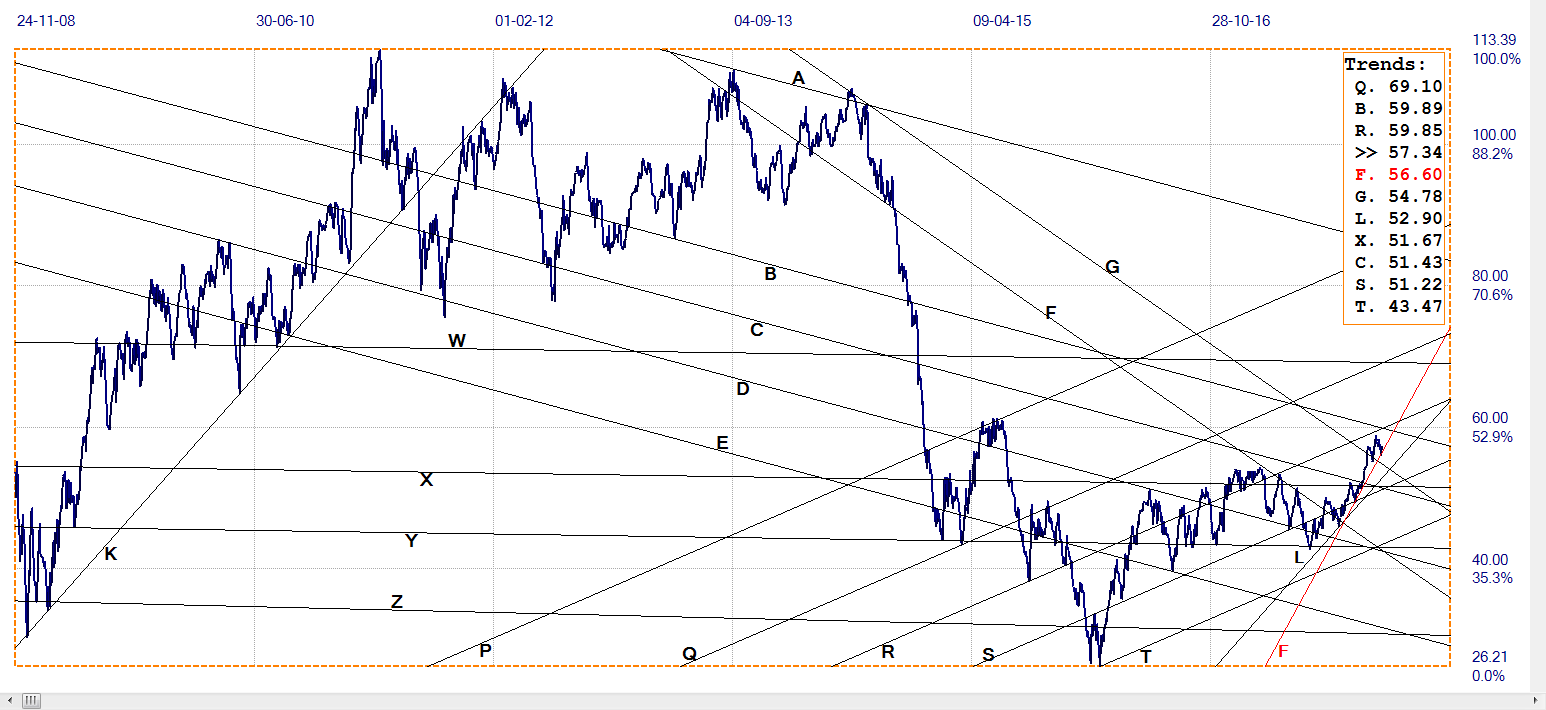
WTI crude – Daily Close, Last = $57.34 (www.investing.com )
This lack of definite direction is a sign that there is still significant uncertainty about the condition of the market and the trends in supply and demand that are driving it. Perhaps 2018 will bring more clarity in this respect. While the current bias after the break higher above channel FG is bullish, it is by no means certain that 2018 will see the rising trend resume to break above lines R and B ($59.89).
©2017 daan joubert, Rights Reserved chartsym (at) gmail(dot)com


