Gold Arrives At The Threshold For Hyperdrive


In concert with Federal Reserve Chairman Jerome Powell's Thursday announcement of a $2.3 trillion monetary injection for the U.S. economy -- on top of the federal government's $2.2 trillion economic aid package and with even more trillions tentatively to be tendered -- a valued core reader of The Gold Update reminded us of this truism from the sage James Grant:
"The case for Gold is not as a hedge against monetary disorder, because we have monetary disorder, but rather an investment in monetary disorder".
And oh do we know how quickly it can go. Let's review:
Gold settled this abbreviated trading week at 1741. 'Tis Gold's first weekly settle above 1700 since that ending 07 December 2012 as price was then tumbling to the 17 December 2015 low of 1047. Indeed, Grant's comment came mere months later on 29 June 2016, Gold by then having scampered back up to 1322.
So yes, that prior 1700 weekly settle came during Gold's disastrous descent. But let's instead focus on the first time price settled above 1700: 'twas on 08 August 2011 at 1720 with Gold into hyperdrive mode, +31% from that January's low of 1309. And with no overhead resistance to impede the way, a mere ten trading days later on 22 August 2011 Gold settled at its highest close ever: 1900. Then ten trading days further found Gold's highest intra-day price ever, the oft-mentioned 1923 of 06 September 2011.
Now Gold has again arrived on the upside at that same 1700 threshold: should history repeat that hyperdrive from here up through our so-dubbed "Northern Front" (1750-1800) and "Final Frontier" (1800-1900), Gold would meet its All-Time High in just 20 trading days from now on 11 May 2020. Shall it? As penned a week ago: we don't know. Let's assess:
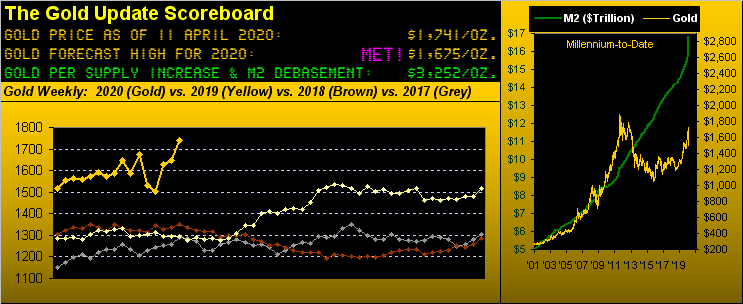
Gold by our opening Scoreboard -- wherein the StateSide M2 money supply is suddenly and rightly growing straight up -- ought by debasement valuation already be at 3252! That remains our very best de facto measure of Gold's true value. Moreover: in times of hyperdrive, price is almost solely steered by the specific fundamental of inflationary, currency devaluation. So much so that one might as well trash one's technicals. Nonetheless, let's cite three important technical observations as follows:
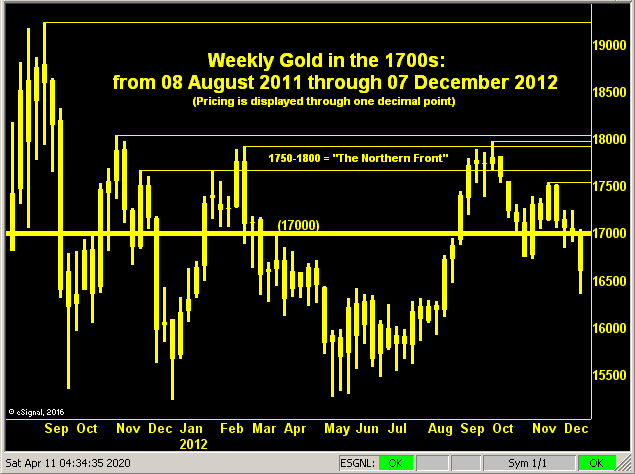
■ 1) The primary theme of The Gold Update essentially year-to-date has been what happens upon the yellow metal's attempting to surge above 1700 given the then massive overhead structural pricing congestion. 'Tis herein been consistently described and graphically depicted for weeks, and is the basis for our having forecast 1675 as this year's high, unanticipative of $bazillions being born suddenly rather than gradually over time. Either way, one ought be mindful of Gold's overhead pricing battles, especially per the following horizontal topping lines within the aptly-named 1750-1800 "Northern Front". The chart's time frame encompasses the entirety of Gold's pricing upon first reaching 1700 as of 08 August 2011 to its last departing 1700 the week after 07 December 2012:
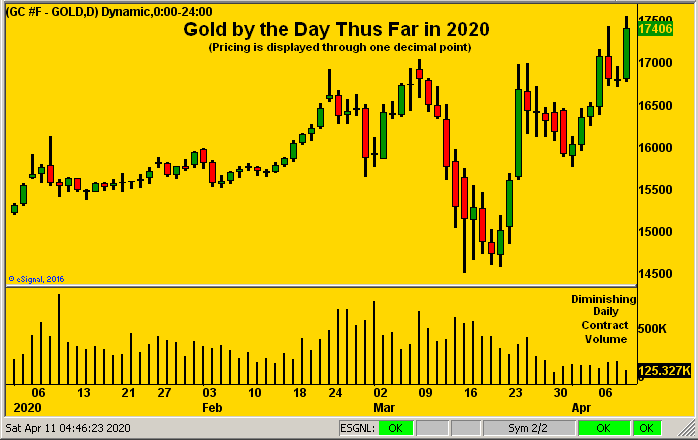
■ 2) Next we fast-forward better than seven years to this year's chart of Gold by the day. And here the technical issue ought be obvious to the sharp-eyed analyst: "Look Ma! No volume!" upon Gold's renewed surge into the 1700s. And the thinner the volume, indeed lack of participation, the easier 'tis to push price: buy 100 contracts into 100 being offered at one price, and one shan't move the market; buy 100 contracts into only 10 being offered up the pricing ladder, and one pays the piper whilst also moving the market higher-and-higher. The recent decline and dearth in volume (per the vertical bars in the graphic's lower panel) is consistent with the ramping up in volatility across all the major markets. And with that comes much higher margin requirements for placing trades. The "day margin" to trade one Gold contract on the CME is stated as $1,500 ... but 'tis not being allowed. Nope: one must commit nearly $10,000 today (the "initial margin" at present $9,185) to trade one li'l ole Gold contract. That's six times as much dough to join the day-trading show. Out with the small fry, for one must be a Big Guy. And thus down goes the participation, i.e. volume, (as well as brokers' commission flows). And lowly loosey-goosey volume leads to large lurches by price in both directions:
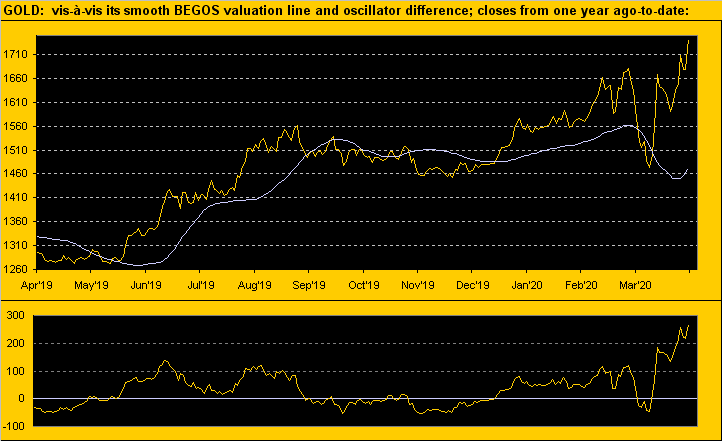
■ 3) Also we've our valuation metric (from the website) for Gold as based on its ever-flexing relationship vis-à-vis the price movements of the primary BEGOS Markets (Bond / Euro / Gold / Oil / S&P 500). Given every rationality that even today at 1741 Gold ought be far higher still, its recent fundamental push shows price at present 269 points "high" above its smooth grey valuation line; (the oscillator at the foot of the graphic depicts that difference between the two upper lines). There've been but two dates since the year 2000 that this valuation difference has been this "high", both being in late August of 2011 as Gold was en route to its All-Time High, only to then severely collapse over the four ensuing years. Yes, it damn well ought be "different this time", but 'tis just something of which to be aware, for at some point out there, Gold and its valuation line shall again cross paths:
Whew! A lot of analysis that! Now to some of our more familiar weekly views, none better with which to start than Gold's weekly bars, for in their fifth attempt in the past seven weeks finally show as materially breaking out above our forecast year's high of 1675, (which as we said when first presented back in January some may deem as "conservative"). Indeed! Here are the bars:

In turning to the Economic Barometer -- and as noted a week ago -- the real brunt from the anticipated poor readings has yet to be churned into the Baro, (which we remind you behaves more as an oscillator rather than as an index). To be sure, the horrid Jobless Claims numbers are already in our present mix: however a critical component therein is "expectations", which having been basically met in turn haven't plunged the Baro below the base of your viewing display. But the Baro at large shall certainly oscillate to lower levels as the ensuing weeks unfold given the better than 50 metrics absorbed each month:
Obviously of interest, too, is the vee-shaped recovering of the S&P 500 (the red line in the above graphic). But surely given the economic demise, the stock market shan't fully recover on this run, (or shall it, given the modern-day disregard of non-supportive earnings?). For clarity, let's check in with our Tuscan buddy Leonardo Bigollo Pisano himself, aka Signore Fibonacci. And by his grasping of nature's quintessentially perfect calculation, from the S&P 500's all-time high of 3394 (19 February) to its recent low of 2192 (23 March) is a distance of 1202 points, 62.8% of which is 755 points, which added to the 2192 low gives us ole Fibo's Golden Ratio upside retracement to S&P 2947, (should you be so fortunate to be scoring at home, which frankly we sense many are these days). And one may rest assured that number is programmed into every trading algorithm from those near our Swiss family in Aarau to Zürich ... and 'round the world!
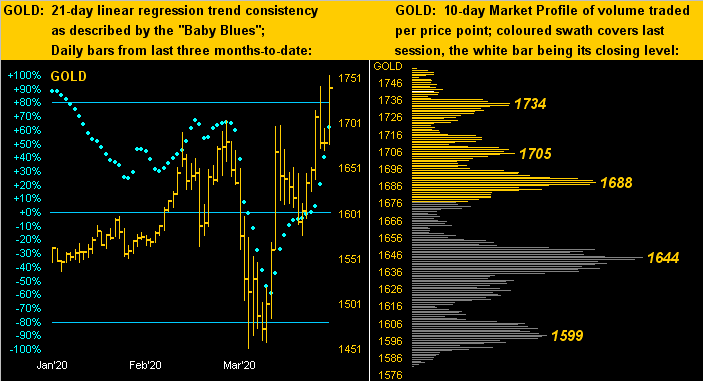
Next to our two-panel graphic of Gold's daily bars from three months ago-to-date on the left with their nicely, upward-accelerating baby blue dots of linear regression trend consistency. And on the right we've Gold's 10-day Market Profile with its most volume-dominant trading supports as labeled:
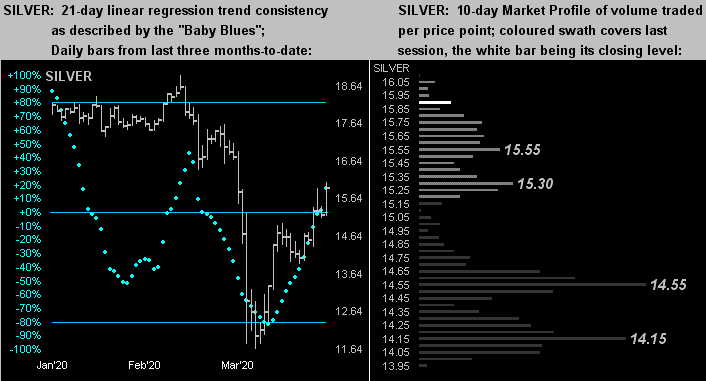
But then comes poor ole Sister Silver. Oh to be sure, she's "come a long way, baby" (you gotta be pretty ancient to remember that Madison Avenue hook). Still, having been as low at 11.64 less than four weeks ago, Silver moved to as high as 16.09 this past Thursday in settling the week at 15.92. That's a gain of +38.2% through 17 trading days. (For the same stretch, Gold's gain was +19.1%). As a Silver equity example, Pan American Silver's (PAAS) gain was +49.3%. Pretty good in a zero percent interest world, what? Yet, Silver's undervaluation relative to Gold remains stark. When Gold first closed over 1700 back on 08 August 2011, Silver settled that same day at 39.05. Even upon Gold later departing the 1700s back on 12 December 2012 (following its last aforementioned weekly close above 1700 that 07 December), Silver, albeit weaker, nonetheless was 33.51: today 'tis less than half that. Got Silver? Here are her like charts with the daily bars and "Baby Blues" (below left) and Profile supports (below right):
And so we go to the Stack:
The Gold Stack
Gold's Value per Dollar Debasement, (from our opening "Scoreboard"): 3252
Gold’s All-Time High: 1923 (06 September 2011)
The Gateway to 2000: 1900+
Gold’s All-Time Closing High: 1900 (22 August 2011)
The Final Frontier: 1800-1900
2020's High: 1755 (09 April)
10-Session directional range: up to 1755 (from 1576) = +179 points or +11.4%
The Northern Front: 1750-1800
Trading Resistance: none, per the 10-day Market Profile
Gold Currently: 1741, (expected daily trading range ["EDTR"]: 60 points)
Trading Support: most notably at 1734 / 1705 / 1688 / 1644 / 1599
10-Session “volume-weighted” average price magnet: 1660
On Maneuvers: 1579-1750
The Weekly Parabolic Price to flip Short: 1468
The Floor: 1466-1579
Le Sous-sol: Sub-1466
The Support Shelf : 1454-1434
2020's Low: 1451 (16 March)
The 300-Day Moving Average: 1450 and rising
Base Camp: 1377
The 1360s Double-Top: 1369 in Apr '18 preceded by 1362 in Sep '17
Neverland: The Whiny 1290s
The Box: 1280-1240
To close, what a difference a week makes, eh? Last week's missive bemoaned Gold losing a gear as the markets were losing their fear. And the S&P 500 sure added to that fact: the Index's +12.1% rise was its second-largest weekly gain in 50 years! But as for Gold, it has arrived once again at the 1700 threshold where last time 'round on a hot August night back in 2011 led to hyperdrive. Notwithstanding the technical cautions described herein, 'tis unwise to stand in front of the onrushing fundamental train. Indeed as goes the song from back in '74: "...hyperdrive has never seen any reason to remain the same..."--[Jefferson Starship]. Oh yes, those were the days. Either way at the end of these days, 'tis best to be aboard the Golden Starship!
www.deMeadville.com
www.TheGoldUpdate.com
********

Mark Mead Baillie has had an extensive business career beginning in banking and financial services for two years with Banque Nationale de Paris to corporate research for three years at Barclays Bank and then for six years as an analyst and corporate lender with Société Générale.
For the last 22 years he has expanded his financial expertise by creating his own financial services company, de Meadville International, which comprehensively follows his BEGOS complex of markets (Bond/Euro/Gold/Oil/S&P) and the trading of the futures therein. He is recognized within the financial community of demonstrating creative technical skills that surpass industry standards toward making highly informed market assessments and his work is featured in Merrill Lynch Wealth Management client presentations. He has adapted such skills into becoming the popular author each week of the prolific “The Gold Update” and is known in the financial website community as “mmb” and “deMeadville”.
Mr. Baillie holds a BS in Business from the University of Southern California and an MBA in Finance from Golden Gate University.


