Gold: Bull Rally Sustains While Above 2018 Highs


Earlier this year, I wrote an analysis suggesting that a major reversal was taking place in the precious metals markets. The central thesis of this argument rested on the changes in investor inflow activity that were becoming visible in several important exchange-traded funds tracking the underlying prices of gold and silver.
However, the bullish argument went even deeper than this when viewing the market based on changes in the fundamental outlook. Remember, the summer period was characterized largely by significant surprises in stock volatility. Of course, this type of volatility is not generally expected during the summer. But this divergence from historical expectations led me to believe that a paradigm shift was unfolding from a macroeconomic perspective and that the precious metals complex was likely to be the primary beneficiary of these emerging changes in sentiment.
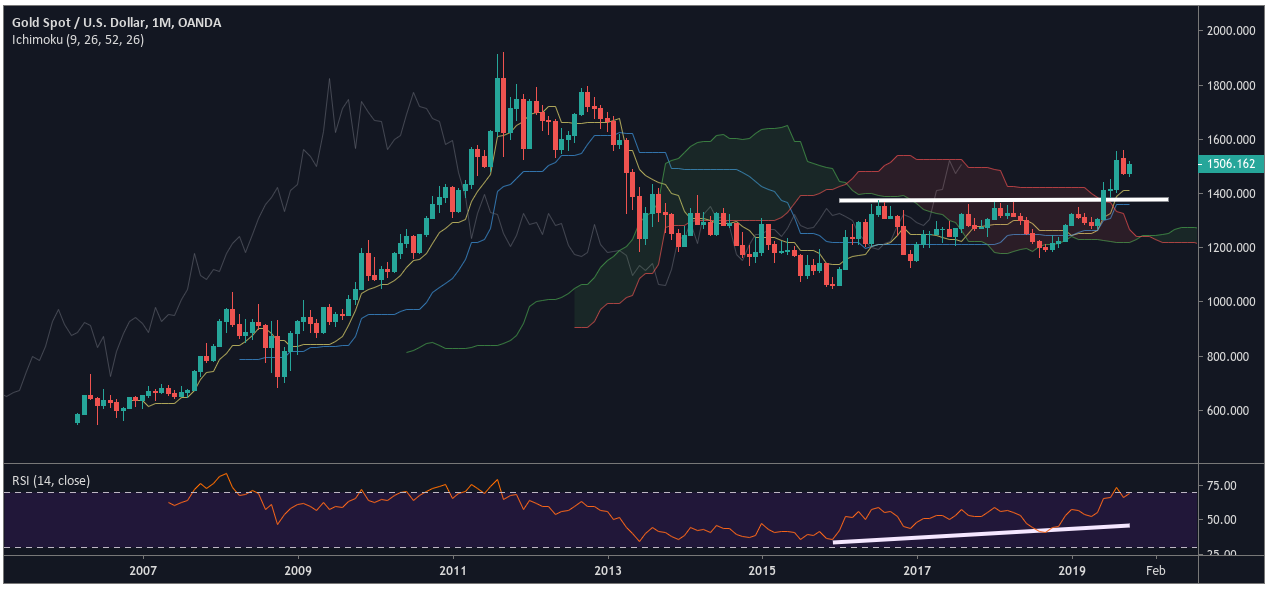
Looking at the GOLD/USD monthly chart, we can see that these forecasts turned out to be exceedingly accurate. The initial breakout came as prices overcame resistance at $1,346.70 (the highs from February 2019). From a technical price perspective, this area actually represented a double-top formation when viewed in conjunction with the highs from July 2016.
Interestingly, these recent events resulted in a bullish breakout where market activity during the summer of 2016 was essentially the beginning of a precious metals market breakdown. Eventually, the bear moves during the second half of 2016 send valuations in GOLD/USD to lows of $1,122.75 before bulls were able to generate anything resembling a real bounce in the yellow metal versus the greenback.
Now that the dominant trend has moved clearly into bullish territory, it’s time for precious metals investors to start looking for any evidence that the trend might be losing upward momentum. Under the rules of my Ichimoku trend reading system, removal of the bullish trading bias would require a clear break below $1,377.60. This is essentially where the highs from April 2018 rest and we can visualize a confluence of technical indicators which bring additional validity to this area of price support.
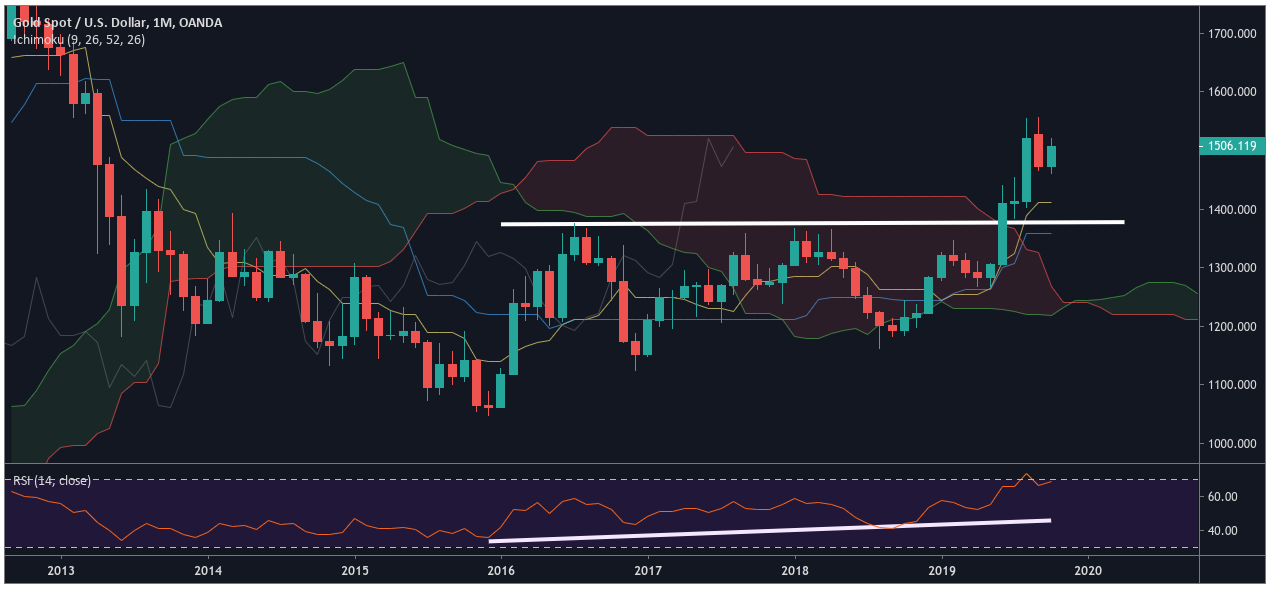
Specifically, the Ichimoku Conversion Line (Tenkan-Sen) has recently moved above our new support zone in a bullish cross relative to the Base Line (Kijun-Sen). Prices also moved above the Kumo in this price zone, so we would need to see a downside break of these readings in order to suggest the bull-run has completed. In this second price chart, we are zooming in closer using the monthly price charts in GOLD/USD, so that we can see a better view of these technical signals at work.
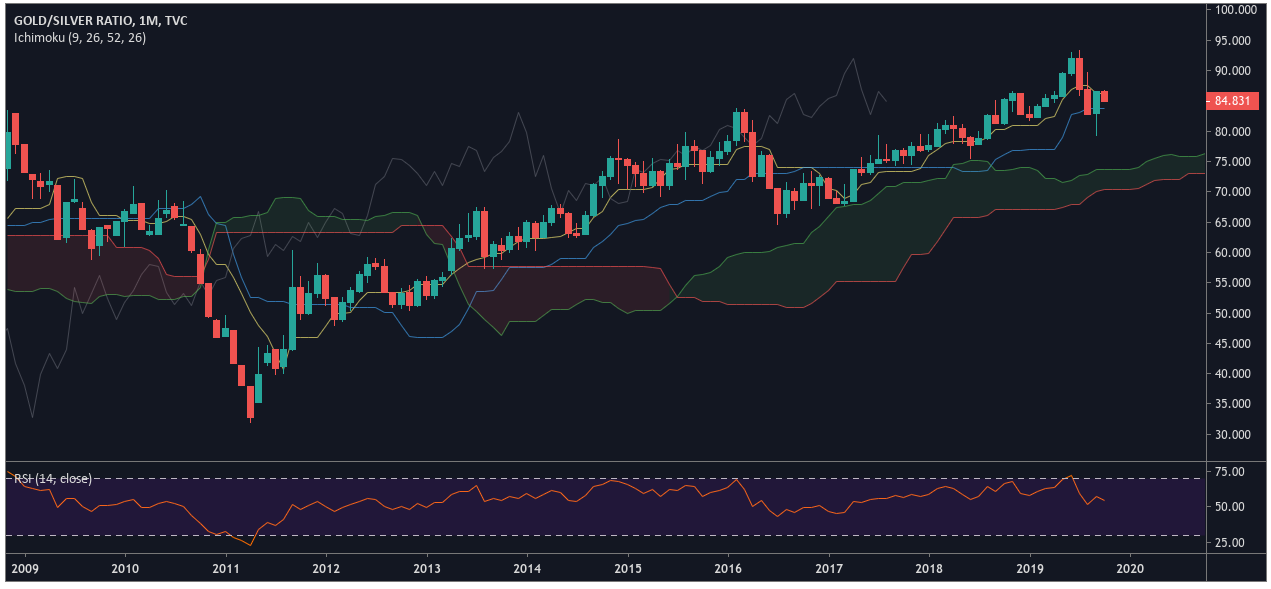
Finally, I think it’s important for traders to take a look at the strongly trending move that is currently visible in the monthly GOLD/SILVER ratio because this gives us a great idea of which metals are experiencing the strongest momentum readings. In the monthly Ichimoku GOLD/SILVER chart shown above, we can see that trend readings have held above the Kumo since the early parts of 2013.
For contrarian traders, this might be an excellent signal to start building exposure to assets that track the value of silver. However, there is still very little evidence in this chart which suggests the current price rallies are reaching a point of exhaustion. RSI readings are trading near mid-ranges and this suggests gold can continue to outperform silver for the time being. If we see the Conversion Line (Tenkan-Sen) cross below the Base Line (Kijun-Sen), it would give contrarian a better argument to begin initiating buy positions in silver assets.
All combined, the baseline trend for the precious metals complex remains strong and the underlying momentum supporting the asset class looks set to hold for the remainder of this year. Buying on downside price corrections is the preferred strategy…but this outlook remains valid as long as gold maintains its foothold near $1,380.
For more information on how I interpret the specific indicator readings discussed above, I encourage readers to review my Ichimoku Trading Tutorial for an in-depth explanation of how I conduct my analysis.
*********
More from Gold-Eagle


