GOLD: Bullion Vs. Shares
Many gold shares owners are pulling their hairs out every morning in front of their computers. "Those suckers just keep going down, and down, and down!"
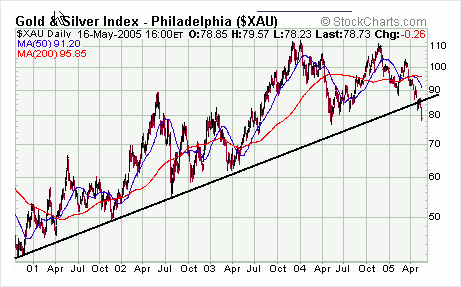
Most shares and indexes haven't seen new highs since late 2003, the XAU chart has just broken through its October 2000 uptrend support line, and the XAU's 200 day moving average has just turned down.

So, is it time to bail?
No. And that's a "No!!!" with a Capital "N" and a bunch of exclamation marks behind it to boot.
Why not?
Several reasons, and the most important one of them is that gold is still in its almost four year old uptrend and there is no end in sight, realistically speaking.
The first thing to remember about gold shares is: they are by their very nature "derivatives" of gold.
As much as gold investors may hate the sound of this (after all, "derivatives" is a dirty word in the gold world), it is still true. Gold shares are paper-derivatives of gold due to the mere fact that they are not gold itself. Period.
Is a derivative going to go down while its underlying asset keeps climbing?
Very doubtful - and that's an absolutely felonious understatement that should be punishable by drawing and quartering me and and feeding my remains to a horde of attention-craving, "deflation"-shrieking, bulgy-eyed gold-bears.
Gold will keep going up for the reasons outlined in What's Bugging Gold Bugs?
But there's more. Just today, we got additional evidence that this will happen: The TIC data from March show that foreign purchases of US treasuries have slowed dramatically, and that confirms the premise of The G-7 Effect: Selling Into Dollar Strength. Better yet, the Financial Times reports that foreign CBs were net sellers of US treasuries in March, for the first time since 2002.
It is no coincidence then that, as Ted Butler reports, the COTs for gold have never looked this bullish. He estimates that there is "a 100,000 net contract decline in the dealers' short position over the past three weeks through today."
Then, there is the XAU chart dating back to Gold's twenty-year low and double-bottom in 2001. You can see that the gold chart (the red chart line, NOT the red arrow) acts very much like a firm support line for the wildly gyrating XAU:

- and that confirms that all the wild emotions (of mainly Western gold investors) are being played out in the XAU while the calmer heads (of the Chinese, Muslims, and Indians) are reflected in what gold is doing. Every single time the XAU has touched the gold line since 2002, it has bounced off rather strongly.
This chart also demonstrates something gold investors often get tripped up on: It shows demonstrably that just because a chart breaks down, that emphatically doesn't mean that the gold shares are "doomed" to suffer another gut-wrenching pull-back.
Take a look at the first triangle formation in 2002-2003 and how far the XAU "broke down" from that one - right before making its big up-move (red arrow) to its highest high since 1999.
Granted, the current breakout to the bottom goes deeper than the one in 2003 - but so what? The point is that it's always fundamentals that drive charts. It's never charts that drive fundamentals -- and fundamentals are very bullish right now so relax, already!
But back to the apparent support function of the gold chart to the XAU. Naturally, that chart only acts as a quasi-support line if you take a performance comparison dating from precisely the time of gold's lows in 2001 and using that as the "zero" point from which both lines emerge. That's the nature of a performance chart - its results change depending on the time-point of reference. But it's very interesting nevertheless, precisely because that relationship has held true for almost four years now, ever since 2001 - without exception!
The other thing is that price inflation is on the rise (today's "flat" reading notwithstanding), and that's bad for stocks because the Fed will respond with higher interest rates, which will crimp business budgets and profit margins, and therefore stock valuations. It's also bad for bonds (fixed income paper is worth less in a declining purchasing-power environment).
When American and international investors see both stocks and bonds go south - where will they turn?
You got it.
Once the "safe haven" debt papers are going down together with the "risky" equities, especially now that derivative-crazed hedge funds are looking more and more like something Muslim suicide bombers might want to pad their vests with, and now that real estate is beginning to look toppy (especially with soon to be strongly rising long term rates), where are people going to spend their FRNs?
On gold and gold stocks - and on silver, of course.
And then ... there's China.
China has blatantly been jerking the US' chain of late, throwing several head-fakes by leaking unofficial indications of a coming revaluation - and then denying the same from official sources. Once this flurry of head-fakes has sufficiently confused and enraged the US-opponent(and today's escalation of Bush's rhetoric shows that it has), they will be followed by an agonizing groin shot at precisely the most opportune moment. You can bet your life on that. When that happens, the dollar will drop like a leaden balloon.
As to precisely when this will happen, your guess is as good as mine -- but as an owner of bullion you are not forced to time these events precisely in order to come out ahead. That's why the real question is not whether you should get out of stocks, but whether you should get into real gold. And the answer to that one is a resounding "Yes."
Got gold?
May 19, 2005
Alex Wallenwein
Editor, Publisher
www.a1-guide-to-gold-investments.com
Free Report: [email protected]


