Gold Continues To Drift Lower As Traders Favor Risk-On Assets And Dollar Strength
 share
share
 share
share
 share
share
 share
share
 share
share
Gold futures continued to drift lower yeterday, continuing the sharp decline that traders witnessed on Monday of this week. Although yesterday gold was able to recover slightly gaining $18 off of Monday sharp selloff, today traders took gold pricing back to erase those advances made on Tuesday. As of 4:55 PM EST, the most active December contract is currently fixed at $1863.50 which is a net decline of $12.90 on the day. Considering that gold futures opened at $1956 on Monday, the cumulative damage over the last three days have been almost $100 decline per ounce.
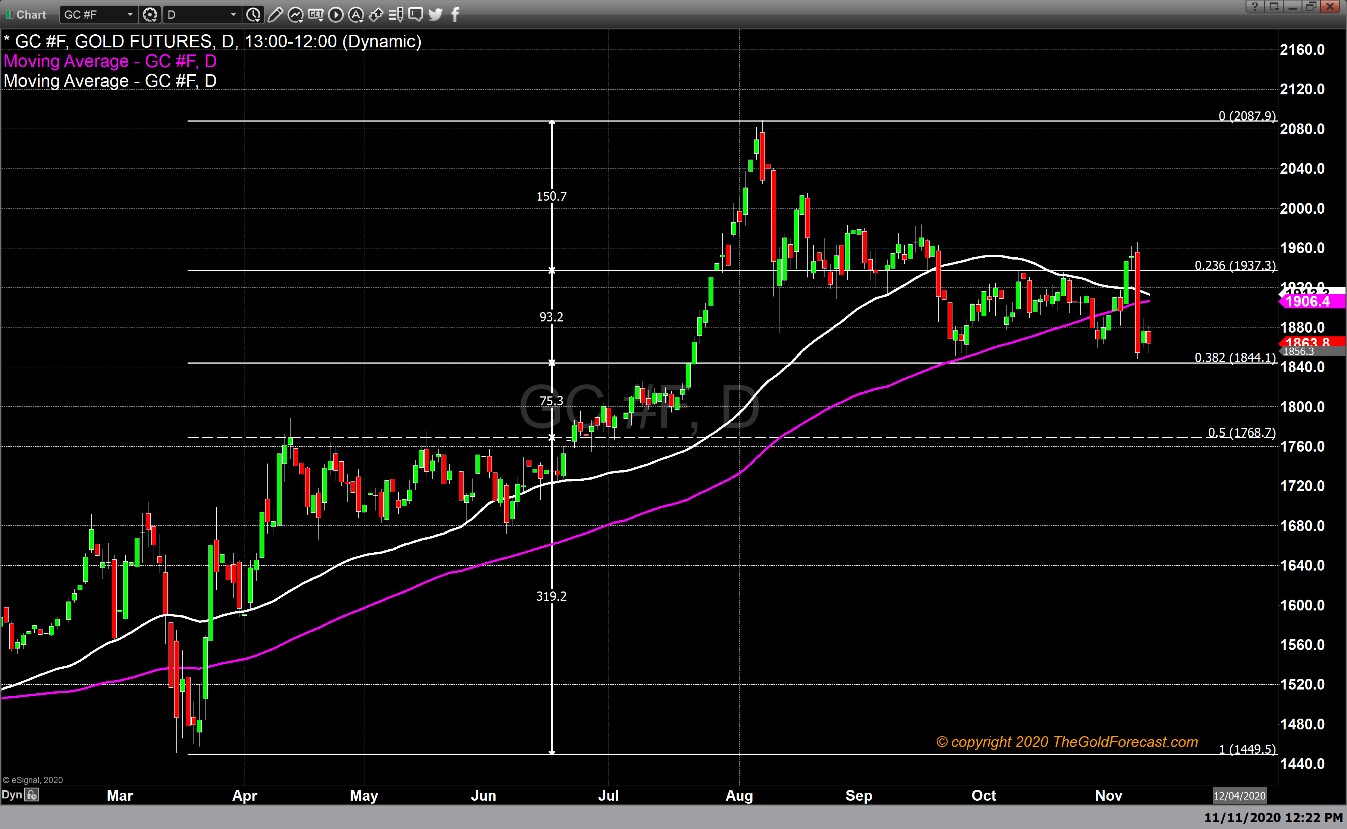
A combination of strong U.S. equities (risk-on) performance, dollar strength, and modestly higher bond yields have all dampened the bullish market sentiment in the precious metals. Ever since the first week of August when gold futures reached a new record high price at $2088, gold prices have been steadily forming a series of lower highs and occasional lower lows.
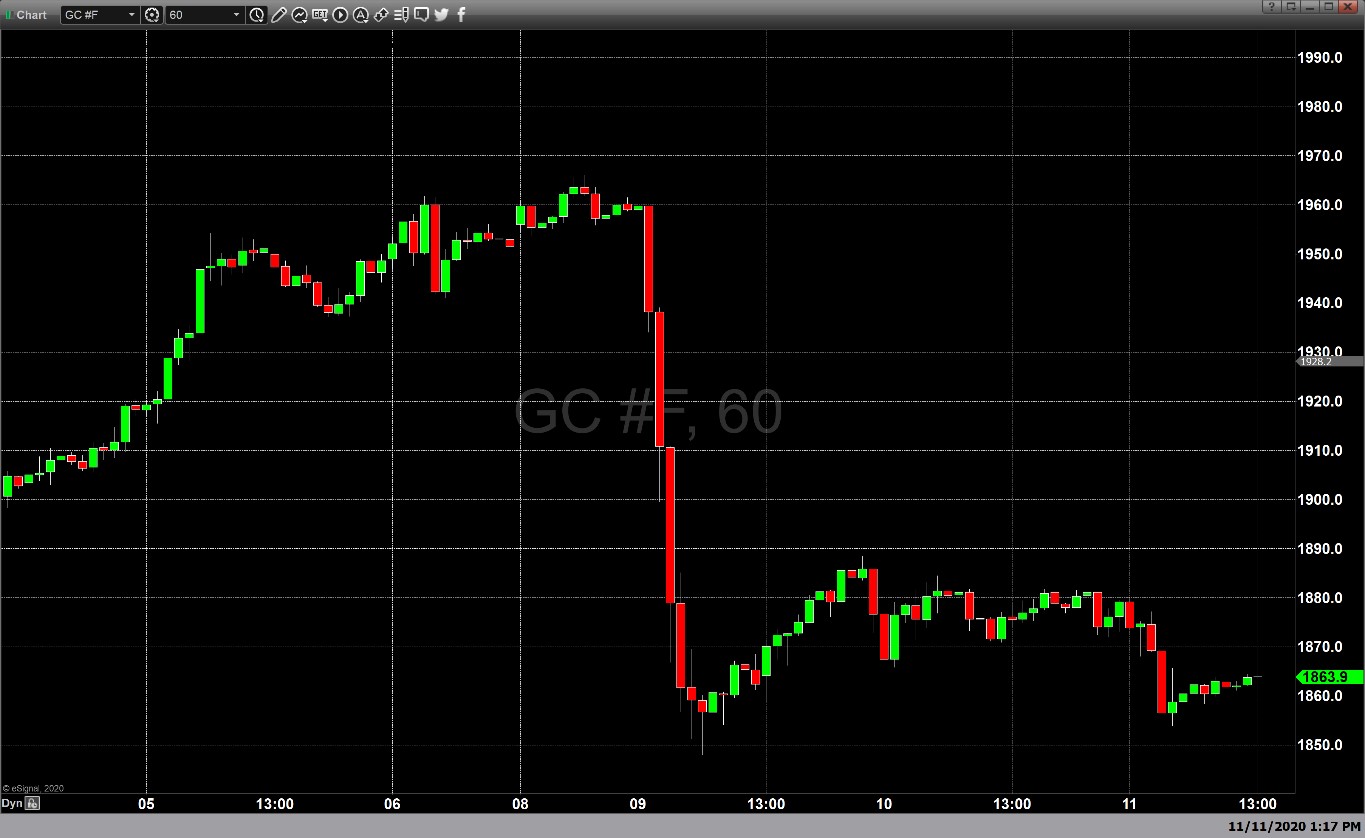
The only upside spike since the record high was reached occurred on Monday, November 9, when market forces took gold futures briefly above $1960 per ounce. That price could not be sustained even for a day as market participants aggressively sold gold and silver after Pfizer pharmaceutical announced that they had completed their stage III trials with a 90% efficacy rate.
The announcement took gold $110 lower from the highs achieved to close near the absolute bottom of the range at $1854. The last time gold closed at that particular price point ($1854) occurred on the week of September 5, 2011. Gold it hit its former record high of $1920 roughly 2 weeks before that. The similarity is eerily foreboding to recent action.
Our technical studies indicate that there is strong support for gold at the 38.2% Fibonacci retracement level which occurs at $1844. This retracement uses a data set that begins in the middle of March when gold traded to a low of $1415 up to the new record high which occurred during the first week of August at $2088. Our technical studies also indicate that there is a decent probability that the lows of $1850 will hold and continue to be a major support. However, a break below that price point could take gold to as low as $1768 per ounce which is the 50% retracement from the same data set.
Major resistance continues to be found at the 23.6% retracement level which occurs at $1937. With minor resistance at the 50-day moving average at $1913 and the 100-day moving average which occurs at $1906.
Until some news emerges that clarifies when and how much Fiscal stimulus will be allocated, we could see gold trade in a range between the support and resistance level mentioned above.
Gary Wagner is a Kitco Contributing Analyst.
********
share
share
share
share
share


