Gold Demand Remains Stable During Sector Weakness


My favorite indicator for real time gold demand is the amount of gold in the SPDR gold Shares ETF (NYSE:GLD) and its fluctuations over time. As we wrote in our book, the driving force for gold is investment demand, which is driven by changes in real interest rates. Western-based investment demand from big money (i.e. Stan Druckenmiller and George Soros) shows up mostly in the ETFs and specifically, GLD. The amount of gold in GLD has risen steadily even as gold consolidated a few months back and has been stable in recent weeks even as gold and gold stocks correct their Brexit breakouts.
The chart below includes the price of gold, the amount of gold in GLD (bottom) and the rolling quarterly change in the amount of gold in GLD. Even as gold consolidated for several months in the spring, the amount of gold in GLD increased.
Over the past few weeks gold has retreated by $65/oz, yet GLD has only lost 2% of its gold. Moreover, note that the recent demand surge (quarterly change) is the second strongest of the past 10 years.
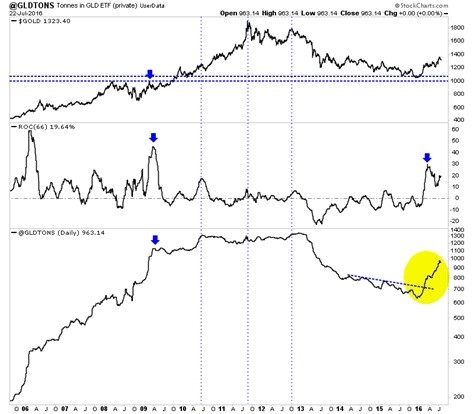
Tonnes of gold in GLD Trust
Note how strong demand for gold was from 2006 to the middle of 2010. Even though gold corrected 30% during the financial crisis, GLD only experienced minor outflows of gold. After gold bottomed in October 2008, demand exploded.
Interestingly, demand peaked in the middle of 2010 and went sideways for a few years before succumbing to the bear market. That lack of strong demand in 2011 while gold surged, in hindsight was a warning sign.
In short, this data (amount of gold in GLD) can be somewhat of a leading indicator for the sector. It has been in the past and it has worked well so far this year. Unless we see huge outflows from the GLD then there isn’t much reason to be concerned with the current correction in gold and gold stocks.
Turning to the technicals, we find that gold appears headed for a test of support at $1275 to $1300. That would be a retest of the area from which gold exploded in the wake of Brexit. It also marks previous resistance. Gold’s primary trend remains bullish as it holds comfortably above key long-term moving averages shown in the chart (which are equivalent to the 20-month and 40-month moving averages).
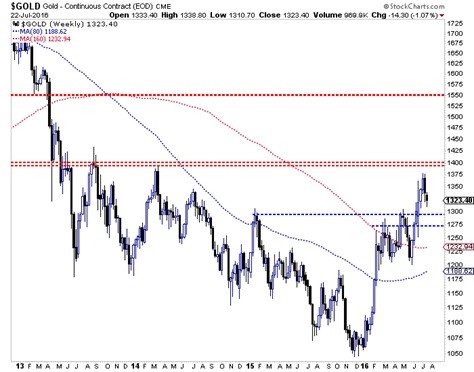
Gold Weekly 2013-2016
Like gold, the gold miners (via VanEck Vectors Gold Miners (NYSE:GDX) and junior gold stocks (via VanEck Vectors Junior Gold Miners (NYSE:GDXJ) could be retesting their Brexit breakout. The stocks may be forming a bear flag (yellow) which would lead to another move lower. If that plays out, then look for a test of the support points shown, including the 50-day moving averages.
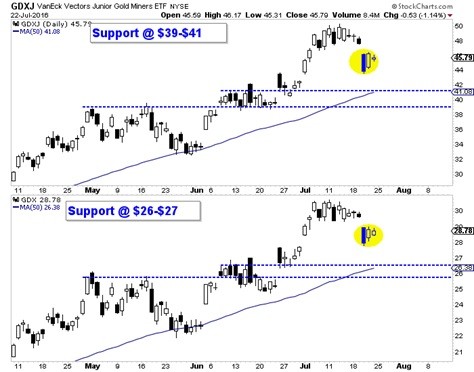
GDX: GDXJ Daily
While gold and gold shares are correcting now, the real time data coming from GLD suggests gold demand is and should remain firm. Traders and investors are advised to monitor flows in and out of GLD in order to keep tabs on real time investment demand for gold. This is one of the many things we monitor to stay in tune with market trends. The short-term trend is down and further weakness would bring about a good buying opportunity in select companies.

Jordan Roy-Byrne, CMT is a Chartered Market Technician and member of the Market Technicians Association. He is the publisher and editor of TheDailyGold Premium, a publication which emphasizes market timing and stock selection, as well as TheDailyGold Global, an add-on service for subscribers which covers global capital markets. He is also the author of the 2015 book, The Coming Renewal of Gold’s Secular Bull Market which is available for free. TheDailyGold.com was recently named one of the top 50 Investment Blogs by DailyReckoning and WalletHub.


