Gold To Fall To 1600 Before Rising To 1800


Last Monday's mail bag brought with it the following question from an esteemed member of our Investors Roundtable with respect to Gold, especially given the recent leveraged strength amongst leading precious metals equities as we'd portrayed a week ago: "Mark, is the correction over?"
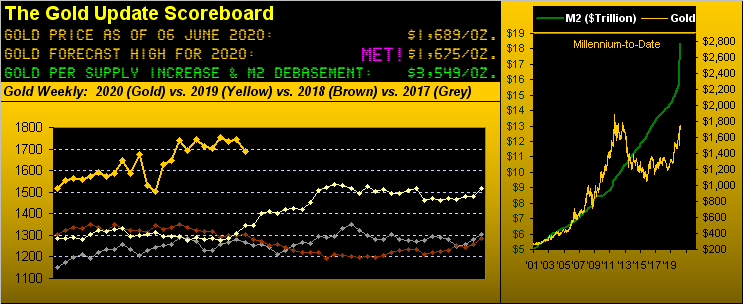
Our immediate thought was "What correction?" But upon further review given all the collegial hype over the COVID currency debasement that Gold ought by now have left the planet, we then thought that alone makes it feel like price has been in a "correction." Indeed per the above Gold Scoreboard we value Gold today by debasement alone at 3549 rather than at yesterday's (Friday's) weekly settle at 1689.
'Course, we've duly pointed out these recent months Gold's challenge to penetrate The Northern Front (1750-1800), the resistance forces therein having foiled price's attempted breakthrough now for a fourth time. And lest we forget, Gold has had a pretty solid run year-to-date (at present +11.1%) to as much as +17.7%, when it traded 100 points above present price in the thick of battle at 1789 back on 14 April.
"Correction" indeed, however we nonetheless responded verbatim as follows per Gold's stance; again this was penned last Monday (01 June):
"With respect to the “correction”, I ‘spect ‘tis all in the eye of the analyst. Here’s the present picture from our purview, specific to the price of Gold:
■ The 21-day linear regression trend is up, (10 days in duration);
■ The weekly parabolic trend is up, (10 weeks in duration);
■ The price year-to-date is +15%;
■ The year-over-year weekly trend is up.
Given all that, to be sure, Gold’s price is nonetheless practically net “unch” from those April dates noted in The Gold Update, or one might say “unch” within an overall upside bias.
More curiously, however, is the fact that Gold has not already moved up through 1800 and beyond. If that doesn’t occur right quick with some fundamental push, those technical trends in the order listed shall start rotating from positive to negative. ‘Tis what markets do when left to the technicals upon the fundamentals lacking interest."
And now that last paragraph has begun to pan out, indeed "right quick." With utter disregard from the fundamental side of the aisle, the technical side has taken over, beginning with the 21-day linear regression trend having since rotated from positive to negative. The following animated image depicts from this time a week ago that rotation of the grey trendline across Gold's daily bars in this moving 21-day view:

"But mmb, it seems nuts that Gold hasn't gone up!"
So 'twould seem, Squire, however nuts do not fare well upon being hurled against a concrete wall of resistance as is The Northern Front. But before we all go nuts in denial, let's add a bit of perspective with specific regard to all the recent currency creation.
"Oh it's the Weimar Republic!" they say, "Where's my wheelbarrow?" "Oh it's the Argentine monetary crisis!" they say. "Oh we're becoming Venezuela!" they say. "Oh it's Zimbabwe, we're on our way!" Fortunately, 'tisn't anything (at least yet) like those entities' monetary and fiscal fiascos. Toward responding to COVID, the comparative debasing of the U.S. money supply hasn't increased it by 100%, let alone by 1000%, nor parabolically by ∞%.
Rather, since accelerating as of 13 March the spinning of the U.S. Treasury's printing tumblers and Federal Reserve Bank's ledger entries, as measured by "M2" the U.S. money supply is +14.4%. In a similar vein, the price of Gold since that same date has risen by as much at +17.0%. ("Oooh ... maybe Gold did go up too much...")
A cure retort, perhaps, but rather vapid given how broadly undervalued Gold is priced today. The point is: the stance of the StateSide and predominant "G" nations currency debasing has yet to formally convert them to banana republic status. 'Course when one considers all the elements of the 3Ds --- Debasement, Debt and Derivatives --- 'tis prudent not to get too cocky out there ... just sayin' ...
"So mmb, if these trends you say are "rotating" to negative, how low does Gold go?"
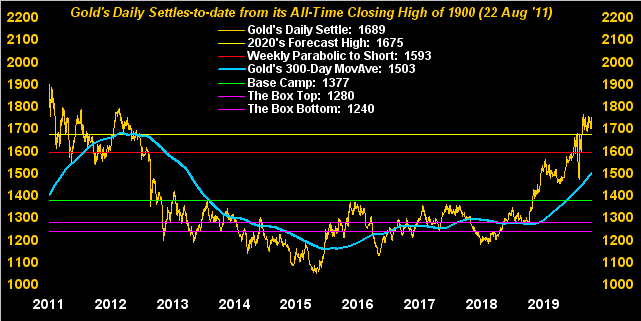
Gold traded this past week to as low as 1672, Squire. By our modest analytical read, should 1666 bust, then we'd expect to see 1638. But sub-1620 would in turn open the downside door for a test of the April Fools' Day low of 1576. And that by simple arithmetic means Gold trading at 1600 before 1800.
Either way, let's see what we can glean per Gold's weekly bars from one year ago-to-date. Therein we see the ascending blue dots of parabolic Long trend now 11 weeks in duration, matching the total duration the prior Long trend. But of concern is Gold's weekly settle (per the rightmost bar's nub) being the first one below the present slope of the dashed regression trendline after nine consecutive weekly closes above it. As for our 2020 forecast high line of 1675 which had been practically spot on pre-COVID, it since has morphed from resistance into support. But there's little room left for wiggle there, especially given Gold's expected weekly trading range is at present 91 points, (the expected daily trading range alone being 31 points):
As for Gold vis-à-vis its iconic multi-year supportive -- then multi-year resistive -- then multi-year centerpiece -- now once again supportive 300-day moving average, you may recall it having been suggested a month ago that price had strayed too far above said average. To save you the rigors of both the mathematics and eye strain in turning to Gold's daily closes since the highest ever back in 2011, price's present deviation from the average in either direction ranks in the 13th percentile (which for you WestPalmBeachers down there is really high) across the past 20 years ... just in case yer scorin' at home, (and/or are wont to "buy high"):
To buy low would seem the better way to go when it comes to the Econ Baro. But already the anticipative S&P 500 has risen high to the sky. In the midst of COVID, the S&P found itself on 23 March down as much as 35% (at 2192) from its all-time high (at 3394) that had printed just 24 sessions earlier on 19 February: today at 3194, 'tis down a comparatively wee 6%. Yes, there's our pet peeve that the "live" never-finmedia-revealed price/earnings ratio is an annoyingly high 37.5x; but when 1.7% is all you can get for 30-year Treasury dough -- down to near-term essentially zero -- ignorance is bliss in the stock market sand pit.
And as we look below at the Economic Barometer replete with its rather stalwart new "W", we were as caught off base yesterday as were the masses by the StateSide Payrolls creation for May of 2.5 million: our Prescient Commentary penned earlier that morning expected "what clearly shall be a horrid Payrolls report for May", later footnoting the actual result in red font. Indeed when the report hit the wires, we initially thought to notify the source that they'd left out the minus sign ("-") in front of the number, only to swiftly concur 'twas a plus sign ("+"). But bear in mind: since the onset of COVID, the Payrolls data metric has been extremely volatile, so much so that it wouldn't surprise us a wit to see the May number materially revised come the June report due 02 July. Meanwhile, here's the year-over-year Baro (blue) and S&P (red):
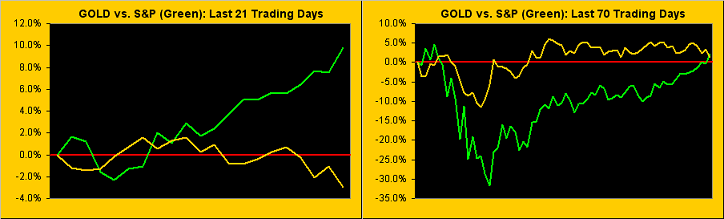
Next let's briefly address the near-term negative correlation between Gold and the S&P in the following two-panel graphic. Such correlation is obvious in the left-hand panel of the two markets' respective percentage tracks for the past month (21 days). But in discussing their correlation yesterday with a trading colleague, we pointed out that -- more broadly -- both Gold and the S&P are positively-correlated, as the rising tide of inflation (even such as it presently isn't per The Bureau of Labor Statistics) lifts all boats. For in viewing the right-hand panel from late February-to-date (70 trading days), both markets are up the like percentage amount:
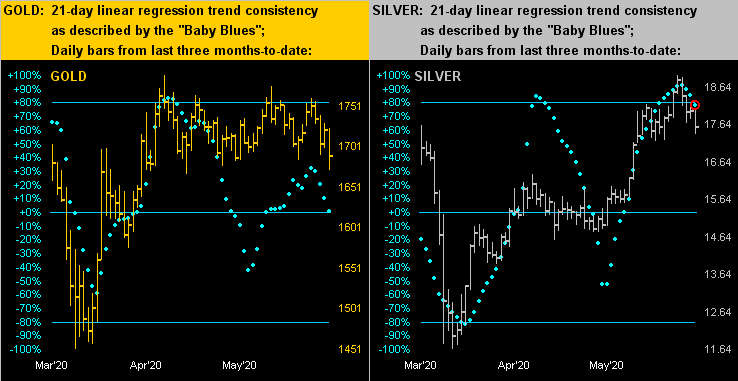
Earlier above in the animated image of Gold's negatively rotating trendline, 'twas across the most recent 21 trading days. Now here's our more familiar three-month view for Gold on the left and Silver on the right. And should Gold be technically weakening given the aforementioned lack of fundamental interest, then Sister Silver requires wearing the full racing safety harness. Notice her rightmost red encircled baby blue dot: it has slipped beneath the critical +80% horizontal axis, suggestive of lower levels ahead. And should Gold let go, Silver's really gonna go. She settled this past week at 17.57: should the "Baby Blues" rule (rather than their exception) play out, down to at least 16.30 ought be Sister's rout:
Indeed in turning to the 10-day Market Profiles for both Gold (at left) and Silver (at right), both markets are sitting just above their last bastions of near-term trading support, denoted for Gold at 1684 and for Silver at 17.50:

In sum, given said lack of fundamental interest, we're a bit technically bearish for Gold near-term; hence our sense for 1600 before 1800. To be sure, again the precious metals have had quite a good run, certainly aided by the debasing response to COVID, StateSide anarchy, and just good old common sense given the metals' overall low valuations. And yet in this "Era of Ever-Wrong Experts" be they about COVID as told, or the economy sold, or America rolled, stay the course with your Gold!
www.deMeadville.com
www.TheGoldUpdate.com
********

Mark Mead Baillie has had an extensive business career beginning in banking and financial services for two years with Banque Nationale de Paris to corporate research for three years at Barclays Bank and then for six years as an analyst and corporate lender with Société Générale.
For the last 22 years he has expanded his financial expertise by creating his own financial services company, de Meadville International, which comprehensively follows his BEGOS complex of markets (Bond/Euro/Gold/Oil/S&P) and the trading of the futures therein. He is recognized within the financial community of demonstrating creative technical skills that surpass industry standards toward making highly informed market assessments and his work is featured in Merrill Lynch Wealth Management client presentations. He has adapted such skills into becoming the popular author each week of the prolific “The Gold Update” and is known in the financial website community as “mmb” and “deMeadville”.
Mr. Baillie holds a BS in Business from the University of Southern California and an MBA in Finance from Golden Gate University.


