Gold Finally Moves...But The Wrong Way!!
 share
share
 share
share
 share
share
 share
share
 share
share
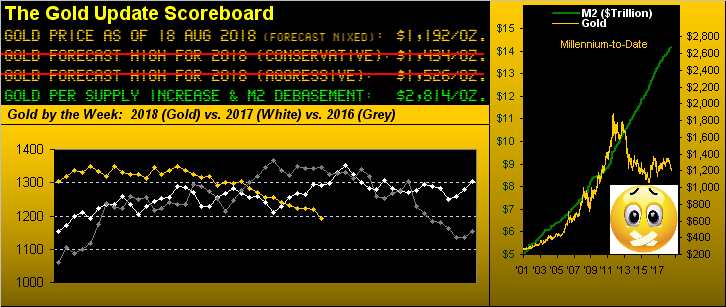
So much for the "immovable object", eh? Oh, the yellow metal finally got off its butt alright: but without noticing that a dastardly team of Shorts had snuck in this past week and tied together gold's shoelaces such that it fell flat on its face. Leaving the 1200s in the lurch, price tumbled to as low as 1167, a level not traded since 05 January a year ago. And as a calculative courtesy to those of you lucky enough to be scoring at home, back on that day some 20 months ago the "M2" money supply of the United States was $13.24 trillion: today 'tis $14.17 trillion, an increase of 7.02%. In the pure vacuum of gold's supposed positive correlation with M2 (per the above right panel of the scoreboard), that would put price right now at 1249 ... 'cept that back on 05 January 2017 gold "ought already have been" at 2688! And as you can see "ought" today be 2814! ... 'cept that gold settled out the week yesterday (Friday) at 1192. Really.
"But mmb, you always say the market is never wrong..."
True enough, Sir Squire: price is what 'tis. But you know, and I know, and all of our readers from Sheboygan to Shanghai know, that market valuations can drastically deviate from their "ought be" levels. Look at present stock market indices' sky-high prices versus their constituents' earnings, (or lack thereof): that is far more worrisome than is gold's lowly price. For as the past forty years have proven, stock markets this lofty have always crashed, and beaten-down gold has always robustly recovered, the latter obviously having yet to occur as we next see in the weekly bars; and note therein the inferred slamming of Sister Silver as gold's ratio to her price has climbed back above the rarified rank of 80x:

Speaking of correlation, 'tis positive between gold's fallouts and incoming email. Here are a few phrases received this past week: "I wait for gold to turn around" ... "Is this the capitulation" ... "Where's the support, $500/oz.?"
'Course in the mix comes the "dollar strength" argument, to which we say "piffle". The Dollar Index settled Friday at 96.020. Let's return to better than a year ago on 27 June 2017: the Dollar Index that day settled at nearly the same level: 96.180; and gold that day settled at 1245. Oops. Time for the shoelace tyers take it in the Shorts, what?
That said, the time-honoured axiom of the trend being one's friend shows quite stark: here next is the present "Rhythm Performance Chart" for gold. The technical study is the standardized "Price Oscillator" (an exponential averages subtraction as defined at the website) and the track is gold's daily closes from over three years ago-to-date. When the Price Oscillator is positive gold's line is green, else red if negative. 'Tis not as easy to trade as it looks, which is why we always emphasize that being correct about direction comes second to prudent cash management. Moreover as long-time readers know, we believe being Short gold is a bad idea. But don't tell that to the rightmost shoelace tyers:
With further respect (or perhaps disrespect) to having one's shoelaces tied together, we found it interesting that the Conference Board's July growth in Leading Indicators rose to +0.6% from +0.5% in June, itself an increase from +0.2% in May. The Economic Barometer clearly belies that. But then again, cross-currents are running amok these days. For example, the New York State Empire Index just came in with an August reading of 25.6, up from 22.6 in July ... but the Philadelphia Fed Index recorded just an 11.9 August reading, down from 25.7 in July. Retail Sales growth improved for July ... however Industrial Production dropped decidedly. What's all that to do with one's confidence? Ask the University of Michigan: their initial "Sentiment" survey reading for August just fell from July's 97.9 to 95.3, such level having not been above the vaunted "100" mark since March. Consider too the scrutineers over at PIMCO having written this past week that "At this stage in the cycle, investors should consider inflation risk, market dispersion, recession risk and other key factors ... While recession indicators are not flashing a red warning signal that a downturn is imminent ... they are flashing a yellow 'caution' signal." No kiddin'. Here's the Baro:
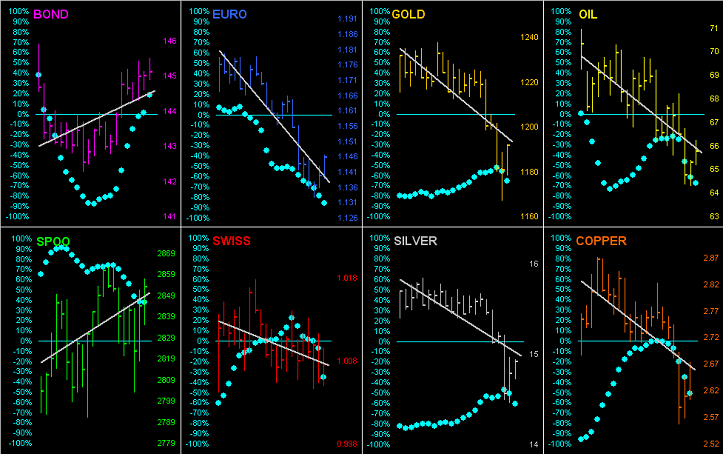
As for near-term trend, gold is far from being alone to the downside, again being treated as nothing more than some podunk-town factory material. Below we go 'round the horn for all eight of the BEGOS Markets across their last 21 trading days (one month), the baby blue dots indicative of each grey trendline's consistency. Only the Bond and the S&P 500 ("SPOO") are in uptrends:
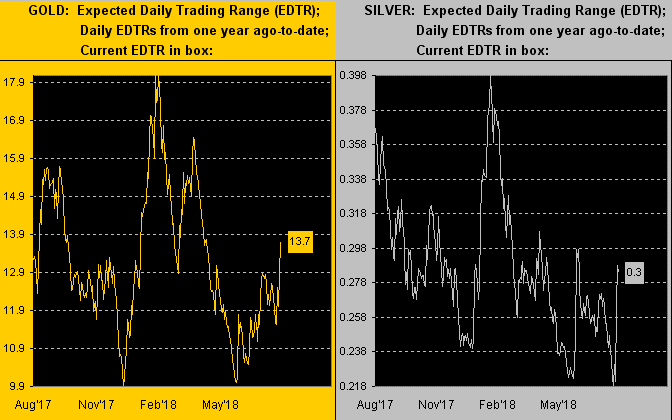
Still, with the fallout of late in the precious metals, their trading volatility is ramping up. Here next from one year ago-to-date are the Expected Daily Trading Ranges ("EDTR") for gold on the left and Silver on the right. Again, this is not market direction; rather 'tis the distance we "expect" to see between each ensuing trading session's high and low, (as always to be over-ridden by the aforementioned prudent cash management):
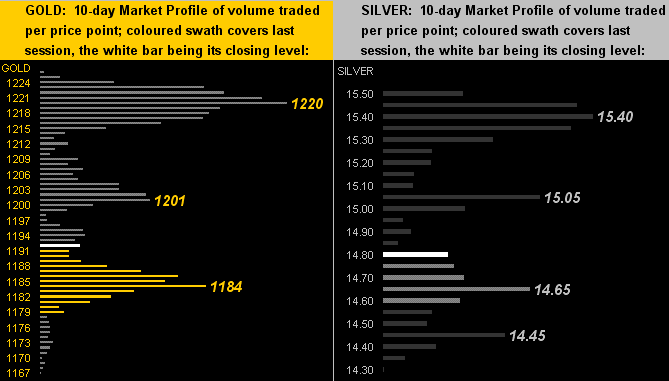
Finally, to the 10-Day Market Profiles we go for gold (left) and silver (right). And for both markets, how stark show the depicted levels of highest trading volume:
The foregoing thus all falls ("Ouch!") to the stack:
The Gold Stack
Gold's Value per Dollar Debasement, (from our opening "Scoreboard"): 2814
Gold’s All-Time High: 1923 (06 September 2011)
The Gateway to 2000: 1900+
Gold’s All-Time Closing High: 1900 (22 August 2011)
The Final Frontier: 1800-1900
The Northern Front: 1750-1800
On Maneuvers: 1579-1750
The Floor: 1466-1579
Le Sous-sol: Sub-1466
Base Camp: 1377
2018's High: 1369 (11 April)
The 1360s Double-Top: (1362 in Sep '17 and 1369 in Apr '18)
Neverland: The Whiny 1290s
The 300-Day Moving Average: 1289 and falling
The Box: 1280-1240
The Weekly Parabolic Price to flip Long: 1235
10-Session “volume-weighted” average price magnet: 1205
Trading Resistance: 1201 / 1220
Gold Currently: 1192, (expected daily trading range ["EDTR"]: 14 points)
Trading Support: 1184
10-Session directional range: down to 1167 (from 1226) = -59 points or -4.8%
2018's Low: 1167 (16 August)
Heading ever deeper into August's Dog Days, we've these three parting notes for this week:
■ One David Carruthers at a firm called Credit Benchmark notes that European bank contagion concerns from Turkey's currency collapse are overblown. But apparently not so in the trading pits: one Tolga Kırbaya at our old haunt of Barclays is facing a £15 million loss from trading Turkish corporate bonds. ("Ouch!")
■ Our own Federal Reserve Bank here in San Francisco crunched the numbers and found that the 2008 Black Swan catalysts 'round out to a cost per American of $70,000. Nuff said. ("Ouch!")
■ Q2 Earnings Season has come to its conclusion. Of the 437 S&P 500 companies reporting within said "season", 85% of them improved their bottom lines from the like period in 2017. Not really newsworthy, that, given the reduction in the corporate income tax rate. But as alluded to earlier, our "live" price/earnings ratio for the S&P presently is 49.7x. ("Ouch!")
And goodness only knows what's 'round the next bend. Indeed, wrong-way Gold never looked so good!
share
share
share
share
share

Mark Mead Baillie has had an extensive business career beginning in banking and financial services for two years with Banque Nationale de Paris to corporate research for three years at Barclays Bank and then for six years as an analyst and corporate lender with Société Générale.
For the last 22 years he has expanded his financial expertise by creating his own financial services company, de Meadville International, which comprehensively follows his BEGOS complex of markets (Bond/Euro/Gold/Oil/S&P) and the trading of the futures therein. He is recognized within the financial community of demonstrating creative technical skills that surpass industry standards toward making highly informed market assessments and his work is featured in Merrill Lynch Wealth Management client presentations. He has adapted such skills into becoming the popular author each week of the prolific “The Gold Update” and is known in the financial website community as “mmb” and “deMeadville”.
Mr. Baillie holds a BS in Business from the University of Southern California and an MBA in Finance from Golden Gate University.


