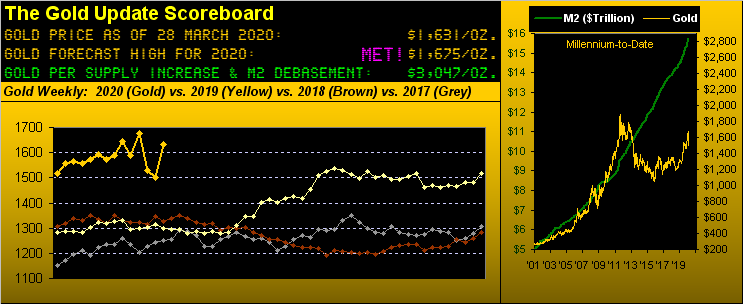
Gold Foiled In Its Fourth Foray For 1700


If one were told that Gold:
■ recorded its "largest-ever" points up-change for a single trading day, (+109 on 24 March), and further that it...
■ recorded its "largest-ever" points up-change from low-to-high across two consecutive trading days (+214, 23-24 March), but that...
one was not actually cognizant of Gold's price, one would have doubtless thought that Gold had embarked on a significant upside price breakout.
To be sure, those two combined runs were impressive, the one-day net change by percentage (+7.0%) ranking tenth best and the two-day low-to-high change by percentage (+14.4%) ranking seventh best as both measured since at least 1975, (Nixon having nixed the Dollar's Gold Standard in 1971, and the government come 1976 ditching any Dollar-defined references to Gold).
'Course -- (and you regular readers know darn well what's coming here) -- once again we've the quintessential case of change as the illusion versus price as the truth. Here in context is what really happened:
For the fourth substantive occurrence in the past five weeks, Gold made material changes (illusions) --indeed both up and down -- only to fail as it has time and again in nearing the same price (truth) round number of 1700.
In fact, after achieving the above Gold Scoreboard's forecast high of 1675 on 24 February, price in the ensuing 24 trading sessions has only been above that level on six days, and has only closed above it once (1681, 09 March), which is the same day price breached 1700 to just briefly see 1704. That's it.
Moreover, throughout all of Gold's machinations year-to-date -- up as much as +12.1% and down as much as -4.5% -- such thrashing about and settling out the week yesterday (Friday) at 1631 finds Gold today +7.3% net so far in 2020. That ranks second only to the price change in the interest-less Bond (+16.1%) as, with but two trading days left in the month as well as in Q1, we present our BEGOS Markets standings. Clearly they are safe-haven dominated per the gainers, and economically obliterated per the losers.

Oil obviously is the big "slaughteree", however query: given the 60 trading days thus far this year, has there ever been a like period wherein Oil has sported a net loss of -64.3%? Oh yes: 'twas within the carnage of the prior Black Swan when twice (in overlapping 60-day stints) the price of Oil fell respectively -65.7% and -64.9%; so been there, done that. Still, nothing like a little Russo/Saudi Oil price spat, StateSide energy independence, and a dastardly global cold bug called COVID to make it all economically go wrong there.
But specific to Gold, and especially so given all the enormous monetary and fiscal stimuli being thrown sky-high, one ought feel quite justified in expecting price to have leapt far above its present levels into the uncharted territory of the 2000s. Why, the Scoreboard's valuation for 3049 hasn't even yet (with a tip of the cap to the St. Louis Fed) received the data effect of the pending money supply boost. Regardless, Gold keeps getting stuck at 1700, above which as we've herein documented across so many recent missives there is all that repelling, overhead structural pricing resistance. 'Tis just there, it ain't going away, and to defeat the Gold trading algorithms which right up through the 1700s are programmed to "Sell, Sell, Sell!" is gonna take the sovereigns and the bankers and the hedgies to "Buy Like Hell!"
Either way, in turning to Gold's weekly bars, we find price of late having gone in all ways: up, down, forward, backward, all within the context that from left-to-right, the dashed linear regression trendline in the below graphic continues to rise. But the young parabolic Short trend (to coin a NASCAR expression) "done blowed up!", having but survived two weeks of violent movement in both directions such as to see the flip price pipped at 1694 this past Tuesday, in turn starting a new parabolic Long trend as evidenced by the new rightmost encircled blue dot. Nothing like flipping to Long when right up against resistance:
"But this time, mmb, you've got all that money printing to make it go..."
And that, Squire, is the daunting point. Arguably in this electronic age of instantaneous market revaluation, Gold's price ought already have gone ... and way up at that. This stimulus stuff has been on the boil for weeks -- and Gold has responded -- but not overly to the upside upon which so many have expounded. The ebbing tide of the Black Swan has lowered all boats, just as it did in 2008/2009. Still, it reminds us of a stirring moment from the '67 film "In Like Flint" when Andrew Duggan turns to Lee J. Cobb and exasperatingly asks him: "Lloyd! Lloyd! Why am I here?" Why is Gold here at 1631? Because 'tis to where the entirety of all trading entities' bids and offers have put it. Note as well in the above graphic the four foiling arrows for failure at 1700. May they themselves be foiled! And so they shall in time: fundamentally sooner than later? Or technically later than sooner? Game on, what?
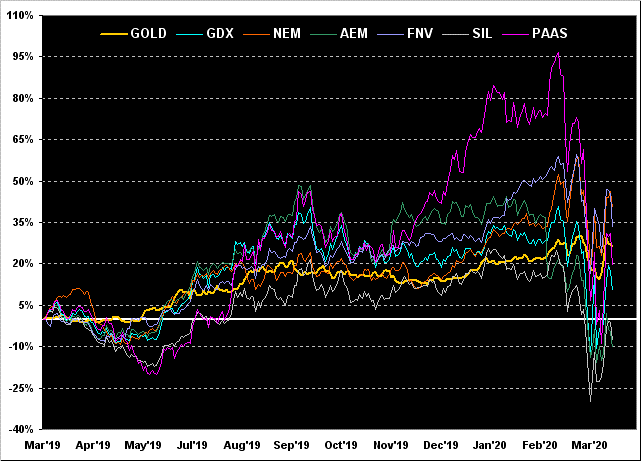
Also, it being nearly both month's and quarter's end, let's next go year-over-year with the percentage tracks of Gold accompanied by six of the venerable precious metals equities. And quite the ride 'tis been, Pan American Silver (PAAS) having practically doubled along the way before being fumbled away. From first to worst by net change vis-à-vis this time a year ago we've Newmont (NEM) +40%, Franco-Nevada (FNV) +33%, Gold itself +26%, the aforementioned PAAS +19%, the VanEck Vectors Gold Miners exchange-traded fund (GDX) +11%, the Global X Silver Miners exchange-traded fund (SIL) -8%, and Agnico Eagle Mines (AEM) -10%. Here's the whole gang:
On to the Economic Barometer we go, material inputs affected by so many business slowings or shutdowns StateSide as yet to work their way into the data. 'Course, we did get the massive Jobless Claims number for the week ending 21 March of some 3.3 million, the Baro itself not lurching off the bottom of its chart as such an untoward number was expected (consensus thereto being a key component of how the Baro is calculated); and such large number shall continue to be the case over the ensuing weeks. Data received in April and May ought have the Baro looking fairly terrible, notwithstanding stimulus efforts by the Federal Reserve Bank and policymakers. 'Tis interesting also to note that banks are sidling up to the oft ignored "discount window" in recently borrowing some $51 billion. Meanwhile, how's that negative return on your three-month dough working out for ya? The yield on the U.S. Treasury Bill (13-week) settled Friday at -0.058% . Meanwhile, here imminently we're goin' over the falls in a Baro:
As for the stock market per our favoured measure of the S&P 500 (red line in the above graphic), at right is as pleasing a "vee" as one may ever see; 'course, 'tis too early to really have a handle on the ultimate COVID-driven fallout for earnings and economics. But perhaps the S&P's Moneyflow has already given us a clue that the worst for the market within the context of COVID has already occurred, the S&P's lowest close of late being on 23 March at 2237; (Friday's settle being 2541). Here, at least within the Moneyflow vacuum, is why. Follows from the website is our two-panel chart of the cumulative points change in the S&P 500 from three months-ago-to-date along with the Index's Moneyflow as regressed into S&P points. At first glance, the two measures are fairly in sync with each other. But then look at the graphic's lower panel which is the Moneyflow's change relative to that of the S&P ... it bottomed back on 12 March:
And there are those bold enough to already be dipping their investing toes into wake of the Black Swan. To wit, with a foot out the door in running in one of Norway's sovereign wealth funds, CEO Yngve Slyngstad said at a presser this past Thursday that they're increasing their equities exposure from 65.3% up to 70.0%. As well over at Blackrock, 'tis said they're "rebalancing into risk assets" given the perception that significant value is now there for long-term investors. So that's what some Big Guys are doing. As for the little guys, your humble author heard independently from no less than three very close non-financial, family-oriented friends, each one specifically stating they shan't be opening their incoming investment statements. And as history time and again has shown, 'tis the Big Guys moving first that bring in the most benefit. Our take is that even with the S&P's sell-off, the "live" price/earnings ratio of 31.3x is historically still far too expensive: but in a zero-interest rate environment, 'tis been typically shown to not matter.
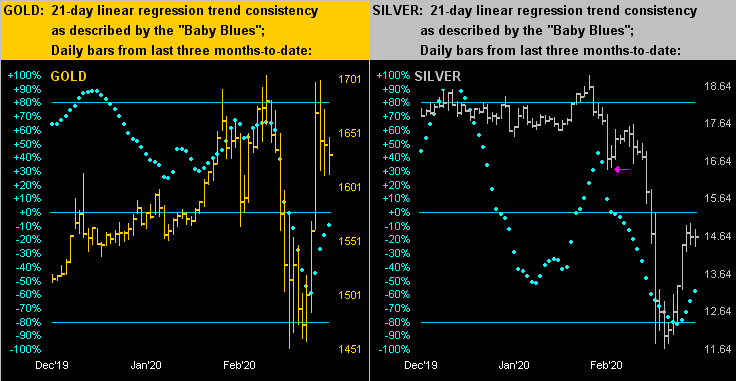
What does matter from the precious metals perspective is Silver's being cast aside as a commodity rather than being sought as money. In going to the following two-panel chart of daily bars from three months ago-to-date for Gold on the left and Silver on the right, the latter's comparative under-performance is glaring, as portrayed above the Gold/Silver ratio at present 111.5x. Gold has to deal with its oft-mentioned overhead structural blockage; but Silver -- especially given her "Baby Blues" of trend consistency having curled higher after being below their -80% level -- has open ground (should she so be desired) to make a run from Friday's settle at 14.625 up to the 16.400 area per the arrow, in turn retracting some of that excessive ratio:
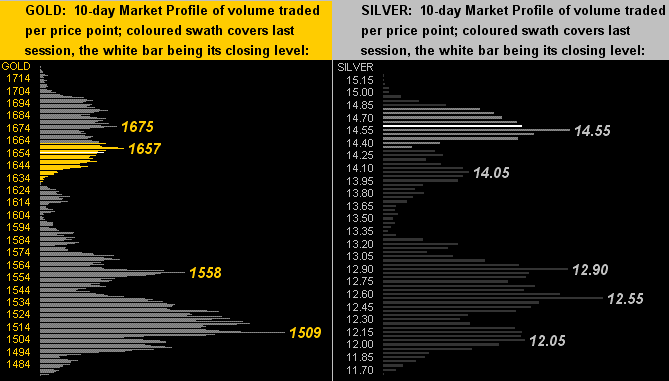
As for their 10-day Market Profiles, prices for both Gold (below left) and Silver (below right) scrambled back up their respective stacks. Note: for Gold, its profile's bars/labels are for the June contact, as volume moved away from that for April on Friday. Indeed there are some 24 points of added premium in Gold's June price:
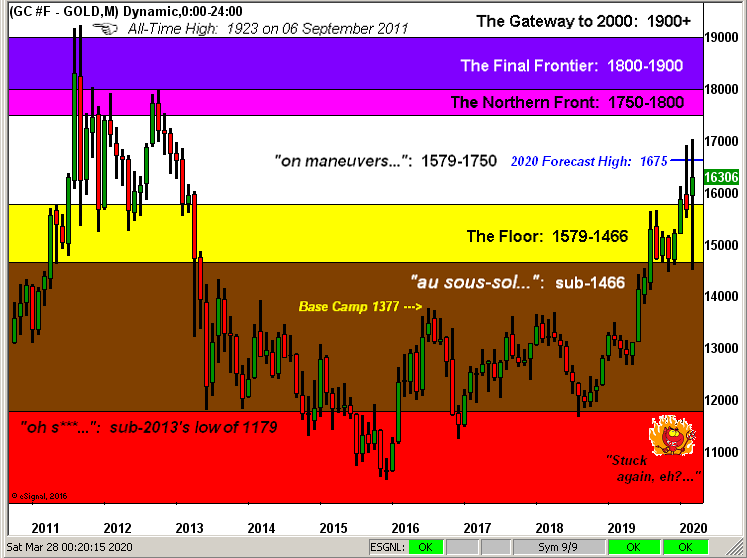
Finally, here is our broad-based chart of Gold's monthly bars and defined strata essentially since the All-Time High of 1923 on 06 September 2011. Again you can see how price has traipsed above our 1675 forecast only to have been beaten back in both February and March. Why the struggle? One only has to (again) look at the left-hand portion of the chart to see all that substantive structural congestion from 2011 into 2013:
Peering into the new week, we're to encounter everything from 16 incoming Econ Baro blurs to purported "off-label" COVID cures. An important page to mind at the website is Market Ranges: that's the clue for volatility readings across the BEGOS Markets. We've definitely sensed a slight slowing in markets' ranginess these past few sessions, and 'tis already being reflected in some of the Market Ranges' graphics as peaking out. However, when it comes to Gold, don't be left out!
www.deMeadville.com
www.TheGoldUpdate.com
*********

Mark Mead Baillie has had an extensive business career beginning in banking and financial services for two years with Banque Nationale de Paris to corporate research for three years at Barclays Bank and then for six years as an analyst and corporate lender with Société Générale.
For the last 22 years he has expanded his financial expertise by creating his own financial services company, de Meadville International, which comprehensively follows his BEGOS complex of markets (Bond/Euro/Gold/Oil/S&P) and the trading of the futures therein. He is recognized within the financial community of demonstrating creative technical skills that surpass industry standards toward making highly informed market assessments and his work is featured in Merrill Lynch Wealth Management client presentations. He has adapted such skills into becoming the popular author each week of the prolific “The Gold Update” and is known in the financial website community as “mmb” and “deMeadville”.
Mr. Baillie holds a BS in Business from the University of Southern California and an MBA in Finance from Golden Gate University.


