Gold Forecast: EUR/USD Tug-Of-War


 With a tug-of-war for USD Index supremacy unfolding at the 94 level, precious metals are anxiously awaiting the final outcome. And because the EUR/USD is the head of the dollar basket’s snake – due to the fact that the currency pair accounts for nearly 58% of the USD Index’s movement – confusion has arisen over why the euro is strengthening when its fundamental prospects are so weak.
Well, with short-term bursts of optimism par for the course, it’s important to remember that asset prices rarely move in a straight line. Moreover, when analyzed in the context of the EUR/USD’s YTD performance, the recent uptick is largely immaterial.
Please see below:
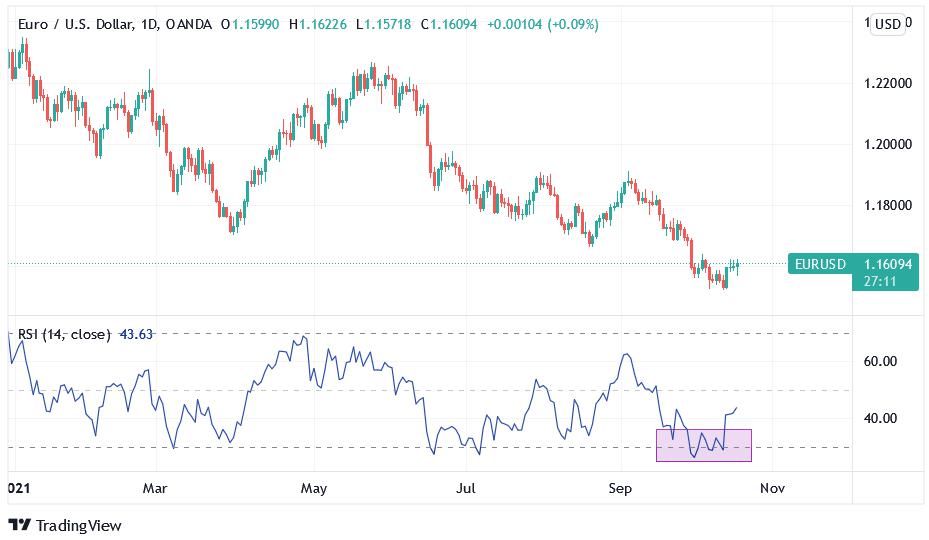
To explain, the candlestick chart above tracks the EUR/USD’s YTD movement. And with each enthusiastic rally eventually thwarted by fundamental realities, euro bulls have suffered mightily in 2021.
More importantly, though, if you analyze the shaded purple box on the bottom half of the chart, you can see that the EUR/USD’s RSI (Relative Strength Index) dipped below 30 (oversold conditions) and triggered a relief rally. Likewise, while similar oversold bounces occurred earlier in 2021, lower lows have plagued the currency pair throughout the year anyway. As a result, the small uptick has done nothing to dent our bearish medium-term (!) fundamental thesis for gold and silver.
To that point, the euro is the third-worst-performing currency within the USD Index YTD. For context, the SEK (not listed below) is the second-worst performer, but the USD/SEK only accounts for 4.2% of the USD Index’s movement.
Please see below:
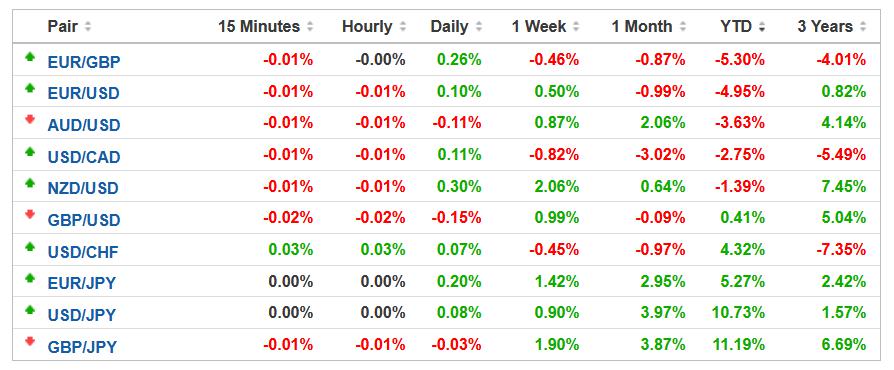
Source: Investing.com
To explain, if you analyze the column above labeled “YTD,” you can see that the EUR/USD has declined by 4.95% in 2021. Moreover, the USD/JPY (13.6% of the USD Index’s movement) holds the top spot, with the currency pair appreciating by 10.73% and implying that the JPY has depreciated by roughly 10% versus the U.S. dollar.
Furthermore, with the Fed poised to announce its taper timeline at its Nov. 2/3 policy meeting, and the ECB running in the opposite direction, a sharp decline in the Fed/ECB ratio should weigh on the EUR/USD over the medium term. For context, the Fed/ECB ratio has already declined by 3.75% in 2021.
To explain, I wrote on Oct. 15:
The Fed/ECB ratio – which measures the relative money printing of the two central banks – stands at roughly 1.02. And since 2015, if we exclude the EUR/USD’s outlier strength in 2017-2018, when the Fed/ECB ratio sunk below 1, the EUR/USD spent most of its time in the 1.100 to 1.150 range. Moreover, when the Fed/ECB ratio sunk to an all-time low of 0.81 in September 2019, the EUR/USD closed the week at 1.1029.
Please see below:
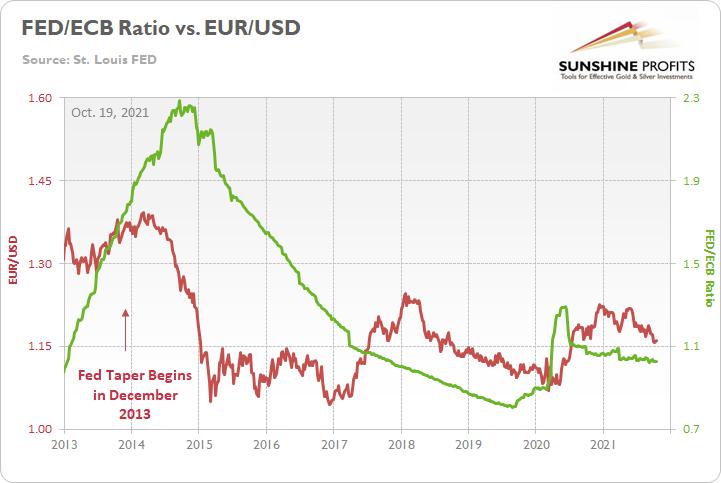
To explain, the red line above tracks the EUR/USD, while the green line above tracks the Fed/ECB ratio. If you focus your attention on the left side of the chart, the red arrow depicts when the Fed began reducing its bond-buying program in 2013. Moreover, if you analyze the performance of both variables, you can see that the EUR/USD fell off a cliff soon after and the Fed/ECB ratio plunged after a roughly 12-month delay.
However, unlike in 2013, this time around, the Fed/ECB ratio should decline immediately. And with the ratio likely to fall materially throughout 2022, the EUR/USD (excluding the abnormal strength that we witnessed in 2017-2018) has been unable to record lasting rallies when the ECB is outprinting the Fed. As a result, 1.1500 should break over the medium term, and assuming that the Fed/ECB ratio approaches its all-time low, the EUR/USD’s fair value likely lies in the 1.100 to 1.1250 range.
Circling back to the currency pairs’ performance chart, the GBP (11.9% of the USD Index’s movement) and the CAD (9.1% of the USD Index’s movement) have actually strengthened versus the U.S. dollar in 2021. For context, like the USD/JPY, the USD/CAD uses the U.S. dollar as the base currency and a YTD decline means that the Canadian dollar has strengthened.
What Do You Say, Canada?
To that point, while the Bank of England has turned hawkish and potential interest rate hikes put a fundamental floor under the GBP, the CAD is a different story. To explain, Canada is the fourth-largest oil-producing country in the world, and with WTI gunning for its ninth-straight week of weekly gains, rising oil prices have uplifted the Canadian dollar.
Please see below:
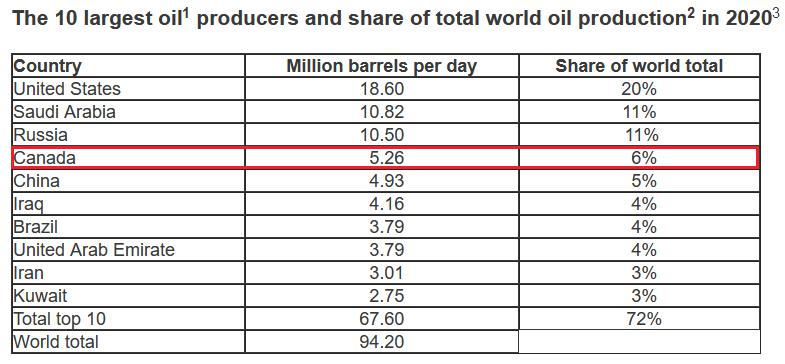
Source: the U.S. Energy Information Administration (EIA)
Conversely, while crude’s fervor is bullish for the Canadian dollar and bearish for the USD/CAD, a continuation of the theme is mutually exclusive to the Fed’s 2% inflation goal.
To explain, I wrote on Sep. 30:
Powell’s only hope to curb inflation is to strengthen the U.S. dollar and weaken commodity prices. For context, major futures contracts are priced in U.S. dollars. And when the dollar rallies, it’s more expensive for foreign buyers (in their currency) to purchase the underlying commodities. As a result, a stronger U.S. dollar often stifles demand. And with the current supply/demand dynamics favoring higher commodity prices, Powell will have to work his magic, strengthen the dollar and reduce commodities demand if he wants his inflation problem to subside.
Please see below:
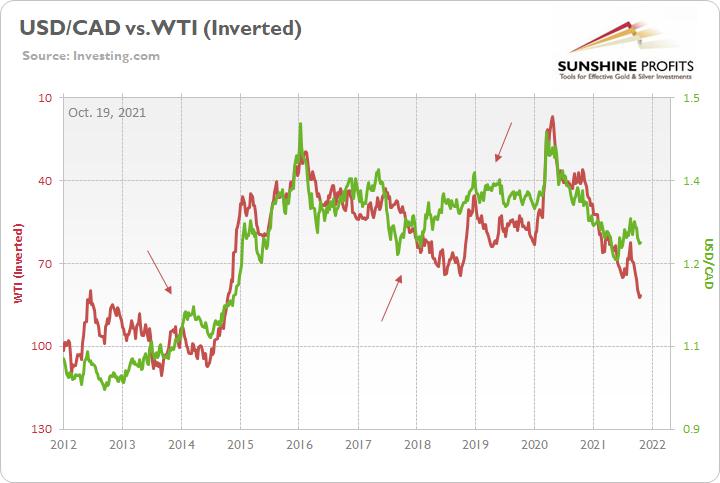
To explain, the green line above tracks the USD/CAD, while the red line above tracks the inverted WTI futures price. For context, inverted means that the latter’s scale is flipped upside down, and that a rising red line represents falling crude prices, while a falling red line represents rising crude prices. If you analyze the relationship, you can see that a stronger USD/CAD often stifles WTI’s bull markets.
To that point, if you focus your attention on the three red arrows, you can see that when the WTI rallied alongside the USD/CAD, the divergences ended with crude oil reversing sharply within three to nine months. As a result, with the Fed no longer ‘all in’ on “transitory” and a November taper announcement likely a done deal, the central bank needs the green line to rise to help calm the inflationary pressures. Thus, with a stronger USD/CAD poised to help Powell achieve his goal, his days of talking down the U.S. dollar are likely over.
As further evidence, the chart below demonstrates how the entire commodities complex makes a living off of a weaker U.S. dollar.
Please see below:
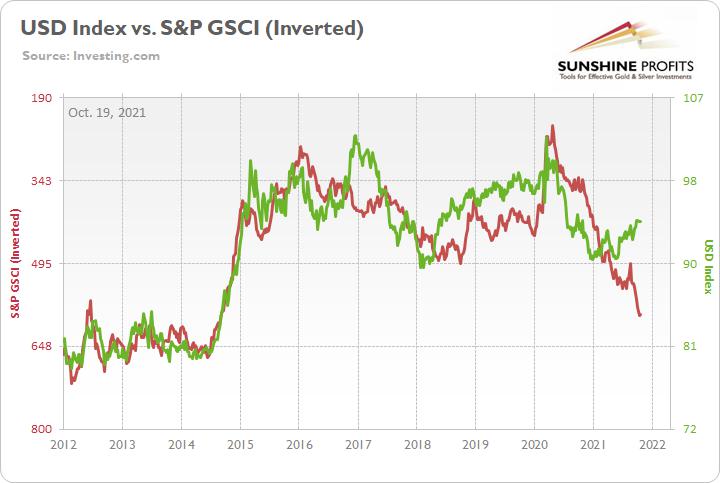
To explain, the green line above tracks the USD Index, while the red line above tracks the inverted S&P Goldman Sachs Commodity Index (S&P GSCI). For context, the S&P GSCI contains 24 commodities from all sectors: six energy products, five industrial metals, eight agricultural products, three livestock products and two precious metals. However, energy accounts for roughly 54% of the index’s movement.
If you analyze the relationship, you can see that a stronger USD Index often curbs commodity inflation. And while the S&P GSCI has surged in recent weeks, even as the USD Index has strengthened, the relationship has stood the test of time — the sharp rally (plunge) in the USD Index (S&P GSCI) in 2014-2015 is a cautionary tale of how quickly things can change.
The bottom line? If Powell allows the U.S. dollar to weaken, his inflationary problem will only intensify. Thus, not only does the greenback have technicals, fundamentals and sentiment (speculative futures positioning) on its side, but the Fed will likely become the U.S. dollar’s staunchest ally. And unless Fed officials want to see 6% and 7% year-over-year prints on the headline Consumer Price Index (CPI), their days of playing ‘PMs up, USD Index down’ are likely over.
In conclusion, the PMs traded in the red on Oct. 18 as U.S. Treasury yields rallied across much of the curve. And while the EUR/USD has strengthened in recent days, lower lows should still materialize over the medium term. Moreover, with the Fed’s taper announcement likely to commence in the coming weeks, the forthcoming liquidity drain is fundamentally bullish for the U.S. dollar. And with the PMs often moving in the opposite direction, a stronger greenback will likely weigh on the PMs’ performance over the next few months.
Summary
To summarize, the outlook for the precious metals sector remains extremely bearish for the next few months. Since it seems that the PMs are starting another short-term move lower more than it seems that they are continuing their bigger decline, I think that junior miners would be likely to (at least initially) decline more than silver.
From the medium-term point of view, the key two long-term factors remain the analogy to 2013 in gold and the broad head and shoulders pattern in the HUI Index. They both suggest much lower prices ahead.
And as silver often moves in close relation to the yellow metal, when gold falls, silver is likely to decline as well – it has probably already started its slide. The times when gold is continuously trading well above the 2011 highs will come, but they are unlikely to be seen without being preceded by a sharp drop first.
Thank you for reading our free analysis today. Please note that it is just a small fraction of today’s all-encompassing Gold & Silver Trading Alert. The latter includes multiple premium details such as the outline of our trading strategy as gold moves lower.
If you’d like to read those premium details, we have good news for you. As soon as you sign up for our free gold newsletter, you’ll get a free 7-day no-obligation trial access to our premium Gold & Silver Trading Alerts. It’s really free – sign up today.
Thank you.
Przemyslaw Radomski, CFA
Founder, Editor-in-chief
Sunshine Profits - Effective Investments through Diligence and Care
* * * * *
All essays, research and information found above represent analyses and opinions of Przemyslaw Radomski, CFA and Sunshine Profits' associates only. As such, it may prove wrong and be subject to change without notice. Opinions and analyses are based on data available to authors of respective essays at the time of writing. Although the information provided above is based on careful research and sources that are deemed to be accurate, Przemyslaw Radomski, CFA and his associates do not guarantee the accuracy or thoroughness of the data or information reported. The opinions published above are neither an offer nor a recommendation to purchase or sell any securities. Mr. Radomski is not a Registered Securities Advisor. By reading Przemyslaw Radomski's, CFA reports you fully agree that he will not be held responsible or liable for any decisions you make regarding any information provided in these reports. Investing, trading and speculation in any financial markets may involve high risk of loss. Przemyslaw Radomski, CFA, Sunshine Profits' employees and affiliates as well as members of their families may have a short or long position in any securities, including those mentioned in any of the reports or essays, and may make additional purchases and/or sales of those securities without notice.
********
 Przemyslaw Radomski, CFA, is the founder, owner and the main editor of SunshineProfits.com. You can reach Przemyslaw at: http://www.sunshineprofits.com/help/contact-us/.


