Gold Forecast: Is Gold About To Be Trampled By Snowballing Inflation?


 While the PMs and the general stock market assume that rising interest rates won’t cause any significant bouts of volatility, history suggests otherwise. With good data likely to elicit bad outcomes for both parties, the hotter the U.S. economy gets, the more cold water the Fed has to pour on the financial markets.
To that point, U.S. nonfarm payrolls came in at 431,000 versus 490,000 expected on Apr. 1. However, despite the slight miss, the U.S. unemployment rate fell to 3.6% and outperformed expectations.
Please see below:
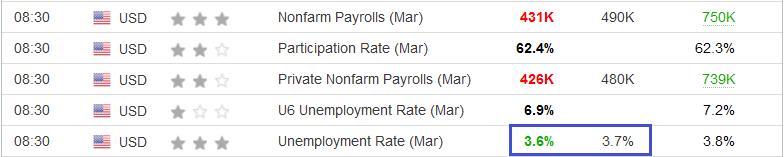
Source: Investing.com
Furthermore, the FOMC’s latest Summary of Economic Projections (SEP) shows that Fed officials expect the U.S. unemployment rate to reach 3.5% by the end of 2022. However, with the metric likely to outperform sooner than expected, a realization will add more fuel to the hawkish fire.
Please see below:
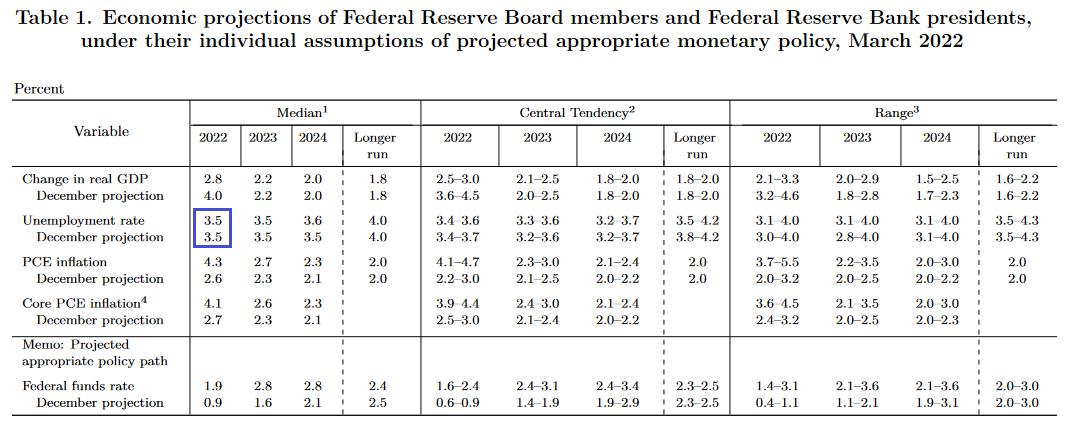
Source: U.S. Fed
In addition, while the number of Fed officials calling for seven rate hikes or more in 2022 has reached double digits, Chicago Fed President Charles Evans joined the fray on Apr. 1. He said:
“If monetary policy did not respond to these broader inflation pressures, we would see the expectation of continued high inflation become embedded in economic decisions, and we would have even harder work to do to rein it in. So monetary policy must shift to removing accommodation in a timely fashion, which is what you’ve seen in the latest actions by and communications from the FOMC.”
Moreover, while Evans supports the median projection and expects seven rate hikes in 2022, his expectations of a 1.9% and 2.8% U.S. federal funds rate in 2022 and 2023 are profoundly hawkish.
Please see below:
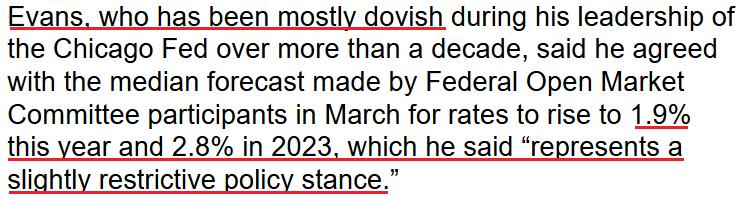
Source: Bloomberg
For context, please remember that Fed officials’ September projections showed roughly one rate hike in 2022. As a result, while investors remain sanguine for the time being, does it seem likely that the Fed will hike interest rates several times without any volatility? Moreover, if history is any indication, once the data starts to roll over, the narrative will shift from ‘all is well’ to ‘uh oh.’
In the meantime, though, the U.S. economy remains resilient, and with employment and inflation headlining the Fed’s dual mandate, there more they outperform, the more confidence the Fed will have to raise interest rates.
To that point, the Institute for Supply Management (ISM) released its U.S. Manufacturing PMI on Apr. 1. While the headline index decreased from 58.6 in February to 57.1 in March, Timothy R. Fiore, Chair of the ISM Manufacturing Business Survey Committee, said:
"The U.S. manufacturing sector remains in a demand-driven, supply chain-constrained environment. In March, progress was made to solve the labor shortage problems at all tiers of the supply chain, which will result in improved factory throughput and supplier deliveries. Panelists reported lower rates of quits and early retirements compared to previous months, as well as improving internal and supplier labor positions.”
As a result, the “ISM’s Employment Index registered 56.3 percent in March, 3.4 percentage points above the February reading of 52.9 percent.”
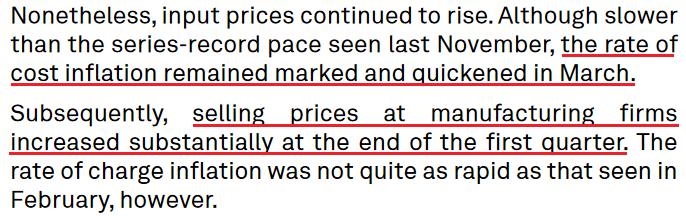
More importantly, though, inflation surged in March. The report revealed:
“The ISM Prices Index registered 87.1 percent, up 11.5 percentage points compared to the February reading of 75.6 percent, indicating raw materials prices increased for the 22nd consecutive month, at a notably faster rate in March. This is the biggest month-over-month increase since a 12.2-percentage point gain (to 77.6 percent) in December 2020.”
Thus, with the ISM’s data supporting the Fed’s hawkish disposition, inflation continues to run away from the central bank. As further evidence, S&P Global also released its U.S. Manufacturing PMI on Apr. 1. Here, the headline index increased from 57.3 in February to 58.8 in March. The report revealed:
“The pace of growth continued to gain momentum and was the quickest since last August. Crucial to the increase were reports of improved availability of raw materials and inputs as supply chain disruption eased slightly. Companies also noted that higher output was supported by stronger client demand and a rise in new orders. (…) Foreign client demand also strengthened, with new export orders rising at the joint-fastest pace for almost a year.”
In addition:
“Encouraged by stronger demand conditions, firms stepped up their hiring activity, with some also noting a greater ability to find suitable candidates.”
On top of that:
Source: S&P Global
Likewise, if the Fed needed any more fuel to light the hawkish fire, business confidence improved in March and highlights how the inflationary spiral will continue until the Fed curbs demand.
Please see below:
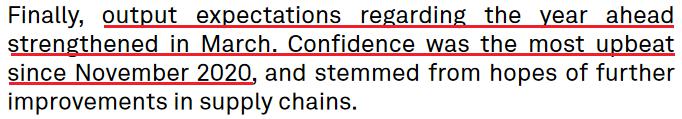
Source: S&P Global
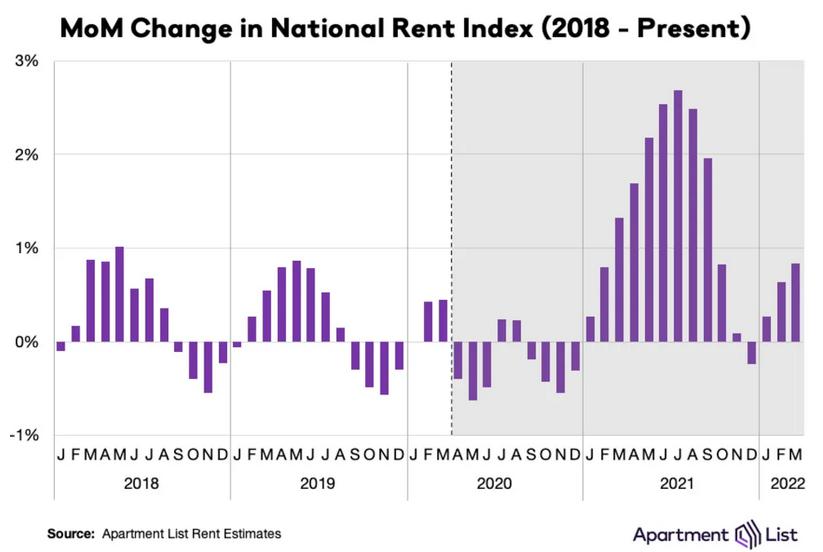
Adding to the Fed's ills, Apartment List released its National Rent Report on Mar. 28. For context, Shelter accounts for more than 30% of the headline Consumer Price Index's (CPI) movement. As a result, lodging is an important variable when analyzing the path of inflation, and therefore, future Fed policy.
The report revealed:
“Rent growth is continuing to pick up steam again, after a brief winter cooldown, with our national index up by 0.8 percent over the course of March.”
“This is a bit slower than the 1.3 percent increase that we saw last March, when the 2021 rent growth boom was just starting to pick up steam. It’s also well below the 2.3 percent average monthly rent growth that we saw from last April through September.
But even if growth has cooled down substantially from last summer’s peak, it is also pacing well ahead of the pre-pandemic norm for this time of year. In the first three months of 2022, rents nationally have increased by a total of 1.8 percent, which is twice as fast as the growth that we saw over the same period in 2018 (0.9 percent) and 2019 (0.8 percent).”
Please see below:
In addition, the report stated:
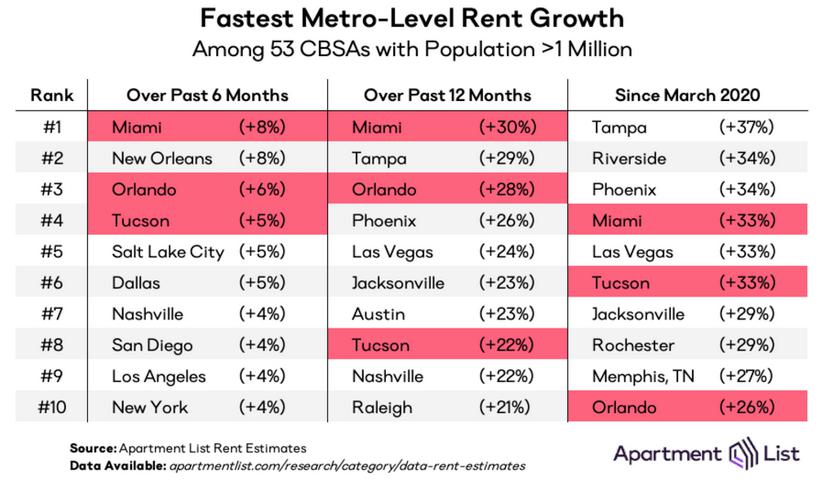
“In December 2021, rents fell in 61 of the nation’s 100 largest cities, the only month last year in which more than half of these cities saw a decline. This month, however, rents were up in 93 of the nation’s 100 largest cities.”
On top of that, when analyzing rent inflation across the fastest growing regions, the year-over-year (YoY) percentage changes (the second column below) are quite extreme.
Please see below:
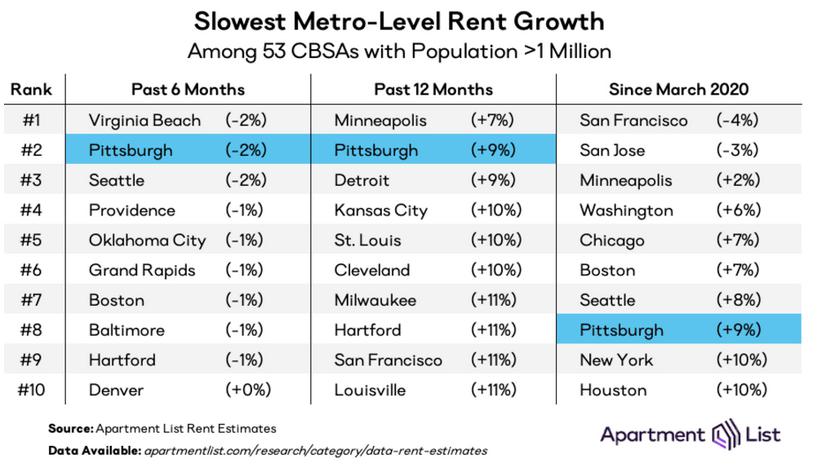
Furthermore, the Shelter CPI increased by 4.8% YoY on Mar. 10, while the owners’ equivalent rent metric increased by 4.3% YoY. However, Apartment List’s data shows that even the slowest growing regions (the second column below) have outpaced the U.S. government’s data over the last 12 months. As a result, with rents still rising MoM and government data still lagging, the Shelter CPI should have plenty of upside over the medium term.
Please see below:
Finally, I’ve highlighted how wage inflation has exploded in recent months, and with companies like Dave & Buster’s and Chewy citing labor cost increases of 20% and 17%, respectively, how can the Fed curb inflation with job openings near their all-time high and wage inflation still abundant?
Well, it’s important to note that average hourly earnings increased by 5.6% YoY on Apr. 1. Moreover, the metric outperformed the 5.5% YoY estimate and surpassed the 5.2% YoY figure from February.
Please see below:
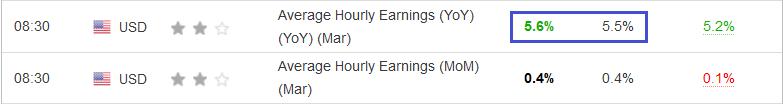
Source: Investing.com
Also noteworthy, Walgreens Boots Alliance released its second-quarter earnings on Mar. 31. President John Standley said:
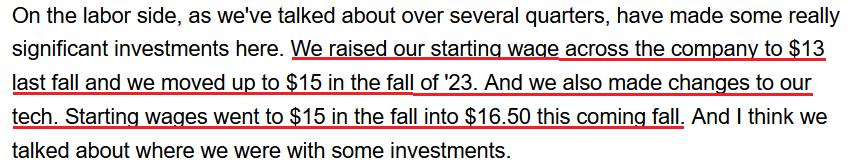
Source: Walgreens Boots Alliance/Seeking Alpha
As a result, if companies continue to increase their wages to attract employees, the inflationary spiral will never end. That’s precisely why environments like these are bullish for the U.S. federal funds rate.
Please see below:
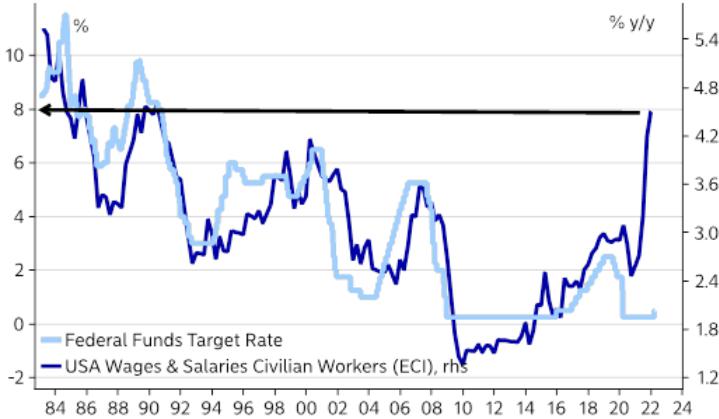
Source: Nordea
To explain, the dark blue line above tracks the YoY percentage change in the U.S. Employment Cost Index (ECI), while the light blue line above tracks the U.S. federal funds rate. As you can see, the pair have a tight historical relationship.
Moreover, with the gap on the right side of the chart unlike anything seen in the last ~40 years, the U.S. federal funds rate has plenty of room to run, and such a realization is profoundly bearish for silver and gold prices.
The bottom line? The hotter the data, the more hawkish the Fed. With inflation and employment continuing to sizzle, the Fed needs to cool the economy to avoid even bigger problems down the road. Moreover, with more than 10 Fed officials calling for at least seven rate hikes in 2022, it's naive to assume that bouts of panic won't erupt along the way. As such, history shows that liquidity drains are bearish for the PMs, and the likely pace of this one aligns with some of the most hawkish on record.
In conclusion, the PMs were mixed on Apr. 1, as momentum helped drive mining stocks higher. However, with their medium-term technicals and fundamentals continuing to decelerate, the next few months should elicit sharp reversals. Moreover, while investors act as if the end of QE and seven to 12 rate hikes are no big deal, the confidence game will likely unravel as the real drama unfolds.
Summary
Despite the ongoing Russian invasion of Ukraine, and despite gold being the traditional safe haven in times of turmoil, the overall outlook for the precious metals sector remains bearish for the next few months, and the medium-term outlook for the yellow metal remains pessimistic.
Since it seems that the PMs are starting another short-term move lower more than it seems that they are continuing their bigger decline, I think that junior miners would be likely to (at least initially) decline more than silver.
Thank you for reading our free analysis today. Please note that it is just a small fraction of today’s all-encompassing Gold & Silver Trading Alert. The latter includes multiple premium details such as the outline of our trading strategy as gold moves lower.
If you’d like to read those premium details, we have good news for you. As soon as you sign up for our free gold newsletter, you’ll get a free 7-day no-obligation trial access to our premium Gold & Silver Trading Alerts. It’s really free – sign up today.
Thank you.
Przemyslaw Radomski, CFA
Founder, Editor-in-chief
Sunshine Profits - Effective Investments through Diligence and Care
* * * * *
All essays, research and information found above represent analyses and opinions of Przemyslaw Radomski, CFA and Sunshine Profits' associates only. As such, it may prove wrong and be subject to change without notice. Opinions and analyses are based on data available to authors of respective essays at the time of writing. Although the information provided above is based on careful research and sources that are deemed to be accurate, Przemyslaw Radomski, CFA and his associates do not guarantee the accuracy or thoroughness of the data or information reported. The opinions published above are neither an offer nor a recommendation to purchase or sell any securities. Mr. Radomski is not a Registered Securities Advisor. By reading Przemyslaw Radomski's, CFA reports you fully agree that he will not be held responsible or liable for any decisions you make regarding any information provided in these reports. Investing, trading and speculation in any financial markets may involve high risk of loss. Przemyslaw Radomski, CFA, Sunshine Profits' employees and affiliates as well as members of their families may have a short or long position in any securities, including those mentioned in any of the reports or essays, and may make additional purchases and/or sales of those securities without notice.
*******
 Przemyslaw Radomski, CFA, is the founder, owner and the main editor of SunshineProfits.com. You can reach Przemyslaw at: http://www.sunshineprofits.com/help/contact-us/.


