Gold Forecast: Precious Metals’ Cooldown in the Fall


 Two Sides of the Same Coin
With the Delta variant decelerating U.S. economic momentum, the chorus proclaiming ‘peak growth’ is growing louder by the day. And as the colder months approach and outdoor activities fail to stimulate consumer spending, economists have sounded the alarm on the U.S. economic Renaissance.
Case in point: Goldman Sachs has reduced its third-quarter GDP growth estimate three times, and the investment bank expects Q4 and full-year 2022 to come in weaker than expected.
Please see below:
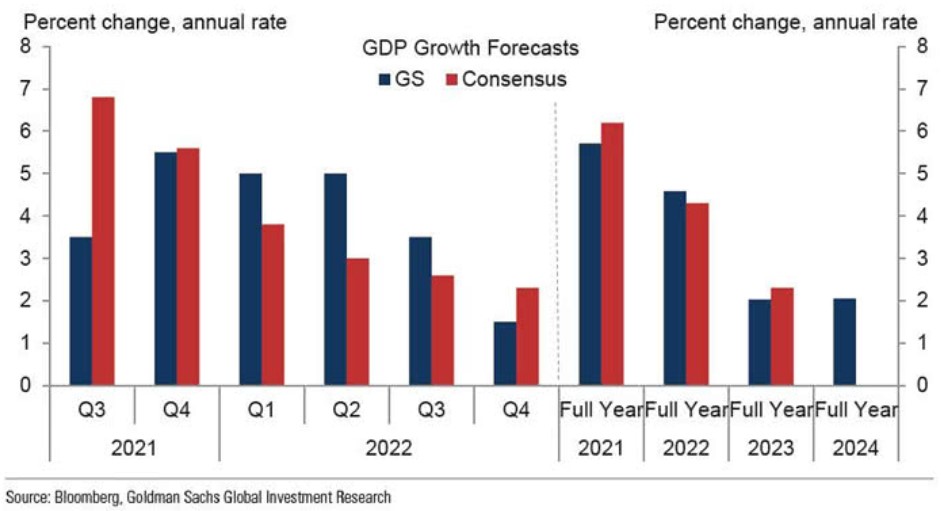
To explain, the blue bars above track Goldman Sachs’ GDP growth estimates, while the red bars above track economists’ consensus estimates. If you analyze the columns labeled “Q4” and “Full Year 2022,” you can see that Goldman Sachs expects a sharper-than-expected slowdown in the autumn months, and the weakness should persist into 2022.
Alongside, economists’ consensus estimates for the third and fourth quarters have also come down.
Please see below:
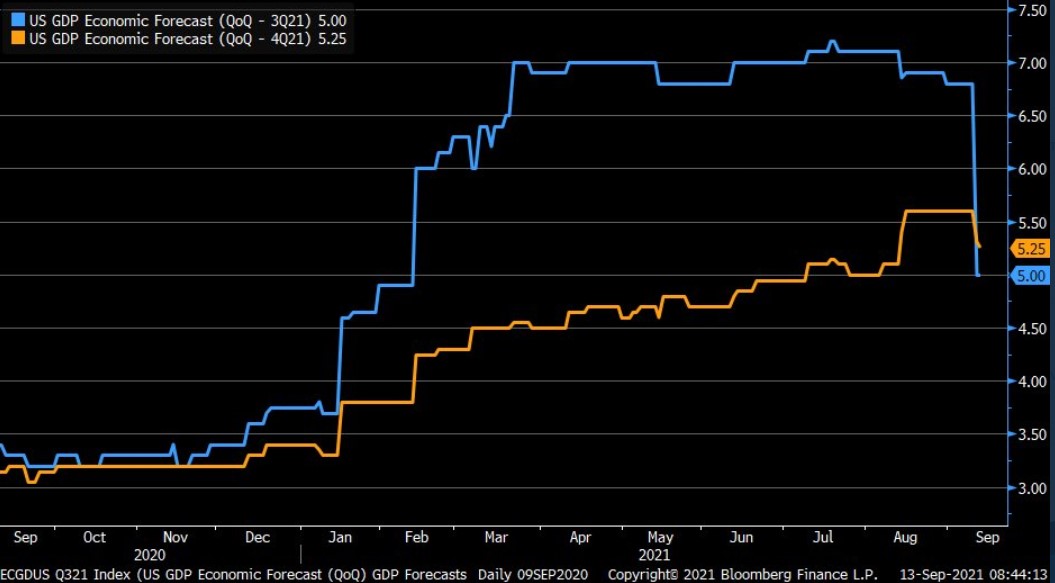
Source: Bloomberg/Liz Ann Sonders
To explain, the blue and orange lines above track economists’ consensus GDP growth estimates for the third and fourth quarters. If you analyze the right side of the chart, you can see that the blue line has fallen sharply and that the orange line is slowly following suit.
And upping the bearish ante, the Atlanta Fed’s GDPNow estimate for the third quarter has sunk well below Goldman Sachs and Bloomberg’s consensus estimates, with the metric nearly halving in the last month alone.
Please see below:
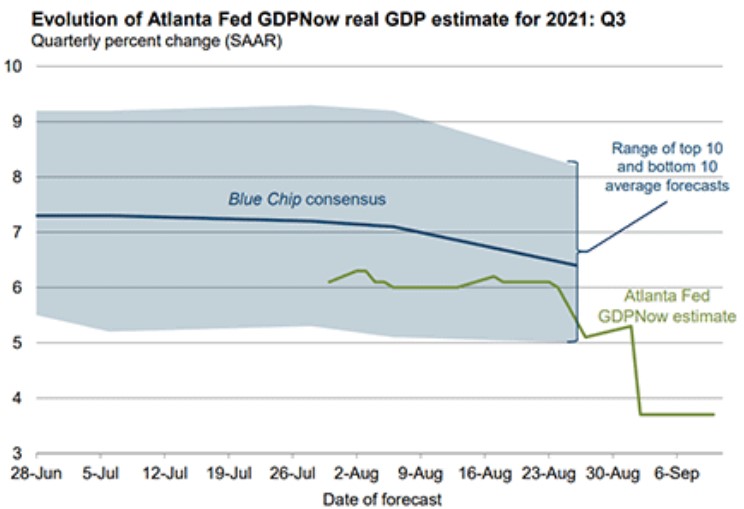
To explain, the blue line above tracks the Blue Chip consensus GDP growth estimate for the third quarter, and the shaded blue area represents the range of economists’ estimates. If you analyze the depth, you can see that economists expect a print in the ~5% to ~8% range. In stark contrast, the green line above tracks the Atlanta Fed’s GDPNow estimate – which implies 3.7% GDP growth in the third quarter.
More importantly, though, if growth falls off a cliff and the U.S. recovery is derailed, the doom and gloom could actually uplift the gold prices.
Well, while a major slowdown in U.S. growth could reduce U.S. Treasury yields and increase gold’s attractiveness as a bond proxy, the U.S. dollar’s uprising will likely outweigh any bullish potential. For example, when GDP growth decelerates and investors flock to safe-haven assets, the U.S. dollar is a primary beneficiary. And with gold, silver and mining stocks exhibiting strong negative correlations with the U.S. dollar, the PMs often suffer in the process.
Please see below:
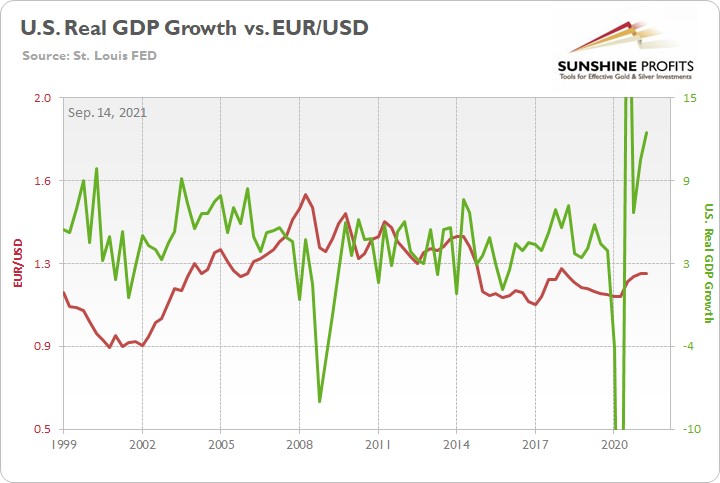
To explain, the green line above tracks the annualized percentage change in U.S. real GDP, while the red line above tracks the EUR/USD. For context, the EUR/USD accounts for nearly 58% of the movement of the USD Index. If you analyze the relationship, you can see that troughs in U.S. GDP growth often coincide with troughs in the EUR/USD. For example, when the U.S. entered recession in 2001, 2008 and 2020, the EUR/USD declined precipitously and helped fuel the USD Index’s uprising. Thus, with the PMs often moving inversely of the U.S. dollar, they’re unlikely to celebrate a decline in U.S. GDP growth.
Delta Variant Fades, Inflation… Not So Much
Furthermore, while the U.S. economy will likely regain its momentum once the Delta variant dissipates, the weakness in U.S. GDP growth could prove transient. In stark contrast, however, inflationary pressures remain robust, and the surge could elicit hawkish rhetoric from the Fed during its September 21/22 monetary policy meeting. To explain, the Wall Street Journal (WSJ) published a rather cryptic article on Sep. 10 titled: “Fed Officials Prepare for November Reduction in Bond Buying.” And with Chairman Jerome Powell promising “advance notice” before a formal announcement commences, the September meeting could be used to brace investors for what’s to come.
Please see below:
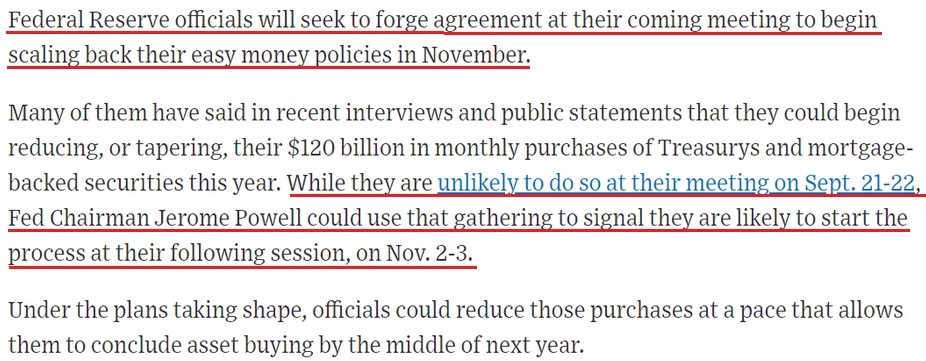
Source: WSJ
Furthermore, since the WSJ is considered the unofficial mouthpiece of the Fed, Goldman Sachs chief economist Jan Hatzius told clients on Sep. 11 that the article has moved the taper needle. He wrote:
“Earlier today, the Wall Street Journal published an article titled “Fed Officials Prepare for November Reduction in Bond Buying.” The article went on to state that officials “will seek to forge agreement” on November as the beginning of “scaling back” accommodation, and it subsequently cited several public remarks about tapering from Chairman Powell and other members of the leadership. Reflecting this, we are increasing our subjective odds of a November taper announcement. We now see 70% odds of a November announcement (vs. 45% previously) and 10% odds of a December announcement (vs. 35% previously); we continue to see a 20% chance that growth risks related to the Delta variant delay the tapering announcement into 2022.”
Thus, if a formal announcement is scheduled for November, hawkish hints will likely emerge at the Fed’s upcoming meeting.
In the meantime, though, surging inflation should be keeping Powell up at night. For example, Apollo Global Management CEO Marc Rowan – whose firm has $472 billion in assets under management as of June 30 – said on Sep. 13 that inflation is “everywhere.”
“There’s not a place [where we are not seeing it]. Everything that we once did now costs more,” he told CNBC’s Leslie Picker as part of “Delivering Alpha.” “Lead times, pressure on inventory, pressure on supplies, pressure on employment. Our experience in our portfolio is really no different than the broader economy.”
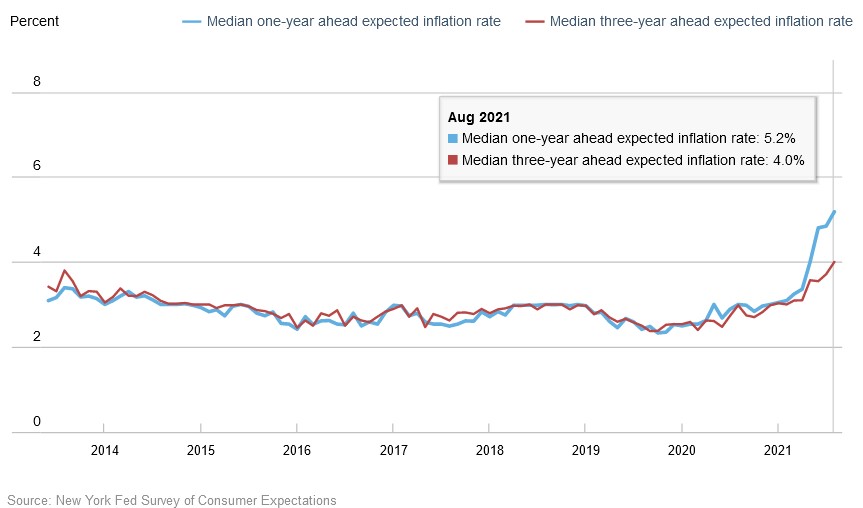
What’s more, the New York Fed also released its August Survey of Consumer Expectations on Sep. 13. And surprise, surprise, the report revealed:
“Median one-year-ahead inflation expectations increased by 0.3 percentage point to 5.2% in August, the tenth consecutive monthly increase and a new series high. Median inflation expectations at the three-year horizon also increased by 0.3 percentage point to a new series high of 4.0%.”
Please see below:
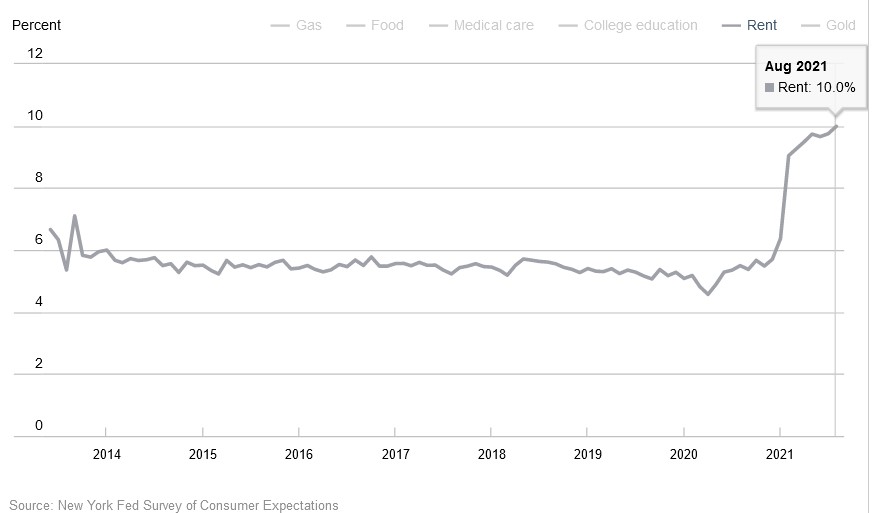
In addition, while I’ve warned on several occasions that the Shelter Consumer Price Index (CPI) could accelerate the inflationary momentum during the autumn months, U.S. consumers are already bracing for a surge in rent inflation.
Please see below:
Base Effects Are Long Gone
Finally, with the U.S. headline CPI likely to sizzle today and weak comparable periods no longer relevant, notice how deflationists no longer cite “base effects” anymore?
To explain, I wrote on Jun. 15 and updated on Aug. 17:
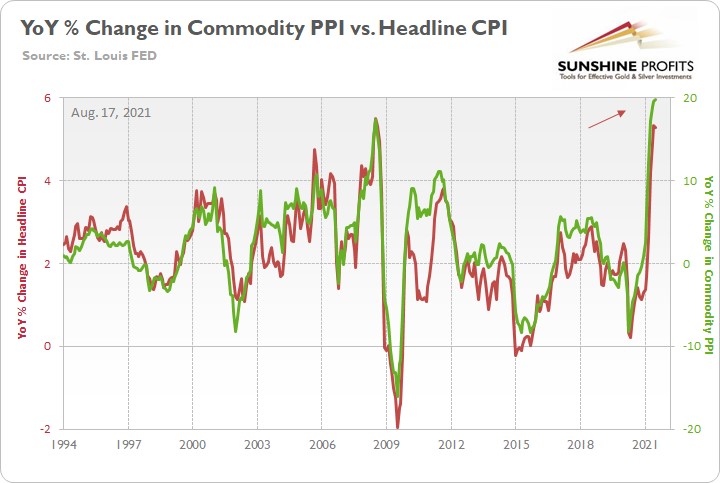
The commodity Producer Price Index (PPI) often leads the headline CPI and that’s why tracking its movement is so important. If we analyze the performance of the pair during the inflationary surges of the 1970s and the early 1980s, it’s clear that the relationship has stood the test of time.
Please see below:
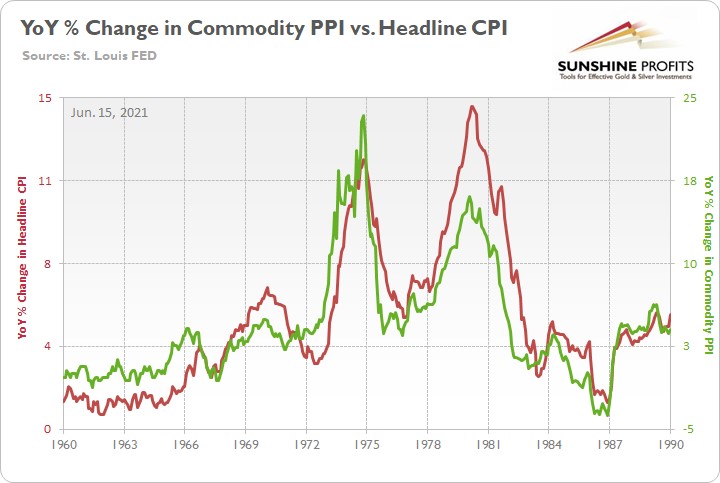
To explain, the green line above tracks the year-over-year (YoY) percentage change in the commodity PPI, while the red line above tracks the YoY percentage change in the headline CPI. If you analyze the relationship, you can see that the pair have a close connection.
More importantly, though, during the historical inflationary downpour, the month-over-month (MoM) percentage change in the commodity PPI never declined by more than 1.68%.
Please see below:
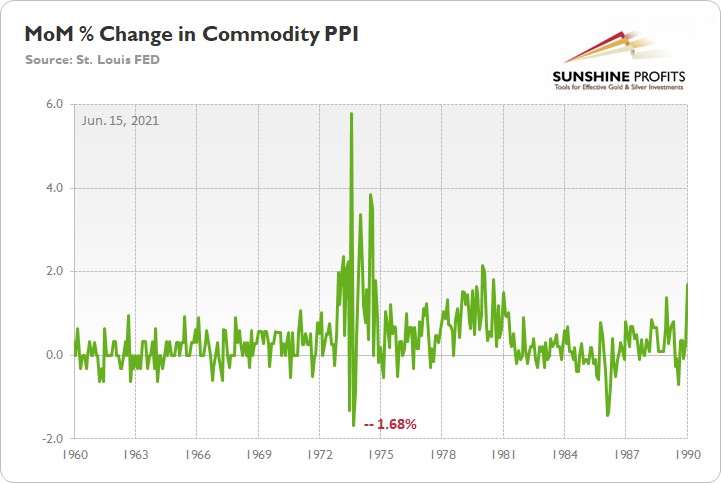
To explain, the green line above tracks the MoM percentage change in the commodity PPI. And if you compare the two MoM spikes in the commodity PPI to the two YoY spikes in the first chart above (focus your attention on the highs between 1972-1975 and 1978-1981), you can see that MoM resiliency helped sustain the YoY surges. In addition, during the roughly nine-year bout of inflation, the commodity PPI dipped in-and-out of negative territory but never fell off a cliff.
Back to the present, with the commodity PPI rising by 1.2% MoM and 19.8% YoY (highest since 1974) on Aug. 12, the inflationary pressures remain abundant. Moreover, with the commodity PPI rising MoM in March, April, May, June and July 2021, the YoY percentage increase in July was actually higher than it was during the lockdown periods (“base effects”) of March, April and May 2020. Thus, input inflation is still accelerating even though “base effects” are no longer relevant. And with the merry-go-round still turning, the commodity PPI implies a headline CPI print of roughly 5.25% to 5.75% when the data is released on Sep. 14.
Please see below:
The bottom line? With another 5%+ headline CPI print likely to hit the wire today, inflation is more than 2.5x the Fed’s annual target. And with “base effects” long gone and several Fed officials lobbying for an immediate taper, pressure on Powell should accelerate in the coming weeks.
In conclusion, while gold and the gold miners rallied on Sep. 13, their medium-term outlooks remain extremely treacherous. And with the Fed’s taper timeline shortening by the day, a hawkish surprise on Sep. 21/22 could lead to another sell-off. Moreover, with the USD Index holding firm and decelerating economic growth poised to add to the greenback’s momentum during the autumn months, the PMs’ performance will likely cool alongside the fall temperature.
Summary
To summarize, the previous strength in the precious metals sector was reversed, just like it was likely to, and the most bearish thing about it is that it happened practically without a good fundamental trigger. This means that the precious metals sector simply can’t wait to decline to much lower levels.
And as silver often moves in close relation to the yellow metal, when gold falls, Silver is likely to decline as well – it has probably already started its slide. The times when gold is continuously trading well above the 2011 highs will come, but they are unlikely to be seen without being preceded by a sharp drop first.
Thank you for reading our free analysis today. Please note that it is just a small fraction of today’s all-encompassing Gold & Silver Trading Alert. The latter includes multiple premium details such as the outline of our trading strategy as gold moves lower.
If you’d like to read those premium details, we have good news for you. As soon as you sign up for our free gold newsletter, you’ll get a free 7-day no-obligation trial access to our premium Gold & Silver Trading Alerts. It’s really free – sign up today.
Thank you.
Przemyslaw Radomski, CFA
Founder, Editor-in-chief
Sunshine Profits - Effective Investments through Diligence and Care
* * * * *
All essays, research and information found above represent analyses and opinions of Przemyslaw Radomski, CFA and Sunshine Profits' associates only. As such, it may prove wrong and be subject to change without notice. Opinions and analyses are based on data available to authors of respective essays at the time of writing. Although the information provided above is based on careful research and sources that are deemed to be accurate, Przemyslaw Radomski, CFA and his associates do not guarantee the accuracy or thoroughness of the data or information reported. The opinions published above are neither an offer nor a recommendation to purchase or sell any securities. Mr. Radomski is not a Registered Securities Advisor. By reading Przemyslaw Radomski's, CFA reports you fully agree that he will not be held responsible or liable for any decisions you make regarding any information provided in these reports. Investing, trading and speculation in any financial markets may involve high risk of loss. Przemyslaw Radomski, CFA, Sunshine Profits' employees and affiliates as well as members of their families may have a short or long position in any securities, including those mentioned in any of the reports or essays, and may make additional purchases and/or sales of those securities without notice.
********
 Przemyslaw Radomski, CFA, is the founder, owner and the main editor of SunshineProfits.com. You can reach Przemyslaw at: http://www.sunshineprofits.com/help/contact-us/.
More from Gold-Eagle


