Gold Gains a Higher Perch; Stocks Face a Lower Lurch


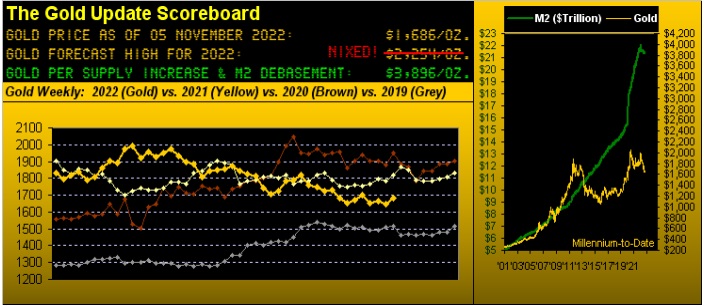
How refreshing 'tis to see Gold gain some attention! In settling out the week yesterday (Friday) at 1686, 'twas Gold's fourth-largest contract volume day in nearly four months -- and moreover for the week -- the largest contract volume since that ending eight months ago on 07 March. Further, low-to-high for yesterday alone marked Gold's second best intraday gain (+3.4%) in 2022, and by same its third best weekly gain (+4.2%) year-to-date. So finally: it this IT?
Whilst waddling 'round as a wayward duck for many a month, one wonders for Gold if this indeed is IT. 'Course, a one-day wonder (so far?) of "Dollar Weakness!" worked not just positively for Gold, but for the entirety of the BEGOS Markets (Bond, Euro/Swiss, Gold/Silver/Copper, Oil, S&P), notably therein the Metals Triumvirate. The Dollar Index on Friday suffered its worst single-day loss (-2.0%) since 03 December 2015, in turn putting the metals into high gear: Gold recorded its best daily gain (+3.3% net) since 09 April 2020, Silver its best (+7.4%) since this past 03 October, and Copper its best ...(wait for it)... since 27 January 2009 with an +8.1% surge! Cue the late great broadcaster "Bullet" Bill King: "Holy Toledo!!"
'Course Gold's negative nattering nabobs would say that because Gold is a commodity, it merely was swept up with the rest of the bunch in yesterday's rally: "Nothing to see here..." May they forever flourish with their "meme stocks"; we'll stick to our Gold.
Besides, we expect Gold to garner notice with all that's goin' on out there: the Federal Reserve continues to raise rates which as we've herein documented ad nauseam found the price of Gold rise +69% from 2004 through 2006 whilst FedFunds rate rose from 1.00% to 5.25%. Inflation is consistently on the march which gives an edge to the world's best hedge: Gold! Geo-politics are negatively spreading. And then StateSide are Tuesday's mid-term elections, by which -- should power shift -- can elicit inner-city civil carnage, a là summer 2020; (once has to say we pray cooler heads prevail).
Either way, warmer is Gold's price as we turn to its weekly bars from one year ago-to-date. Yesterday's Dollar-induced upward thrust -- were there to be some ensuing follow-through -- can get Gold to the end of its ongoing parabolic Short trend per the declining red dots. To so do in the new week is requisite of a further +60-point move (+3.6%) up through the graphic's noted "flip price" of 1745 toward getting Gold en route to a retest of the 1800s:

Note too at the foot of the graphic that the Gold/Silver ratio is now down to 80.6x: that remains high by historical measure, but is nicely lower than the 90.7x we saw just three weeks ago on 15 October, and 'tis a testament to Silver's material move on Friday. Priced now at 20.92, were Silver in line with the century-to-date mean of the Gold/Silver ratio (67.2x) 'twould be 17% higher still today at 25.10. Again, do not forget the Silver!
Thus Gold has at least for the moment gained a higher perch; but per this missive's title, stocks face a lower lurch. If you've that feeling that "Something's not right about this...", from making the financial rounds here, you are not alone. Let's assess the situation via the mighty S&P 500 as it goes rather flighty.
To be sure, the investing world is keen to S&P 3600 being a significant technical support level, (more precisely 3600-3200) and that 3600 for the present (actual price being 3771) is holding. But fundamental support via earnings (or lack thereof) remains well lower toward the mid-2000s. No, we shan't overly re-hash all that this week given we've described it a million times over recent weeks.
Nonetheless (or better stated moretheless) let's cite three substantive conditions -- to which we just alluded as Gold favourable -- that on a mutually-exclusive basis are bad for stocks:
1) Rising interest rates in tandem with non-supportive earnings generation: out of risk (stocks) and into safety (bonds); or...
2) Inflation ramping up the demand for cash: in the old days, folks would raid their savings accounts to pay the mortgage and keep Buffy at university; but savings accounts became passé years ago, the risk-capital stock market in ignorant lieu becoming the Great American Savings Account; thus stocks get sold; or...
3) Geo-political tension, with increasing incidents of it 'round the world especially whilst the West is weak: RUS/UKR and now this past week NKOR/SKOR, with both CHN/TWN and now IRN/SAU newly pending.
Again, each of these three conditions by its own accord is damaging for stocks. And today we've all three at once!
Remember the DotComBomb? S&P -50.5%. Then the FinCrisis? S&P -57.7%. If we're in the midst of the next great fallout (our oft-quipped "Look Ma, No Earnings!" crash), the S&P is at present -21.8% whereas price's reversion to the earnings' mean calls for -49.2% (all-in from the recent 4819 all-time high to 2450).
More earnings insight? For Q3 with 410 of the S&P 500 constituents having reported, 41% did not better their COVID-laden earnings of a year ago. Shouldn't they all have improved? But no, and thus our honestly-calculated price/earnings ratio of the S&P 500 at this week's settle is 32.5x. But wait: 'twas pointed out to us this past week that according to CNBS, the P/E apparently is just half that at 17x, (to which we responded "We'd love to see how that was calculated!" But then we took pause as they don't actually calculate it: rather they parrot it). And Bob Shiller's cyclically-adjusted version now at 27.7x is not that far below our reading. So just in case you're scoring at home, here we reprise the real formula from which you'll arrive at today's 32.5x; ("It's so easy, even a WestPalmBeacher can do it!"):
As to the Fed, regardless of what is said, rate increases are to continue. And yet now at the 3.75%-to-4.00% target range -- with the Fed's favoured gauge of inflation (Core PCE Index) reported a week ago again at an annualized rate of 6.00% -- another three +0.75% hikes gets them to at least that 6.00% inflation level.
"But hang on a sec, mmb, because at 4% interest today, the 6% inflation effectively reduces to the Fed's 2% target right now."
Squire makes the perfect point mathematically. (So how come they're not stopping?) Just another of those things that makes you go "Hmmm..."
And specific to the Dollar -- the Fed's "mandate" for which is to maintain a relative level of stability -- credit them with leading the rate hike parade, and thus the flight to Bucks these many months. But now with follow-the-leader rate rises from the European Central Bank and Bank of England, they’re perhaps digging a bit into the Dollar's still attractive return. (As recently noted, The Old Lady of Threadneedle Street must be fit to be tied seeing her precious Sterling fall over the past 50 years from $4/£ to $1/£ or even worse SwissSide from ₣10/£ to ₣1/£).
Speaking of return, did you see the annualized U.S. Three-Month Treasury Bill's yield settle yesterday? 4.013% -- that's riskless. For the "who knows how low 'twill go" S&P 500? 1.769% -- that's risky. Not to belabour the point, but again recall from this past spring: "...we see no sense fundamentally to be in the stock market..." and where are we now? Nuff said.
And yet with respect to last week's "Recession Over..." piece and many market observers today asserting we'd not actually been in one, "but now it is coming", the Economic Barometer nevertheless shows "them" to be 180° out-of-phase as the Baro continues to barrel upward:
Indeed, notable economic improvements this past week came from October's ADP Employment data (even as Labor's Unemployment Rate inched higher), along with September's Construction Spending and Factory Orders. Still, there were a couple disappointments as October's Institute for Supply Management's Services Index fell and September's Trade Deficit ballooned a bit. But on balance the Econ Baro looks fairly firm of late -- and were it not for poor stock market earnings -- would otherwise be an inducement to race back into stocks. Yet let's also reprise page 771 from Jerome B. Cohen's collegiate textbook "Personal Finance: Principles and Case Problems", wherein 'tis written: "In a bear market many stocks will sell at 5 to 7 times earnings, while in bull markets the average level would be about 15 to 18 times earnings." And today we're at 32.5x? No thank you.
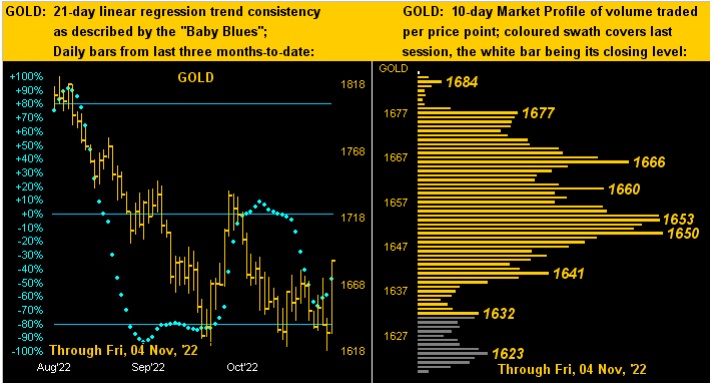
Far more impressive were the precious metals in closing out the week. As we first go to Gold's two-panel display, on the left we've the daily bars from three-months ago to date, the rightmost robust bar the best of the bunch and the baby blue dots of linear regression consistency belying the downtrend; and on the right in Gold's 10-day Market Profile, we see price barely peeking in from its topmost rung:
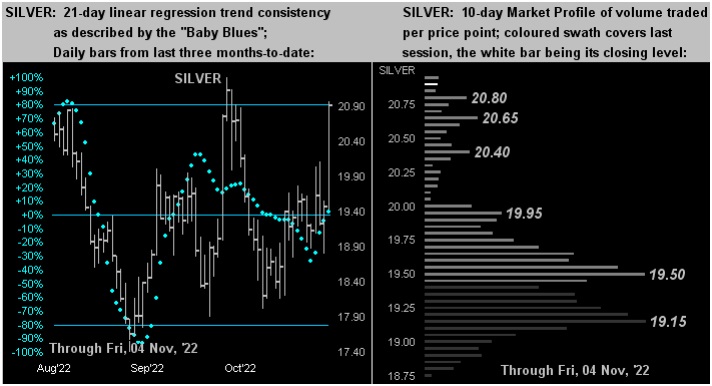
'Course, the same graphical construct for Silver is more impressive, her rightmost daily bar (at left) nearly piercing the top of the chart whilst (at right) she too is sky-high in her Profile:
All of which brings us to the stack:
The Gold Stack Gold's Value per Dollar Debasement, (from our opening "Scoreboard"): 3896
Gold’s All-Time Intra-Day High: 2089 (07 August 2020)
2022's High: 2079 (08 March)
Gold’s All-Time Closing High: 2075 (06 August 2020)
The Gateway to 2000: 1900+
The 300-Day Moving Average: 1805 and falling
The Final Frontier: 1800-1900
The Northern Front: 1800-1750
On Maneuvers: 1750-1579
The Weekly Parabolic Price to flip Long: 1745
Trading Resistance: none via the Profile
10-Session directional range: up to 1686 (from 1618) = +68 points or +4.2%
Gold Currently: 1686, (expected daily trading range ["EDTR"]: 29 points)
Trading Support: Profile notables include 1666 / 1660 / 1653-1650
10-Session “volume-weighted” average price magnet: 1654
2022's Low: 1618 (03 November)
The Floor: 1579-1466
Le Sous-sol: Sub-1466
The Support Shelf: 1454-1434
Base Camp: 1377
The 1360s Double-Top: 1369 in Apr '18 preceded by 1362 in Sep '17
Neverland: The Whiny 1290s
The Box: 1280-1240
To close we've these three quick hits:
■ The vaunted private StateSide bank known as the Federal Reserve is now purportedly operating with greater interest expense than interest income. Whilst in the real world that can't be good, a mere penciled entry onto their buff ledger paper ought resolve that, right? Or are we missing something...
■ Credit CNN (yes really) for rightly pointing to "The Dow" (aka "that index at which our parents look") having recorded for October the best net monthly gain (+14.0%) since January 1976. However per the same timeframe for the S&P 500, the gain (+8.0%) ranks 22nd across those 562 months. But should it unfold, let's see how the downside compares...
■ Downside indeed being our broader sense for stocks, we're put in mind of the baboon thriller film "Sands of the Kalahari" --[Paramount, '65] wherein the unusually un-dapper Nigel Davenport frightfully proclaims from his critically-damaged plane's cockpit: "Fasten in, we're coming down..."
Cheers!
...m...
********

Mark Mead Baillie has had an extensive business career beginning in banking and financial services for two years with Banque Nationale de Paris to corporate research for three years at Barclays Bank and then for six years as an analyst and corporate lender with Société Générale.
For the last 22 years he has expanded his financial expertise by creating his own financial services company, de Meadville International, which comprehensively follows his BEGOS complex of markets (Bond/Euro/Gold/Oil/S&P) and the trading of the futures therein. He is recognized within the financial community of demonstrating creative technical skills that surpass industry standards toward making highly informed market assessments and his work is featured in Merrill Lynch Wealth Management client presentations. He has adapted such skills into becoming the popular author each week of the prolific “The Gold Update” and is known in the financial website community as “mmb” and “deMeadville”.
Mr. Baillie holds a BS in Business from the University of Southern California and an MBA in Finance from Golden Gate University.


