Gold Gets Supported; Downside Thus Thwarted!


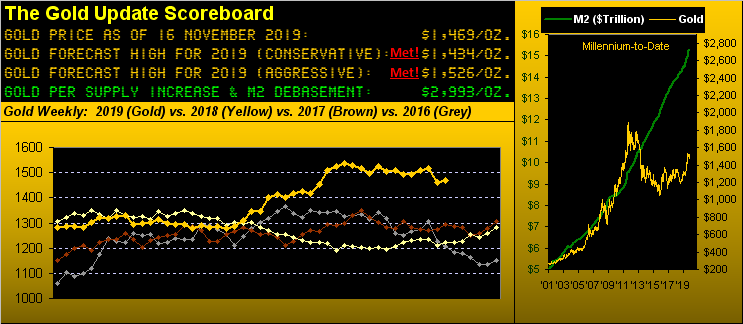
We've herein gone on now for nine weeks nearly ad nausea about the Gold pricing zone of 1454-1434 being an anticipated "support shelf". And indeed, now with nine weeks notched of parabolic Short trend, Gold's price finally has truly tested that zone, which so far has superbly thwarted any further downside unknown. Gold settled out the week yesterday (Friday) at 1469, en route trading down to as low as 1446 into the "support shelf".
And Gold's recovery from the "support shelf" all happened in spite of the stock market's further upside in busting out to new all-time highs, our preferred measure thereto being the S&P 500 and its settling the week smack on such high of 3120. (Editorial observation: so much for the markets being concerned over an impeachment, let alone a change of party in the Executive Branch come 20 January 2021).
Either way, specific to Gold, price early in the week worked not quite halfway down into the 1454-1434 "support shelf", at which point buyers realized "Behold the Gift of Gold!" (as was entitled last week's piece) and 'twas "Game On!" for price's resilient whirl 'round to the upside. Here is Gold (by its December contract) start-to-finish for the week just past, (price charted in three-point "range bars", a favoured trading display of ours), along with the mighty 1454-1434 "support shelf" therein:

'Course, one recovery week does not offer absolute technical assurance that the worst of the present parabolic Short trend is in place. To be sure (or not so), the picture is hardly as pretty when we next broaden out to Gold's weekly bars, the declining red dots now numbering nine weeks in time. Moreover, the 1454-1434 "support shelf" in this context appears rather wee, albeit 'tis defined by prior resistance, notably our "conservative" forecast high for this year of 1434 now being assigned as support. The trading algorithms see it, the technical traders see it, and here, too, you see it:
Now let's swing from what "everybody sees" to perhaps what few do: the vast graphical chasm between the heights of the S&P 500 and the depths of the Economic Barometer. Think about it: the S&P is rising whilst the Econ Baro is on balance falling; the S&P is rising whilst its Q3 Earnings Season via the like quarter of a year ago is weakest for the number of constituents improving their bottom lines (61%) since Q3 of 2017 (54%); the S&P is rising whilst our "live" price/earnings ratio is 33.3x, essentially double what was taught in B-school as "expensive". Oh what the heck. Don't think about it: the S&P is rising because there's no other conventional place to grow your dough, (notwithstanding the inevitable "Oh-Nooo!") Here's the Baro:
That noted, we're thinkin' that "Gold sees" all of the foregoing. Certainly the dour-faced Goldites with their storage bunkers and emergency Swiss Franc cash stashes, clading themselves in their coffee-stained trench coats and low-brimmed hats as they stealthily slither up to the protective glass counters in coin stores to add to their stacks "see it". To be sure, stagflation watchers "see it": for October, both wholesale and retail inflation surged the most (both +0.4%) since their respective March readings, and yet Industrial Production fell the most (-0.8%) since March of 2016. Oh, and on a bit larger scale, Russia "sees it" as, of course, does China.
We're thinkin' as well that Federal Reserve Vice Chair Richard Clarida clearly "sees it", his capitalizing on alliteration by expressing at the Cato Institute this past Thursday that "In addition to assessing the efficacy of...existing tools, the review is examining additional tools for easing policy when the effective lower bound is binding". Nice. But his boss Bill Powell is backing away from any zero-rate play, noting further that the StateSide economic expansion is here to stay (at least for now anyway). Just bear in mind that per this missive's opening Gold Scoreboard, Gold "ought be" nearly 3000 today. 'Tis what we're seein'. Ok?
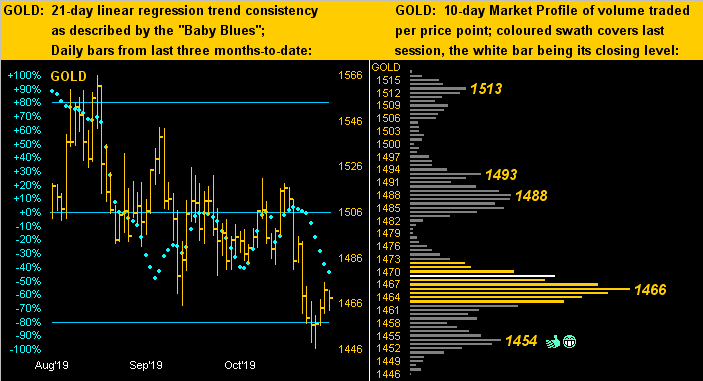
Not ok is the present state of Gold's baby blue dots which depict the consistency of price's 21-day linear regression trend as next shown on the left across the daily bars from three months ago-to-date: the deeper sub-0% that the dots dive, the more consistent the downtrend, the aforementioned 1454-1434 "support shelf" notwithstanding. 'Course for you annoying Shorts out there, the time to have sold was way back in the chart's leftmost area when the dots first moved below their +80% axis, (such rule-of-thumb as noted on the website's Market Trends page). More positively per the 10-day Market Profile on the right, 1466 shows as dominant trading support, followed thereunder by our friend at 1454:
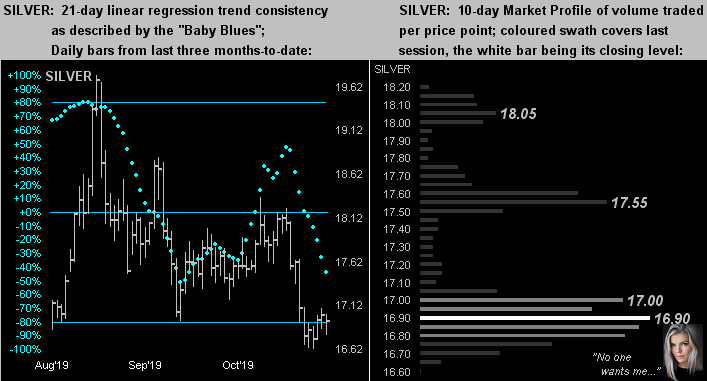
And then there's poor ole Silver. Did you note the Gold/Silver ratio (in the weekly bars graphic) is at a staggeringly high 86.7x? For those of you fortunate to be scoring at home, you've already calculated that were Silver instead priced today per the ratio's millennium-to-date average of 64.9x, she'd now be at 22.63, some 33% above her actual current level of 16.94. But per the like graphics for Gold, Silver's "Baby Blues" too (below left) are in full tumble whilst her per her Profile (below right) she seeks safety within the 17.00-16.80 price trap. Seems no one wants Sister Silver:
Meanwhile, centered in the Gold Stack is present price itself:
The Gold Stack
Gold's Value per Dollar Debasement, (from our opening "Scoreboard"): 2993
Gold’s All-Time High: 1923 (06 September 2011)
The Gateway to 2000: 1900+
Gold’s All-Time Closing High: 1900 (22 August 2011)
The Final Frontier: 1800-1900
The Northern Front: 1750-1800
On Maneuvers: 1579-1750
2019's High: 1566 (04 September)
The Weekly Parabolic Price to flip Long: 1533
Trading Resistance: 1488 / 1493 / 1513
10-Session “volume-weighted” average price magnet: 1475
Gold Currently: 1469, (expected daily trading range ["EDTR"]: 16 points)
The Floor: 1466-1579
Trading Support: 1466 / 1454 (the top of the "support shelf")
Le Sous-sol: Sub-1466
The Support Shelf : 1454-1434
10-Session directional range: down to 1446 (from 1517) = -51 points or -3.4%
Base Camp: 1377
The 1360s Double-Top: (1362 in Sep '17 and 1369 in Apr '18)
The 300-Day Moving Average: 1344 and rising
Neverland: The Whiny 1290s
The Box: 1280-1240
2019's Low: 1267 (02 May)
Finally as a resourse, we've rather melodramatically departed ways with the Dow Jones subsidiary "MarketWatch" by removing their "tab" from our internet browser. So much so have they morphed from hard market news to childish narrative that, to be honest, 'twas becoming a waste of time each morning to peruse their page. My late father regularly coveted the very pricey Barron's arriving on the doorstep each Saturday morning; there's no way he'd be a subscriber today. And as for Grandpa Baillie, from his UP presidential perch in New York City, were today's MW staff under his command, he'd have fired the whole lot of 'em.
What's limited in lot for the ensuing week is incoming data for the Econ Baro: just seven metrics are due, perhaps the most watched one being the Conference Board's lagging read on October's Leading Indicators, for which the consensus is -0.1%, which in turn ought not be a surprise given the Baro's downward direction last month. But don't be thwarted by what may be a namby-pamby week to grab some Gold whilst 'tis still down here in supported mode!

Mark Mead Baillie has had an extensive business career beginning in banking and financial services for two years with Banque Nationale de Paris to corporate research for three years at Barclays Bank and then for six years as an analyst and corporate lender with Société Générale.
For the last 22 years he has expanded his financial expertise by creating his own financial services company, de Meadville International, which comprehensively follows his BEGOS complex of markets (Bond/Euro/Gold/Oil/S&P) and the trading of the futures therein. He is recognized within the financial community of demonstrating creative technical skills that surpass industry standards toward making highly informed market assessments and his work is featured in Merrill Lynch Wealth Management client presentations. He has adapted such skills into becoming the popular author each week of the prolific “The Gold Update” and is known in the financial website community as “mmb” and “deMeadville”.
Mr. Baillie holds a BS in Business from the University of Southern California and an MBA in Finance from Golden Gate University.


