Gold A Go-Go Or A No-Go?


There've been quite the array of excitable headlines running across the spectrum by our great and good Gold writing colleagues these many weeks -- and rightly so -- the yellow metal (were we are year's-end today) having put in its best performance (+18.1%) since 2010 (+29.5%).
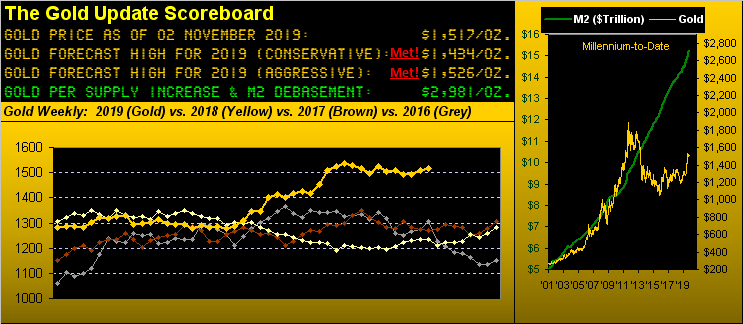
And yet from the "Au Contraire, Mon Frère Dept." in looking at the above Gold Scoreboard, price in the broad sense has the appearance of merely flatlining across the last 13 weeks (should you be so inclined to count the weekly dots on the line).
Moreover, we've penned ad nausea -- since Gold achieved our aggressive forecast high for this year back on 12 August at 1526 -- that such price has become Gold's trading centerpiece. Or some might more negatively couch it as trading resistance, because for the 58 trading days since then, Gold has settled above 1526 but 13 times and below that level 45 times, including yesterday (Friday) with price closing out the week at 1517.
Still, with 10 months plus one trading day now in the books for 2019, one can't complain about Gold's performance this year, in spite of (also per the above Gold Scoreboard) the supply-adjusted, currency-debased valuation now being 2981, nearly double present price ... and exclusive of the usual overshoot upon the inevitable regression to that "mean". But until the wee percentage of Gold owners expands, we ought accept a year like this one as pretty darn good.
To be sure, there've been ruminations of Gold tapping 1600 by this year's-end -- that'd be another +5.5% run from here -- yet there are but eight full trading weeks remaining in 2019, the technical resistance of 1526 seemingly keeping the lid on price and further fundamental impetus (beyond now being the so-called start of the "Gold buying season", let alone Gold being excessively undervalued as noted) not as yet driving new buyers to the fore. That stated, from this time a year ago into 2018's end, Gold ran up nearly 100 points (from 1192 to 1285, i.e. +7.8%); but hardly was that on the heels of a robust year to such point. Then fast-forward to just two weeks ago when we cited price as perhaps coiling to spring higher. And yet Gold's journey since then has been only from 1493 to today's 1517: not much impressive boing in that spring.
So given all of that, plus it being month's-end and one trading day, we find the order of the BEGOS Markets by their standings essentially unaltered since their end-of-September rankings, (only Copper and the Swiss Franc having meekly swapped positions). Thus again there is Gold in third place on the podium with Silver on the steps thereto. And "Oh, that Dollar strength!" which is so bandied about: what are they tawkin' about? Look at the standings, chump:

To Gold's weekly bars we go. And from one year ago-to-date, obviously the two blue-dotted parabolic Long trends have been the power moves, whilst the two red-dotted parabolic Short trends rather appear as shallow pauses. And Long or Short, they've all been lengthy, which -- should such typical duration continue for this current Short trend -- Gold ain't goin' nowhere for awhile, barring the kicking in of seasonal buying and/or coily-springy-boingy and/or "The World Ends; Dow Up 2":
What does appear on track to ending is the economy, if solely by the track of the Economic Barometer. Now obviously the StateSide headline numbers are fairly sound stuff given "much-better-than-expected" readings of +1.9% for Q3's first read on Gross Domestic Product and October's payroll data, plus prior months' upside revisions thereto. Also, September's Construction Spending improved. But the "inside-the-numbers" data isn't as pretty. For October, readings from both the Institute for Supply Management on manufacturing and the Chicago Purchasing Managers Index continued in contraction mode; the Federal Open Market Committee's favourite read of inflation -- Core Personal Consumption Expenditures -- was one big zero; and September's growth in Personal Income slowed whilst Personal Spending didn't increase its pace. As well, a fresh survey by the National Association for Business Economics indicates that business hiring is at a seven-year low ... although a key phenomenon therein is that essentially full employment is making it difficult to find folks not already working.
'Course, we did get the well-anticipated FedFunds -0.25% rate cut, now down into the 1.50%-to-1.75% target range with little outlook for anything further. Nonetheless, it all makes the stock market happy, the S&P 500 further launching to an all-time high, now at 3066. Just let's not bring up the subject of earnings: as their season for Q3 rolls along with well over half of the mighty 500 constituents having reported, 74% of them have beaten the broker's marketing tool known as "estimates", but the reality is that only 65% have "bettered" their earnings over the like period of a year ago ... never is that mentioned, (except herein). As for our "live" calculation of the Index's price/earnings ratio, 'tis at present 32.1x; (comparably, Bob Shiller's CAPE is a nearby 30.3x). And bearing in mind graphically that 'tis the red line (S&P 500) that historically finds its way to the blue line (Econ Baro), here's the year-over-year picture:
"But, mmb, money is so cheap you can borrow it to buy stock and end up way ahead..."
And Squire, that strategy has been working great -- from stock buybacks to margin jacks -- until the day it shan't. But we've witnessed even far better leverage out there as we turn to our year-over-year view of Gold's percentage track along with those of key metals equities. From this date a year ago, the S&P 500 is basically +12% (recall the 20% correction into last year's-end); you can even add in 2% for yield and that's +14%. But take a look at Agnico Eagle Mines (AEM): 'tis +63%; Franco-Nevada (FNV) is +49%; and the VanEck Vectors Gold Miners exchange-traded fund (GDX) is +43%. Other sterling performers include the Global X Silver Miners exchange-traded fund (SIL) +28%, Newmont Mining Goldcorp (NEM) +24%, and Gold itself +23%. Even oft-lagging Pan American Silver (PAAS) is +11%. (And from the "Hint Hint Nudge Nudge Elbow Elbow Dept.", the Gold/Silver ratio remains a whoppingly high 83.7x). Here's the overall graphic:
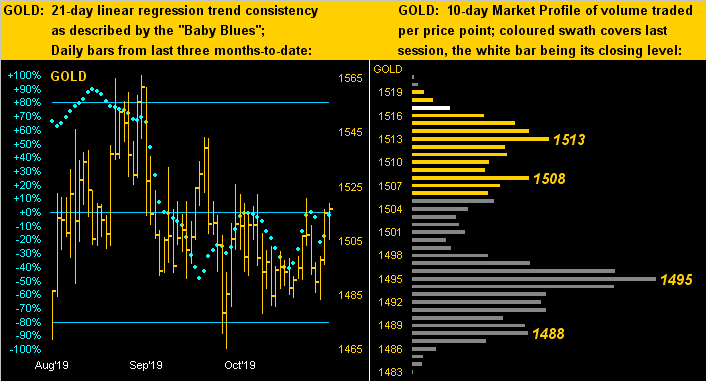
Next as we zoom in on Gold near-term we've our two-panel look at price's daily bars from three months ago-to-date on the left and the 10-day Market Profile on the right. And if Gold's baby blue dots of linear regression consistency appear completely lacking thereto, we ought not be surprised: across the panel's entirety, price is basically congested. Today, Gold is right where 'twas three months back, from which it has been up a bit and down a bit and all about a bit. That's it. Trading supports are as denoted in the Profile:
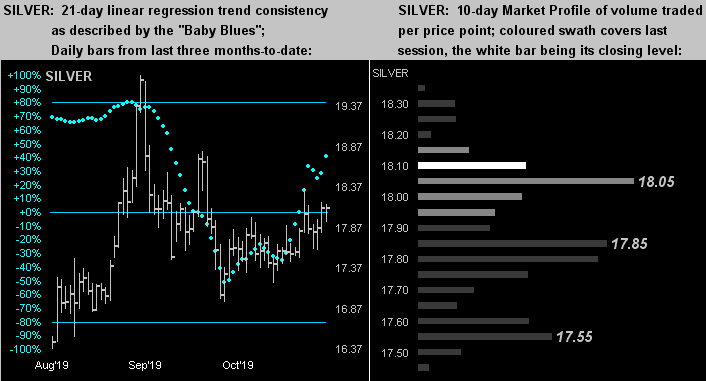
The like layout for Sister Silver places her up a bit more (at left) than is Gold, although her recent "Baby Blues" are, at best, a mess. Similarly we see her denoted trading supports in the Profile (at right):
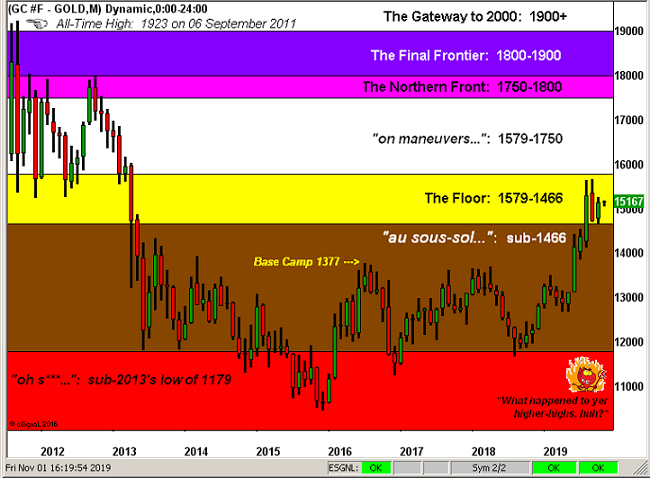
All of which brings us to our Gold Structure chart since 2011's All-Time High of 1923. (As these are monthly bars, the rightmost one is merely the one trading day we've thus far had in November). Of note, after having made higher-monthly-highs in each of June, July, August and September, Gold could not manage same for October. Also, note that October's low was right down to the base of "The Floor", but not through it; we thus take some supportive technical solace from that. Sure, 'twould be nice if Gold could press up to close out the year in the "on maneuvers" sector, but 'tis so dubbed for a reason as price therein per the leftmost portion of the graphic is simply all over the place:
So there 'tis: ten months of 2019 in the bag with two months to go; (or for Brexit, three months to go, the deadline having just been extended to 31 January: "We shan't work in December; December is a holiday"). Then call it a "holimonth". As for Gold, the year to here has been (cue The Miracles from '65) "Going to a Go-Go"; but given price stallage, congestion, and "The Fed is done" digestion, does "Go-Go" from here rather morph into year's-end as "No-Go"? Nobody knows. But broadly we know Gold's the best show! And well-worth the Gold label, that:
www.deMeadville.com
www.TheGoldUpdate.com
********

Mark Mead Baillie has had an extensive business career beginning in banking and financial services for two years with Banque Nationale de Paris to corporate research for three years at Barclays Bank and then for six years as an analyst and corporate lender with Société Générale.
For the last 22 years he has expanded his financial expertise by creating his own financial services company, de Meadville International, which comprehensively follows his BEGOS complex of markets (Bond/Euro/Gold/Oil/S&P) and the trading of the futures therein. He is recognized within the financial community of demonstrating creative technical skills that surpass industry standards toward making highly informed market assessments and his work is featured in Merrill Lynch Wealth Management client presentations. He has adapted such skills into becoming the popular author each week of the prolific “The Gold Update” and is known in the financial website community as “mmb” and “deMeadville”.
Mr. Baillie holds a BS in Business from the University of Southern California and an MBA in Finance from Golden Gate University.


