Gold Hits Our Target For The Year...Already
 Nine weeks ago as Gold closed out last year at 1061, both herein and on radio, we set a 2016 price target for Gold of "the upper 1200s", refining it to 1280 as that is the upper band of the regularly-cited "1240-1280 resistance zone". Then yesterday (Friday) at 06:55:20 Pacific Time, someone hit the offer at 1280 and "BINGO!", there 'twas. Does that mean we just kick back and relax for the remaining 43 weeks of the year? Hardly.
As still not that well-documented by the FinMedia at large, Gold's run year-to-date has been nothing short of extraordinary. That said, the ardent Gold follower might instead deem it as perfectly ordinary, given price (per the above opening scoreboard) remaining less than half what it ought be by currency debasement alone, and that Gold has simply begun its long overdue run in playing catch-up toward our true present valuation of 2545. And this year, price has already risen as much as 20.6% (from 1061 to 1281). Albeit unsustainable, such rate of increase would more than double Gold's price during 2016, and for those of you seriously scoring at home, would -- by linearly regressing the daily closes year-to-date -- give us an All-Time Closing High above 1900 come this 14 September, (just as surely as we'll elect one Premier Sanders ... so no, don't write it down). But as amazing as Gold has thus far been, amazing too was in scrolling down through three pages of a major business headlines website early yesterday morning, nary was mentioned the word "Gold" despite its having made an overnight high for the year. Perhaps that's a good thing. Either way, we're fairly wowed about it all; here are the weekly bars:
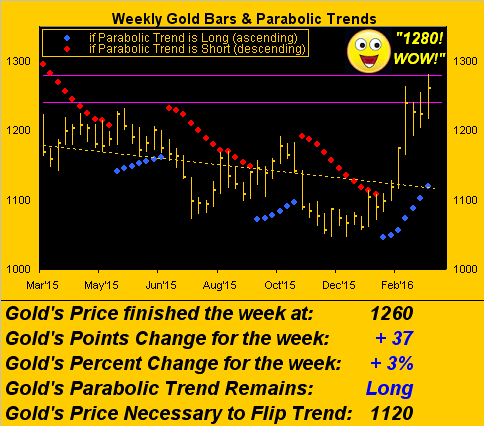
So: now do we at least know that the bottom (1045 this past 03 December) is in? Strictly by the technicals we've been touting, no. Again, here are those criteria followed by their attendant chart:
■ The weekly parabolic trend ought be Long ('tis)
■ Price ought be above the 300-day moving average ('tis)
■ The 300-day moving average itself ought be rising ('tis)
■ Price ought trade at least one full week clear above 1280 (hasn't)
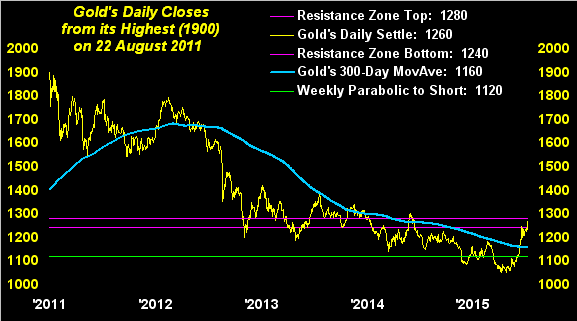
The whole bit about Gold trading "at least one full week clear above 1280" ought in turn start morphing the 1240-1280 zone from being that of "resistance" to "support", failing which the 1179 level (our dividing line between the bottom of the basement and purgatory featured in the Gold Structure chart of our month-ending missives), would become the new safety price, well-above 1045, such that then we'd take comfort that "the bottom is in". So just as Missouri is the "Show-Me State", Gold 1280 is the "Show-Me Gate".
'Course, immediately above 1280 (and I know you don't wanna hear this) come "The Whiny 1290s". Remember them? So unendingly present and unpleasant were they through 2014's seventh-month period from February through August, legend has it that many-a-Gold trader experienced sufficiently acute frustration as to have spontaneously combusted: "El Poofo!" Why over a 141-trading day run therein, 65 of those sessions (46%!) found Gold either above 1280 or below 1300. Gold's trading range was dead, finito, disparu! So prevalent were "The Whiny 1290s" that they're a regular component of The Gold Stack, which we periodically present, (as is the case near the foot of this edition).
Does this therefore portend imminent difficulty for Gold to press higher still? The ramped-up volatility of late may be hinting that 'tis. No sooner did Gold breech 1280 yesterday before 'twas summarily shoved back down. Indeed, unlike the balance of the seven other BEGOS Markets, Gold's "expected daily trading range" (EDTR) has completely blown open in recent days. This next eight-panel chart shows the EDTRs from one year ago-to-date for all eight BEGOS components. Again, these are not market directions, but instead the ranges we "expect" to see between these futures' daily extremes (high and low). Not even Sister Silver is comparatively increasing her trading range as is Gold, which is in the upper right panel:
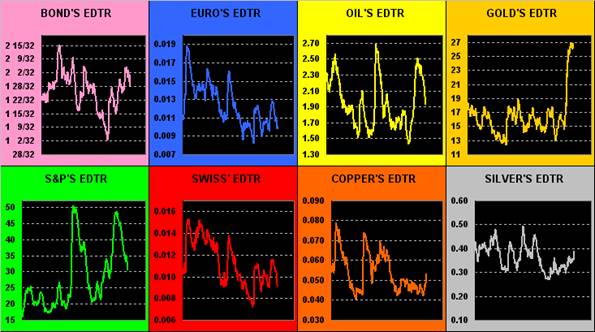
Crazy, eh? That or a flight to common-sense prudence. Either way, traders are very sensitive to this upper 1200s area given Gold's great run year-to-date, the presence of the 1240-1280 resistance zone, and the dread of "The Whiny 1290s" luridly lurking overhead. Stand by with some first aid kits as we're anticipating some serious near-term fisticuffs with Gold getting boffed about but good through here.
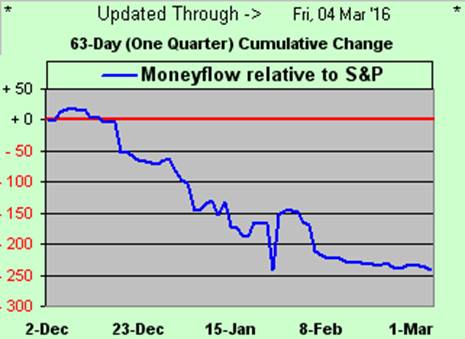
Crazy as well remains the imbalance of the S&P 500's gains (up as much as 11% from the year's low three weeks ago) compared to the Index's moneyflow when regressed into S&P points. Updating that which we showed you last week, here is the three-month differential (-241 points) between the change in the S&P and the change in its moneyflow. The present S&P level of 2000 - 241 = 1759:
"But like I've said, mmb, the economy's getting better..."
We welcome your appearing there, Squire, as predictably as a Swiss train. And to be sure, from its recent low of a month ago, our Economic Barometer has made gains notably from changes in Unit Labor Costs, Consumer Credit, Core Inflation data, Durable Orders, and in Personal Spending, as well as that for Construction.
"And jobs too, mmb!"
My dear Squire, as clearly you did not look beyond the "headline" number of 242,000 in payroll "creation", you missed the abrupt downward change in the average work week from 34.6 hours to 34.4, the largest drop in two years (since the February 2014 data): more payrolls + less hours = crap jobs, which in turn have led to food stamp recipients nearing an all-time high. Indeed as we go the Econ Baro, let's blow it out to a special three-year view, just to put all the euphoria over economic "strength" into perspective:
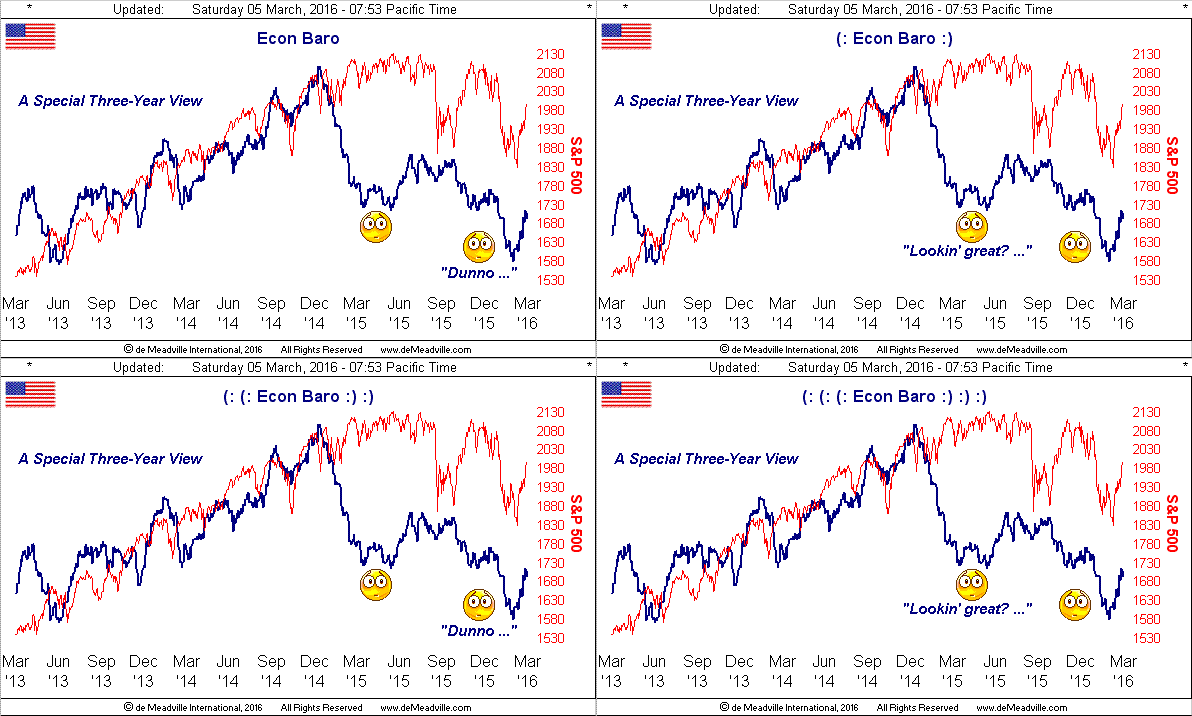
"Jeepers, mmb, that should be on TV..."
Reality is a sobering thing, Squire. So are TV ratings, so don't look for the Econ Baro to show up on your local station anytime soon. Rather, keep those "rabbit ears" pointed this way. Why even (finally) some of the FedHeads are beginning to take notice. This past Tuesday, William Dudley (New York Federal Reserve President) noted "... I have marked down my growth outlook very modestly ... [volatility] could potentially lead to a more significant downgrade to my outlook." Then on Thursday, Robert Kaplan (Dallas Federal Reserve President), whilst optimistic about the economy StateSide, is sensitive to high downside risk globally, noting that "... the Fed needs to show patience in decisions to remove accommodation ..." Might they instead eventually remove their positive FedFunds rate? TV worth watching.
Indeed on Tuesday, for the first time ever, Japan sold 10-year bonds with a negative yield, whilst across the Yellow and East China Seas, the People's Bank of China reduced the system's reserve requirement ratio, its fifth such cut in a year. Moreover, China's growth is so significantly slowing that Moody’s has just warned of downgrading the great dragon's debt rating here in the year of the monkeyshines.
Jetting further westward, we arrive in the deflating EuroZone, their European Central Bank certainly to announce further accommodation this coming Thursday, 10 March, whilst across the Channel it remains "To Brexit, or not to Brexit, what if we wrecks it?" And now add to the UK list of banking woes: Barclays (since 1690!) as they record their worst quarterly results in seven years and get "Out of Africa", --(Mirage / Universal, 1985).
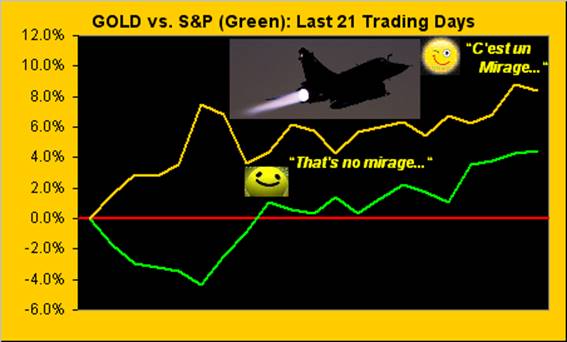
Hardly a mirage however has been Gold's unflappable resiliency, albeit it may get a bit flappy through here. Nonetheless, even in the face of a rising S&P, Gold too has surged forth. Here are their respective percentage tracks over the last 21 trading days (one month):
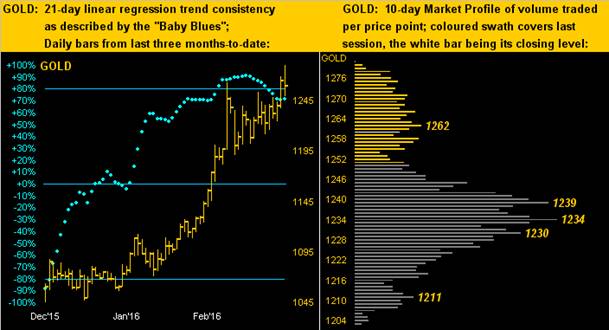
That said, as earlier inferred, we are prepared for turbulence over the near-term with Gold's having regained the 1240-1280 resistance zone. In closing out the week yesterday, Gold was thrown all about that zone, the day's low being 1250, the high 1281, and the settle zone-centered at 1260. And as we turn to the following two-panel graphic, on the left are Gold's daily bars for the past three months: note that the "Baby Blues" which measure the day-by-day consistency of the 21-day linear regression trend have crept below the +80% level; typically that would herald price retrenchment. As for Gold's 10-day Market Profile on the right, the 1230s clearly are the critical trading hold area for Gold:
Toward closing, let's now bring up The Gold Stack. 'Twasn't that long ago that Gold was near the stack's bottom. And despite the broadness of the defined overhead milestones, 'tis good to see some headway:
The Gold Stack
Gold's Value per Dollar Debasement, (from our opening "Scoreboard"): 2545
Gold’s All-Time High: 1923 (06 September 2011)
The Gateway to 2000: 1900+
Gold’s All-Time Closing High: 1900 (22 August 2011)
The Final Frontier: 1800-1900
The Northern Front: 1750-1800
On Maneuvers: 1579-1750
The Floor: 1466-1579
Le Sous-sol: Sub-1466
Base Camp: 1377
Neverland: The Whiny 1290s
Year-to-Date High: 1281
10-Session directional range: up to 1281 (from 1203) = +78 points or +6%
Trading Resistance: 1262
Gold Currently: 1260, (weighted-average trading range per day: 27 points)
Resistance Band: 1240-1280
10-Session “volume-weighted” average price magnet: 1239
Trading Support: 1239 / 1234 / 1230 / 1211
The 300-Day Moving Average: 1160
The Weekly Parabolic Price to flip Short: 1120
Year-to-Date Low: 1061
Finally, given all the groovy jet-set readers we've out there, you may have noted that the UAE-based airline Emirates has put on what is claimed to presently be the longest non-stop commercial flight: 'tis the 16-hour (easterly) / 17-hour (westerly) stint between Dubai and Auckland, a distance (as flies the crow) from threshold-to-threshold of 7,667 nautical miles (or 14,200 kilometres). So relative to Gold being quite a popular thing in both the UAE and New Zealand, Jennifer Aniston reminds us in the airline's advert that there are showers on Emirates planes: absolutely perfect for shining up your Gold bars between here and there such as to arrive at the dealer's shoppe looking ever so shiny. Now that's the only way to fly!


