Gold the Immovable Object, but to Stocks Let No One Object


 /
/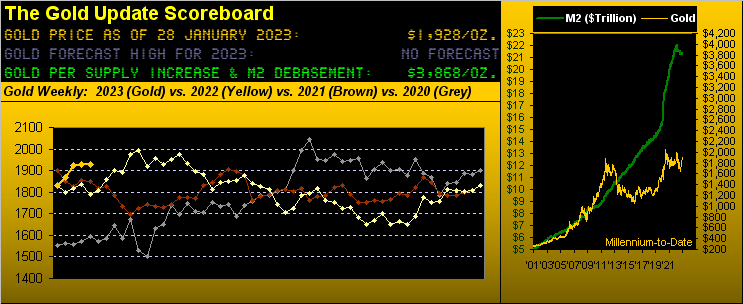
"Immovable" indeed is our Gold: having closed one week ago at (precisely) 1927.7, price settled yesterday (Friday) at 1927.6 ... the 10¢ loss of benefit only to the dastardly Short whose wealth (at $100/point/contract) thus increased by ten bucks. Lah-dee-dah.
Gold entered this past week with an "expected weekly trading range" of 54 points. The actual range came in at just 37 points, the yellow metal's narrowest trading week by both points and percentage since that ending 24 June of last year. And whilst we expect higher prices as the year unfolds, 'twould not be untoward for Gold near-term to pause and retrench a bit. For although by debasement valuation Gold today at 1928 is but half the above Scoreboard's level of 3868, price by our Market Values method (based upon Gold's price movement relative to those of the primary BEGOS Markets, i.e. the Bond / Euro / Gold / Oil / S&P) is 70 points "high". Here 'tis via Gold by the day for the past three months vis-à-vis the smooth valuation line, the lower panel being the difference between the two of +70 points. In fact, this is the longest period of time that Gold has been above its smooth valuation line since late summer 2019:
More on Gold in a bit. But with respect to "Stocks let no one object", long-time readers of The Gold Update know one of our favourite axioms is: "Change is an Illusion, whereas Price is the Truth." And does it ever apply to today's stock market as measured by the S&P 500. To wit:
The worse the economic news becomes, the higher the S&P climbs. Indeed, we're a bit dubious about this past Thursday's initial report of StateSide Gross Domestic Product for Q4 coming in at an annualized growth rate of +2.9%, considering the recent plunge in the Economic Barometer as herein dramatically depicted a week ago, (and that we'll again see below).
'Course, GDP is a result of three large tubs of paint (summarily net private investment plus net public investment, less the trade deficit) collectively thrown up against the barn wall. "Oh lookin' good, baby!" The Econ Baro, rather, is computed with some 50 distinct metrics per month and generally leads reported GDP data.
Nonetheless from this past week, along GDP growth slowing, The Conference Board's Leading (i.e. lagging) Indicators remained negative for December and Personal Spending shrank. Thus: 'twas nuthin' but up for the S&P 500 in sporting a one week gain of +2.5%.
But 'tis the rationale (or lack thereof) to buy a terribly overvalued S&P that leaves us perplexed (understatement). Why?
"It's the Pavlov's Dogs conditioning there, mmb..."
Spot on, Squire, as ostensively "the herd" knows the weakening economic metrics including the prior week's deflationary reads shall lead to the Federal Reserve slowing its FedFunds rate increases, then pausing, and then "pivoting" back down. Thus with easy money ultimately back in the balance, "the market must go higher" and hence the illusion of "Change".
But: the S&P's "live" price/earnings ratio of 39.4x is now nearly double its historical mean: that is the "Truth". Moreover, late in the trading day yesterday, the P/E reached up into "Stoopidville" as we see encircled in this live screenshot:
And you know, and we know, and everyone from Bangor, Maine to Honolulu and right 'round the world knows that always, always, always the "Truth" will out for the reckless buying of stocks without regard to valuation. (For you WestPalmBeachers down there, that means the stock market is primed for one heckova fall). The S&P is today priced at 4071. Morgan Stanley already is well on the record of it reaching down this year to 3000. We anticipate sub-3000. The P/E reverting to its historical mean (22.4x) suggests -- were there no growth in earnings -- 2313. Worse, a re-test of the COVID low? 2192, (from which the S&P then more than doubled in just 22 months in the Fed's funding flood).
Regardless, are earnings growing? Thus far for Q4, 123 S&P 500 constituents have reported: only 57% of those bettered their earnings from a year ago; which means 43% of the world's wealthiest Index constituents haven't grown. Not a healthy growth picture there, indeed ranking fifth-worst across the past 23 quarters. Oh yes, there is some earnings growth: the median year-over-year improvement is +5% ... but to get the P/E back in line with its historical mean, earnings growth bluntly need be +75% to support today's S&P at 4071. (All that, just in case you're scoring at home; pause to breathe).
So a month into 2023 and the never-ending pricing of Gold being half what it "ought be" and that for the S&P being double what it "ought be", let's look at the Big Picture via our standings of the BEGOS Markets just two trading days shy of completing the year's first month, with Cousin Copper leading the pack:
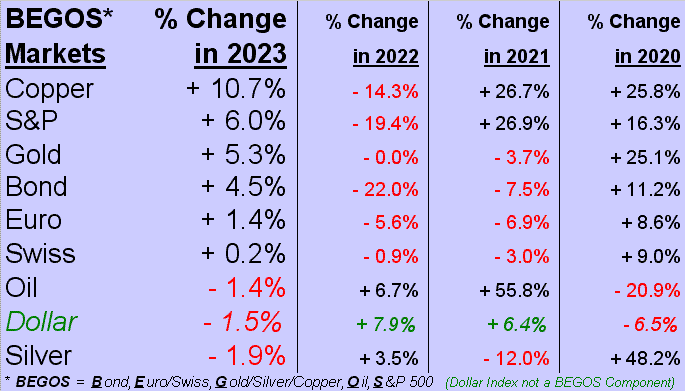
'Course, the eyebrow raiser in the above standings is Gold's being +5.3% ... but Silver's being -1.9%. Which is why at the foot of the next graphic we find the Gold/Silver now up to 81.2x (versus this century's mean of 67.3x). And as for Gold's weekly bars and their parabolic Long trend stretching ever higher, price just recorded its ninth consecutive "higher-low", the 22-year record being 10 consecutive weeks; but as earlier inferred, be wary of this performance running out of puff near-term:
Also bear in mind as well that come Monday, Gold gets a 16-point premium boost as trading volume rolls from the February contract into that for April.
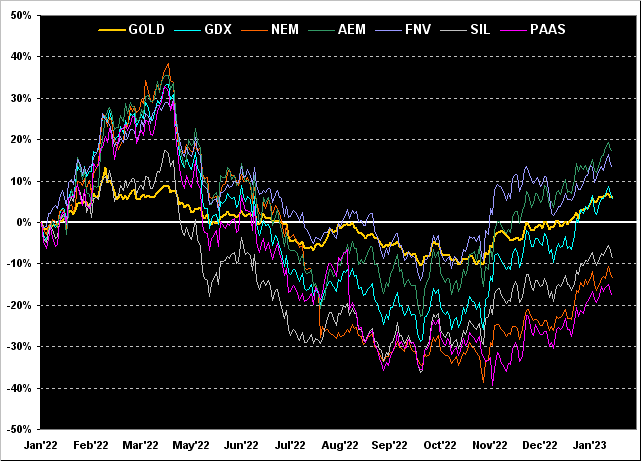
Meanwhile, we've finally some Gold equities having outpaced the yellow metal on the upside. Per the percentage tracks shown below from this time a year ago we've: Agnico Eagle Mines (AEM) +17%, Franco-Nevada (FNV) +13%, Gold itself +6%, the VanEck Vectors Gold Miners exchange-traded fund (GDX) +5%, the Global X Silver Miners exchange-traded fund (SIL) -9%, Newmont (NEM) -14% and Pan American Silver (PAAS) -18%. The equities' leverage is exemplified across the entire graphic by how little amplitude there is for Gold itself:
As to the aforementioned Econ Baro, here's its latest stance with a net boost from the past week's incoming metrics despite some of the noted disappointments. Like we say: "Others parrot, we do the math":
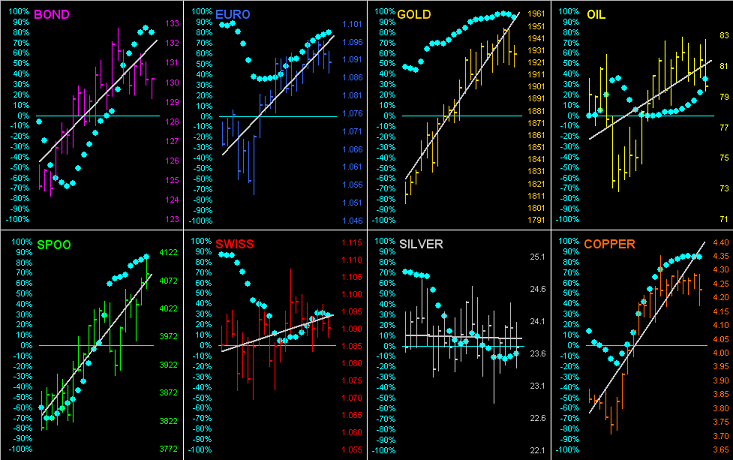
And speaking of moving in the right direction, if one has recently been Long the bulk of the BEGOS Markets, one has done well across the past 21 trading days (one month) as we go 'round the horn, every component (save for Silver) sporting a positive linear regression trendline, with the baby blue dots depicting the consistency of those trends. 'Course when "they're all goin' up", you know the Dollar's been goin' down:
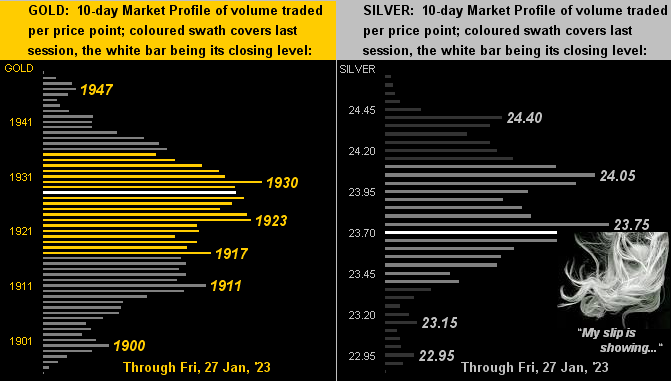
Specific to the precious metals, here next are the 10-day Market Profiles for Gold on the left and Silver on the right. Note that Gold finally has left the lofty perch it had secured in recent weeks such that 'tis now more centered in the Profile, whilst Sister Silver has slipped below trading resistance, prices as labeled:
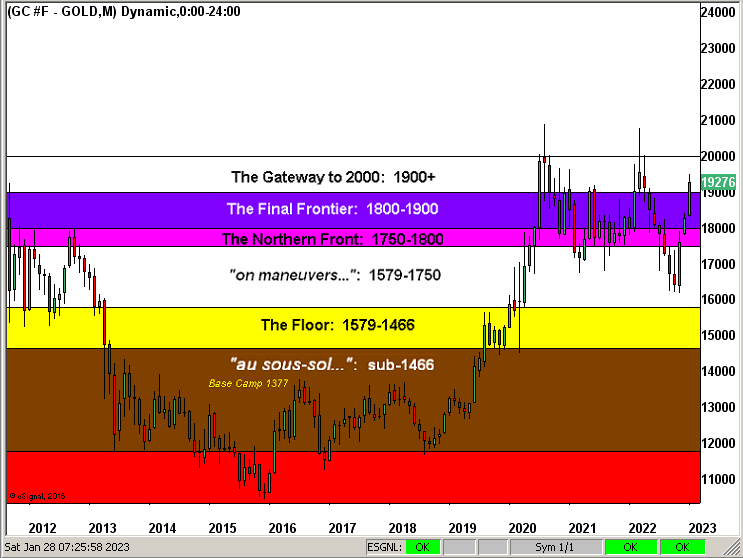
And as part of the January wrap we go to Gold's layered Structure by the month for better than 11 years. Therein we see Gold having yet again taken both The Northern Front and Final Frontier ... but as you well know, Gold has a hankering to give back gained ground. Yet once above that double top (2089 in 2020 and 2079 in 2022) the sky is high:
Ahead of a key week which includes the Federal Open Market Committee's Policy Statement on Wednesday to nudge FedFunds up another 0.25%, plus January's jobs data on Friday, we read that President Biden is interviewing candidates for the lead position at the National Economic Council. 'Tis said his lean is toward FedViceChair Lael "The Brain" Brainard, a smart and sensible choice, especially as -- according to the Washington University (St. Louis) Economics Department -- men making the most money are said to be reducing the number of hours they work. So go, Joe, with style and choose Lael!
Choose Gold too!
...m...
www.deMeadville.com
www.TheGoldUpdate.com
********

Mark Mead Baillie has had an extensive business career beginning in banking and financial services for two years with Banque Nationale de Paris to corporate research for three years at Barclays Bank and then for six years as an analyst and corporate lender with Société Générale.
For the last 22 years he has expanded his financial expertise by creating his own financial services company, de Meadville International, which comprehensively follows his BEGOS complex of markets (Bond/Euro/Gold/Oil/S&P) and the trading of the futures therein. He is recognized within the financial community of demonstrating creative technical skills that surpass industry standards toward making highly informed market assessments and his work is featured in Merrill Lynch Wealth Management client presentations. He has adapted such skills into becoming the popular author each week of the prolific “The Gold Update” and is known in the financial website community as “mmb” and “deMeadville”.
Mr. Baillie holds a BS in Business from the University of Southern California and an MBA in Finance from Golden Gate University.


