Gold Investors: All Eyes On The Striking Implications Of The 2012-2013 To Now Link


Gold has apparently turned the corner and we were not surprised by the upside move. However, there is more to this than meets the eye. Today, we’ll interpret this upswing, the expectations it carries and set it all in the larger context. Yes, it’s time to discuss the striking similarity and implications of the 2012-2013 – now link in gold. Its meaning and the likely path forward for the yellow metal. Would it justify going long gold? If so, then when and based on what? We want you to be as prepared as we are - it’s high time.
Last Monday we outlined the breathtaking similarity between what’s happening now and what happened in 2012 and 2013. The similarity is based not only on what happened in gold and multiple details that we can notice on gold’s chart. There’s much more to this analogy than just the gold market. Silver’s price moves and details regarding it (even the recent triple-top formation) as well as the way in which the mining stocks moved lower (and – at times – higher) provide multiple confirmations of the existence of the 2012-2013 – now link. The long-term analogy is likely to have long- and medium-term implications. However, there is still a good chance that gold is going to repeat its previous moves also over the short term. While the history doesn’t have to repeat itself to the letter (it barely ever does), it could rhyme to the extent that makes forecasting gold’s price swings in the short-term much easier. These are the details that we will focus on in today’s analysis.
But first, let’s look at what happened from the weekly point of view – after all, a weekly reversal appears to be a huge deal. But is it really?
The Apparent Bullishness of Gold’s Reversal
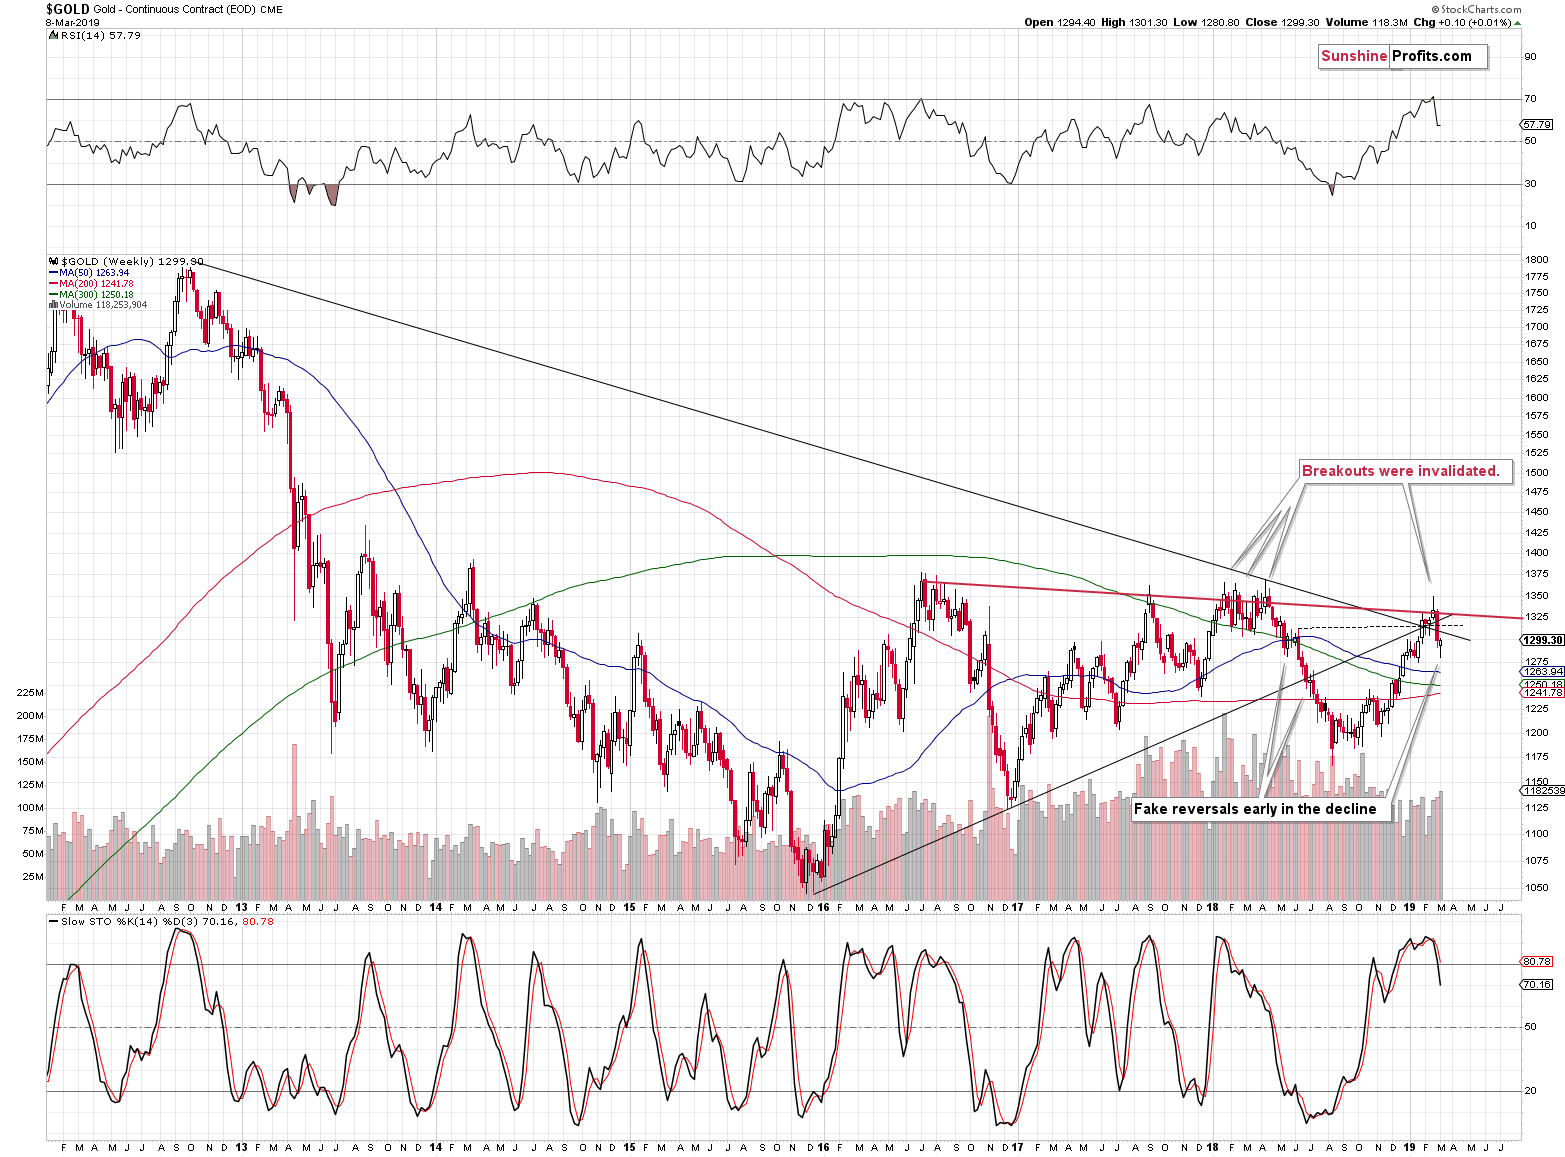
It’s bullish on a stand-alone basis, but comparing last week’s reversal to the most similar moves form the recent past – the mid-2018 reversals – suggests otherwise. The early-May 2018 reversal and the early-July 2018 reversal were both just pauses within the broader decline. The weekly reversals were followed by only slightly higher prices and then by much bigger declines. It seems to have been a better choice to simply have waited out the tiny (from the medium-term point of view) corrections than chase the market higher. That proved to be a very tricky business.
On the bullish note, last week’s reversal was confirmed by significant volume, which adds to its credibility.
Should we therefore take last week’s candlestick regular implications into account, or should we pay attention to the most recent analogy? Should we view it as bullish or bearish? Both interpretations have their merits, so it seems prudent to view last week’s performance as neutral. This means that it didn’t change the very bearish implications for the next several months.
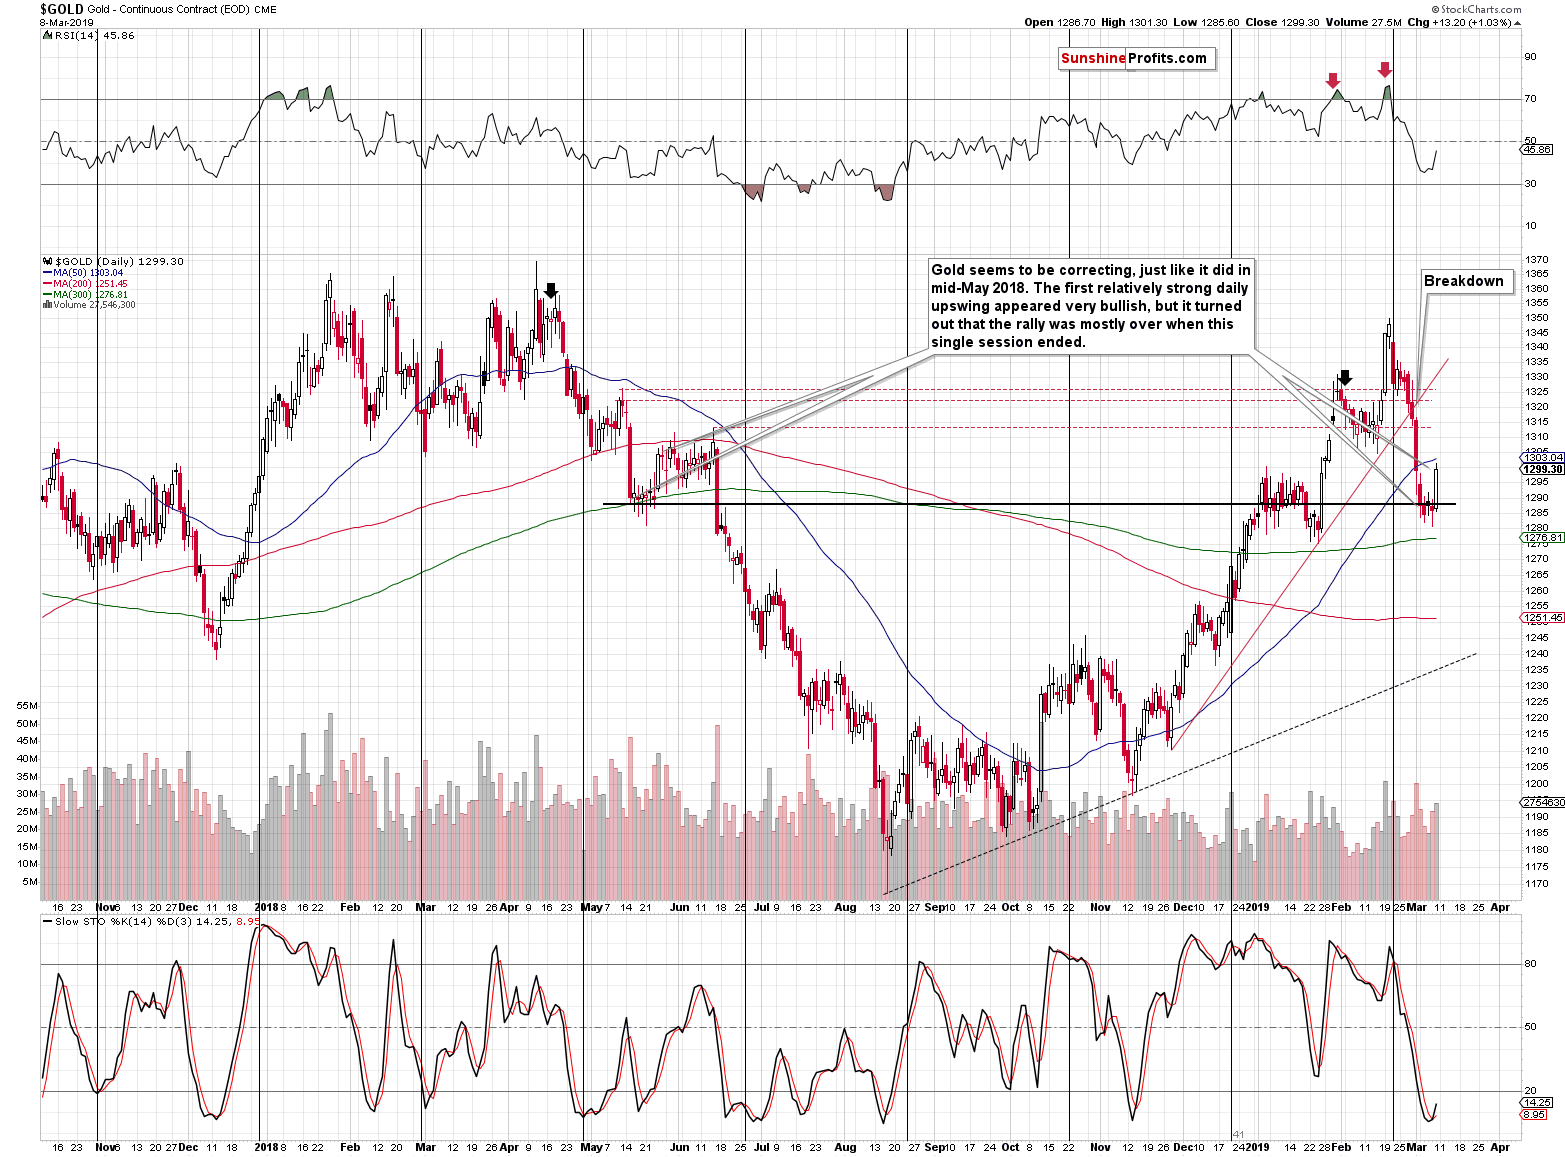
On Friday, we wrote that gold prices could move to about $1,310 or so, and it moved to about $1,300 – the previous highs. It also closed the day below the 50-day moving average, which – as you’ll soon see – is an important clue. So far nothing unexpected took place on the gold market front.
With or without fanfare, let’s move to the key details of the 2012-2013 – now link.
The 2012-2013 – Now Link in Gold
A technical pattern can be defined by a specific price action formations across many asset classes, or it can be based on similarity to previous price actions within the same instrument. This is called a self-similar pattern. Here, the similarity is indeed breathtaking between both periods. It’s huge when looking at it from the medium-term point of view. What is striking, however, is that we see a lot of similarity between gold’s final upswing before the big slide and the most recent upswing. And the same goes for the very initial part of the decline. This means that the decline could repeat itself to a degree more precise and bigger than one might expect.
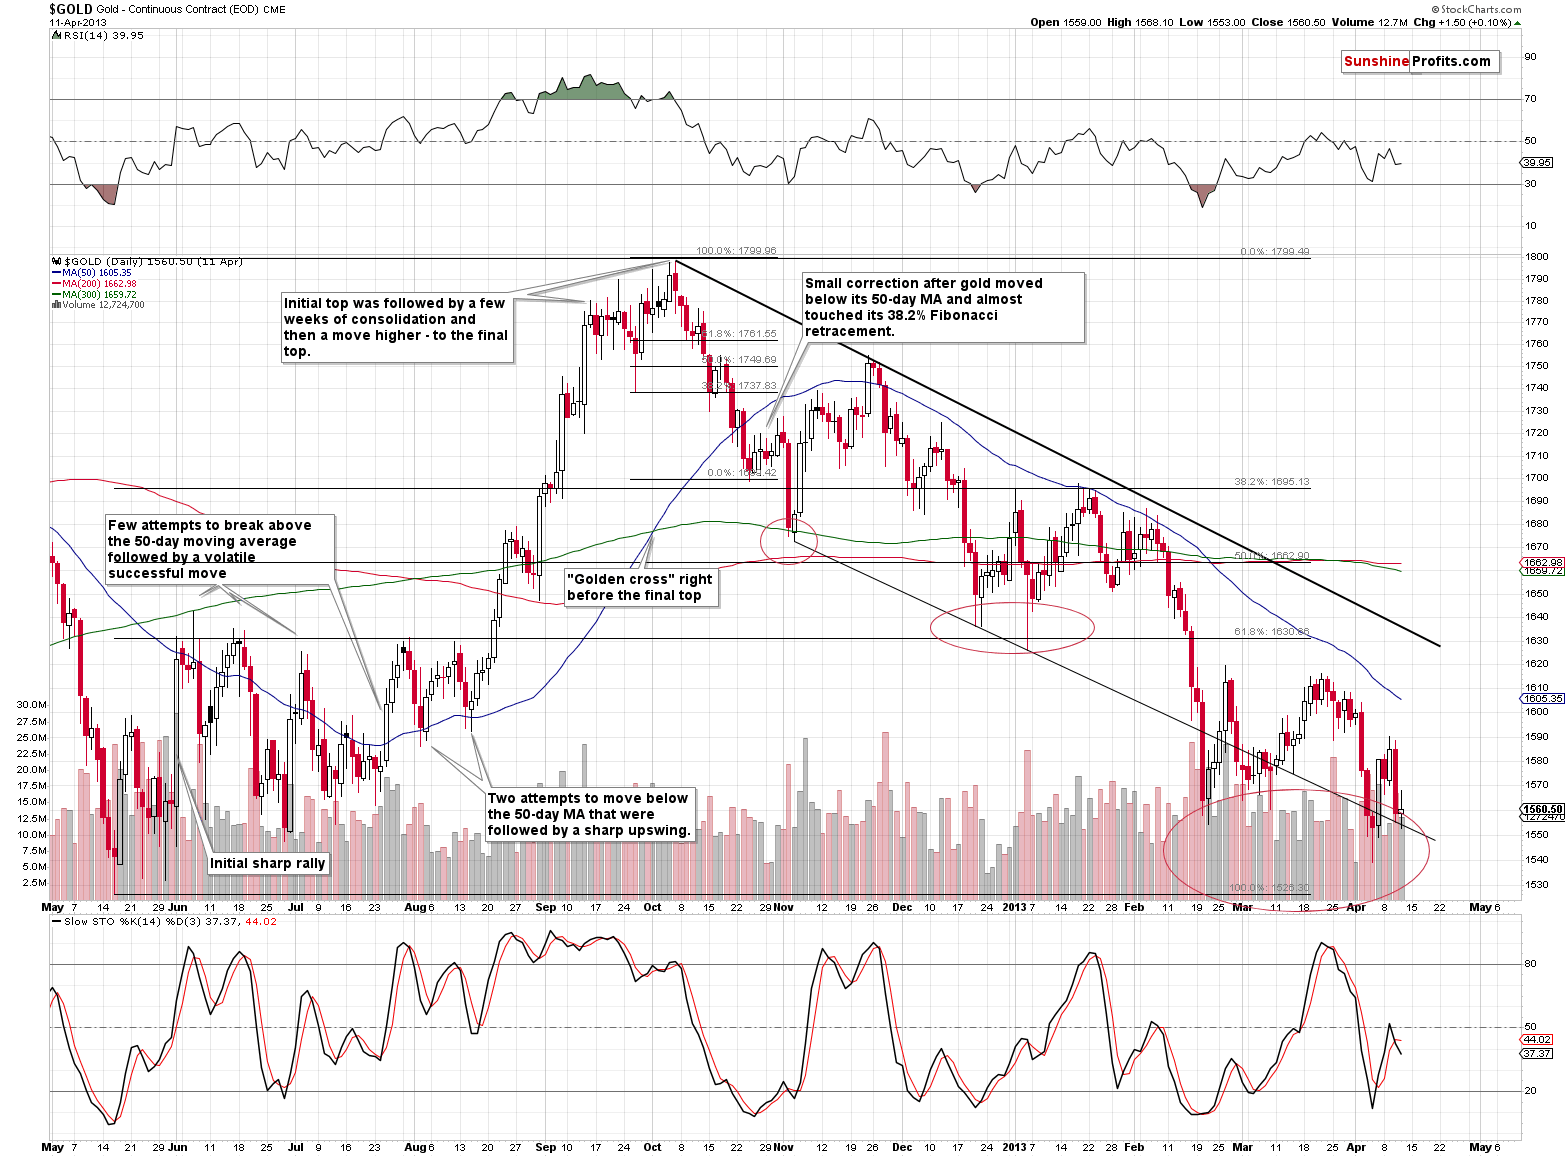
Before moving to implications, let’s take a look at how similar the recent rally was to the one that we saw in mid-2012.
Both rallies started in a sharp manner – gold soared and then tried to break above the 50-day moving average for a few times. In both 2012 and 2018, it managed to do so – in a sharp manner – only several failed attempts. Once the 50-day MA was broken, gold moved briefly below it twice, forming higher highs. The last highs were formed in mid-August 2012 and in late-November 2018. Then gold rallied in a rather sharp manner.
There were a few pauses and gold topped in a similar manner on both occasions: there was an initial top in early September 2012 and in late January 2019, then a few weeks of temporarily lower prices and a volatile move higher – to the final top.
That’s exactly what we saw before the October 2012 and February 2019 tops.
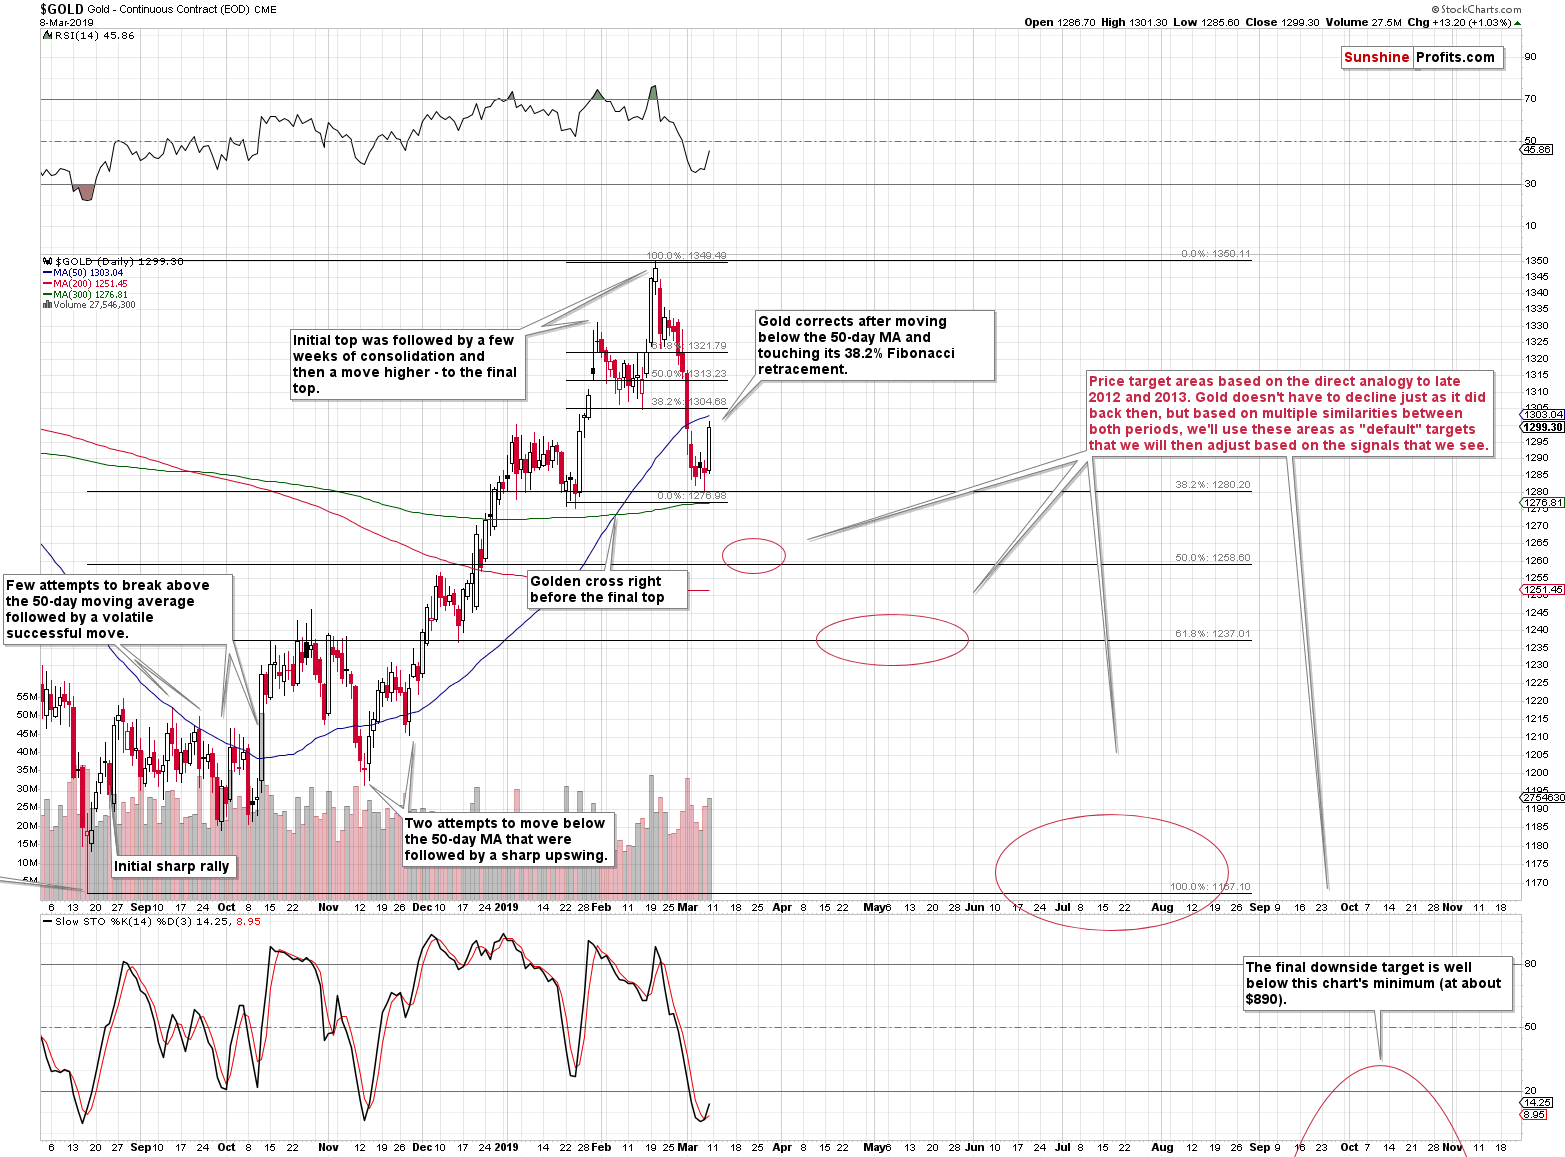
In both cases, gold then declined below its 50-day moving average and that’s when we saw the first notable correction. Gold corrected after moving approximately (!) to the 38.2% Fibonacci retracement based on the previous rally and to the Fibonacci price extension based on the recent top and the preceding low. In 2012, gold moved to the price extension and almost to the retracement, and this time, it moved right to the retracement and almost to the price extension.
The correction that followed in 2012 wasn’t particularly significant as gold didn’t manage to move back above the 50-day moving average and it didn’t move back above the previous short-term lows. That’s more or less where gold is right now. It moved toward the 50-day moving average and the previous lows, but it didn’t reach them.
Based on the above-mentioned analogy alone, it seems that gold is unlikely to move much higher. Instead it’s likely to decline once again – to the previous high – before correcting and moving higher in a more meaningful way. At this time, the short-term target is even clearer because the previous (early December 2018) high corresponds to the 50% Fibonacci retracement based on the previous upswing. There’s one more interesting thing – in 2012, gold declined below the initial low by approximately as much as it had first corrected. Assuming that gold is going to decline shortly and doesn’t move above $1,300 (or the move is just a few dollars at most), this will perfectly fit the 50% Fibonacci retracement as the next downside target.
We might even temporarily go long gold if it moves to this level (about $1,260), provided that we see enough bullish confirmations from other markets.
Still, there is also the possibility that the history will not repeat itself to the letter and that gold will move above the 50-day moving average right away – just like it did in late November 2012. If this is the case, then we will likely not have any meaningful comeback once gold moves close to $1,260, as the above would imply that the bigger corrective upswing in gold had already taken place.
For now, the former scenario is more probable, but we are keeping our eyes open for signs that would confirm the latter.
Either way, the next support levels would be provided by approximately the $1,237 level (the 61.8% Fibonacci retracement based on the previous rally) and the 2018 lows (approximately $1,160). Gold could correct after reaching these levels and none of such short-term upswings should be interpreted as the end of the big decline. Back in 2012 and 2013, the analogous moves were just the local ones that preceded the true plunge.
Does this mean that gold definitely has to rebound from the above-mentioned price levels? No, the situation in the USD Index is different today and thus gold might react in a different manner, for instance by declining much earlier and in a more volatile manner. However, the above gives us a great default indication regarding the likely next gold price moves. Instead of determining the prices moves from scratch, we can use these default targets and adjust them upward or downward based on what kind of signals and confirmations we get along the way.
This is what we see based on the technicals. You have already seen the peculiarities of the gold price forecasts when you followed the link at the very start of this article. Also, take a good look at our Gold Trading Tips. Enjoy the insights and make good use of them!
Summary
Summing up, it’s almost certain that the next big move lower has already begun and that the 2013-like slide is in its early stage. Based on the updated version of the 2013-now link, the implications are even more bearish than we had initially assumed. The downside target for gold remains intact ($890), and the corrective upswing that we just saw seems to be rather natural part of the bigger move lower – not a beginning of an important move higher.
We hope you enjoyed today’s analysis, and we encourage you to sign up for our free newsletter. You’ll be updated on our free articles on a daily basis, and you’ll get access to our premium Gold & Silver Trading Alerts for the first 7 days as a starting bonus. And yes, it’s free. Sign up today.
Thank you.
Przemyslaw Radomski, CFA
Editor-in-chief, Gold & Silver Fund Manager
Sunshine Profits - Effective Investments through Diligence and Care
* * * * *
All essays, research and information found above represent analyses and opinions of Przemyslaw Radomski, CFA and Sunshine Profits' associates only. As such, it may prove wrong and be a subject to change without notice. Opinions and analyses were based on data available to authors of respective essays at the time of writing. Although the information provided above is based on careful research and sources that are believed to be accurate, Przemyslaw Radomski, CFA and his associates do not guarantee the accuracy or thoroughness of the data or information reported. The opinions published above are neither an offer nor a recommendation to purchase or sell any securities. Mr. Radomski is not a Registered Securities Advisor. By reading Przemyslaw Radomski's, CFA reports you fully agree that he will not be held responsible or liable for any decisions you make regarding any information provided in these reports. Investing, trading and speculation in any financial markets may involve high risk of loss. Przemyslaw Radomski, CFA, Sunshine Profits' employees and affiliates as well as members of their families may have a short or long position in any securities, including those mentioned in any of the reports or essays, and may make additional purchases and/or sales of those securities without notice.
 Przemyslaw Radomski, CFA, is the founder, owner and the main editor of SunshineProfits.com. You can reach Przemyslaw at: http://www.sunshineprofits.com/help/contact-us/.


