Gold Loses Its Grip, Silver Triples The Slip


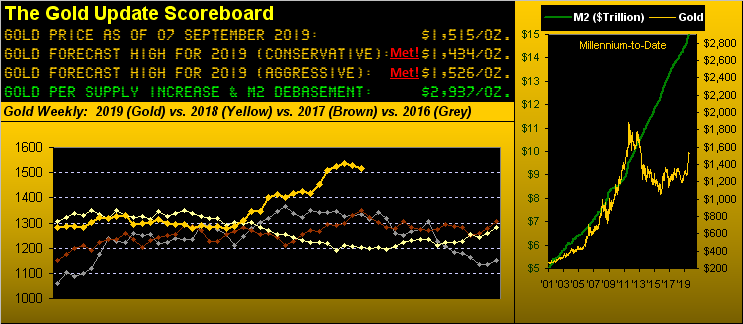
In starting with the above Gold Scoreboard, price settling out the week yesterday (Friday) at 1515 finds it back below our achieved "aggressive" forecast high of 1526 for this year. Still, with nearly four months and Federal Reserve Open Market Committee Follies in 2019's balance, plus edge-of-the-seat TariffTricks, let alone with-or-without-Boris Brexit, Gold's actual high year-to-date of 1566 may yet well be eclipsed.
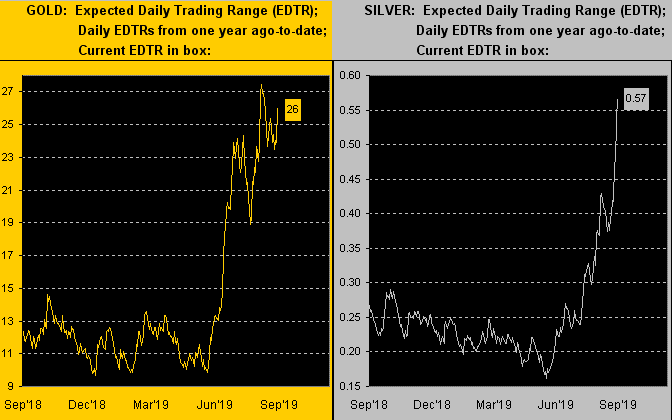
Having that gripped, let's revisit a Gold Update quip: "Live by the volatility; die by the volatility." And with the precious metals at long last getting their overdue notice as this year has unfolded, so has ensued ramped-up trading volatility. The following graphic shows us from one year ago-to-date for Gold on the left and Silver on the right their respective day-to-day EDTR: "Expected Daily Trading Range". And from the narrowness of just four months ago, Gold's EDTR now of 26 points per day is 'round double what 'twas prior to June, whilst that for Silver of 0.57 points per day is triple. And as a valued reader of ours would be quick to add, the leverage of the miners would be off this chart! Here 'tis:
'Course, volatility is bi-directional for price. And given how well Silver has been doing of late, just imagine our surprise when -- from the end-of-day work this past Tuesday -- up popped our table as such:

"A bug in the system, mmb?"
Seriously, Squire, with all the committed years you've been with us? But it did "bug" us at first. Still, true to our readers, we duly penned the following early in Wednesday's Prescient Commentary: "...despite Silver being higher (+0.2%), its "Baby Blues" have joined those for Gold in slipping below the key +80% axis, such rule being a harbinger of lower price levels near-term..."
And then "WHAM!" it happened. From trading as high on Wednesday at 19.750 -- Silver's highest print in nearly three years (since 30 September 2016) -- come Friday the price had fallen to 18.045 for a two-day plunge of -8.6%. "OUCH!" 'Twas nearly triple that of Gold's -3.5% drop across the same time stint.
Further, (this from the "Smart Alec Hindsight Dept."), a single Silver contract shorted at Wednesday's opening price of 19.350, in then marking that to Friday's settle of 18.270 (at $5,000/point/contract), is a downside gain of $5,400 -- which on initial margin of $4,510 is a two-day yield of 119%. Not that we recommend playing in that space: but it sure beats the snot outta tyin' up yer dough for 30 years at a measly 2% yield, non? Crazy.
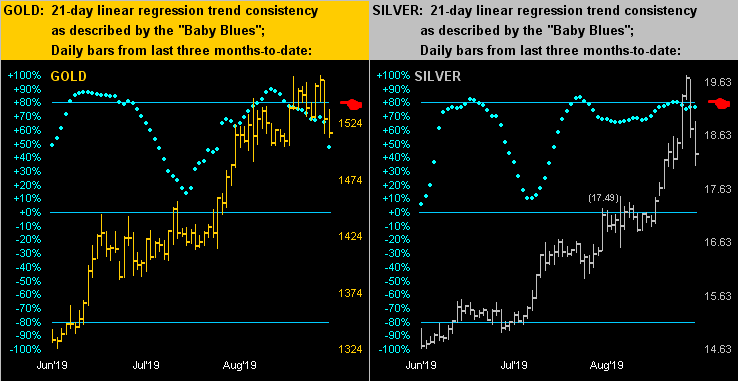
Graphically, here's what triggered Silver's "SELL" in the above table. Below is our familiar two-panel view of the precious metals daily bars across the past three months-to-date for Gold at left and Silver at right. Silver's baby blue dots of 21-day linear regression trend consistency this past Tuesday slipped beneath their +80% axis (red arrow), as had more than a week earlier did those for Gold, (then accelerating notably lower yesterday). To be sure, Gold and Silver have been as firm as ever these past three months, but rather than the exception, 'tis the rule to be wary in the presence of such technical adversary. And specific to Silver, we see no structural support on her panel until the mid-August peak down at 17.49:
Turning to Gold's weekly bars from a year ago-to-date, we find price having settled all but on its low for the second week in a row. Hardly is that a positive harbinger as, (without dragging you through all the math), when back-to-back weekly "near low closes" have occurred in recent years, sufficiently lower prices have traded in the ensuing few weeks such that -- barring Gold putting in a sound up move next week -- the present parabolic Long trend likely flips to Short by month's end:
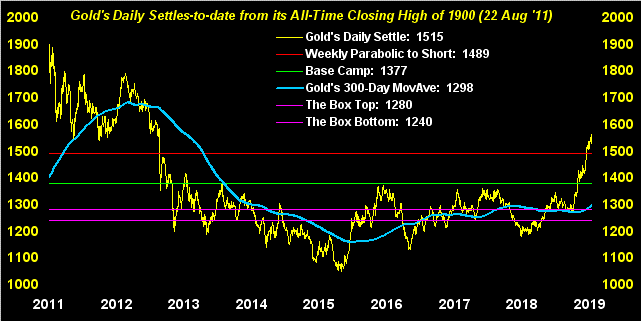
Moreover from our remindful "Nothing Goes Up In A Straight Line In Perpetuity Dept." as we next view Gold's daily settles from its All-Time High through today, in this visual context, Gold has been going up in a straight line for almost four months. What again was the name of that department? But if yer a Gold Bull, ya gotta love the look here, a near-term downside reversal notwithstanding:
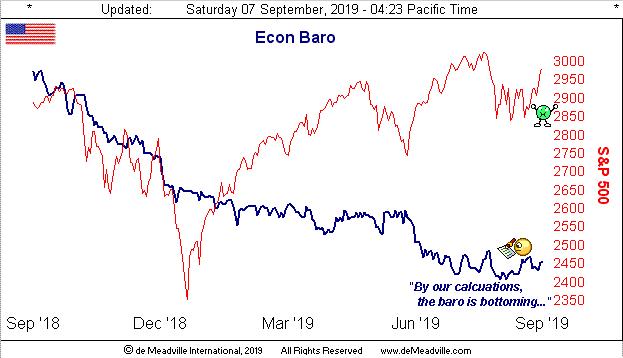
And how about the look here: the Economic Barometer is notably flattening rather than declining. That's the good news, the bad news being that the red line (S&P 500) has yet to lurch down to meet the graphed level of the Econ Baro as inevitably always -- at least has -- happened in the past. The great levitation of the stock market continues, the excuse being that low, let alone zero, interest rates can accommodate an ever-excessively high "live" S&P 500 price/earnings ratio of 35.5x, (Bob Shiller's CAPE at present being 29.9x). The media jumped all over both slower payrolls growth in August and the sub-50 slump in the Institute for Supply Management's Manufacturing Index. Ignored however were the same entity's marked rise in its Services Index, the increase in Hourly Earnings, July's turn-around from decreasing to increasing Construction Spending, and that month's leap in Factory Orders. Here's the resulting Baro:
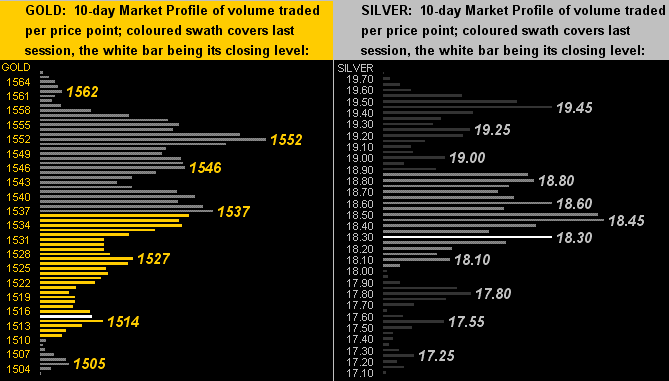
As for the precious metals' most dominantly-traded prices over the past fortnight, here are the 10-day Market Profiles for Gold (left) and Silver (right). And yes, 'tis "overkill" as to the number of denoted price levels, which is what happens when trading in the aforementioned increasing EDTR conditions becomes more and more herky-jerky. But to filter it all out, Gold clearly has fallen below what was the heavily-traded 1552-1537 swath, whilst Silver is scrabbling for grip at the base of her 18.80-18.30 strip. Plenty of room to get faked-out here in either direction:
Fake of late as well are forged bars of gold-plate falsely engraved with prestigious Swiss Gold-refiners' names. 'Twas recently reported that there are at minimum 1,000 of these kool kilo fakes for which forgers have been on the take. So beware of purchasing such phony plate! Indeed, if you've being looking for an excuse to visit beautiful Switzerland, 'tis an opportunity to go and buy direct: for 'tis real Gold that you want to hold!

Mark Mead Baillie has had an extensive business career beginning in banking and financial services for two years with Banque Nationale de Paris to corporate research for three years at Barclays Bank and then for six years as an analyst and corporate lender with Société Générale.
For the last 22 years he has expanded his financial expertise by creating his own financial services company, de Meadville International, which comprehensively follows his BEGOS complex of markets (Bond/Euro/Gold/Oil/S&P) and the trading of the futures therein. He is recognized within the financial community of demonstrating creative technical skills that surpass industry standards toward making highly informed market assessments and his work is featured in Merrill Lynch Wealth Management client presentations. He has adapted such skills into becoming the popular author each week of the prolific “The Gold Update” and is known in the financial website community as “mmb” and “deMeadville”.
Mr. Baillie holds a BS in Business from the University of Southern California and an MBA in Finance from Golden Gate University.
More from Gold-Eagle


