The Gold Market: Is It Weird to Have Two Corrective Upswings Instead of One?


Here's how history rhymes in the precious metals market and what we can glean from recent movements in gold, silver, and mining stocks.
History tends to repeat itself. Not to the letter, but in general. The reason is that while economic circumstances change and technology advances, the decisions to buy and sell are still mostly based on two key emotions: fear and greed. They don’t change, and once similar things happen, people’s emotions emerge in similar ways, thus making specific historical events repeat themselves to a certain extent.
For example, right now, gold stocks are declining similarly to how they did in 2008 and in 2012-2013.
This is an extreme underperformance of gold stocks, similar to what we saw in 2013 before the worst of the slide. This is an extreme underperformance of gold stocks – something that we’ve also seen in 2013 before the biggest part of the slide.
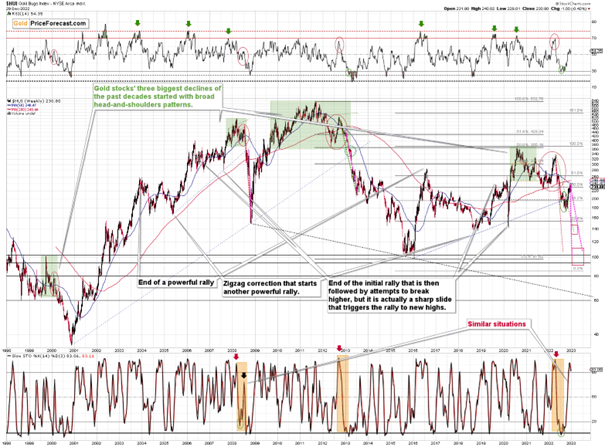
For many months, I’ve been writing that the situation in the HUI Index is analogous to what we saw in 2008 and in 2013. Those declines were somewhat similar, yet different, and what we see now is indeed somewhere between of those declines – in terms of the shape of the decline.
At first, the HUI Index declined just like it did in 2013, and the early 2022 rally appears to be similar to the late-2012 rally. However, the correction that we saw recently is also similar to the late-2012 rally.
Is it really that strange that we now have two corrective upswings instead of one, given that history does not repeat itself to the letter but rather rhymes? Not necessarily.
This is especially the case given that the 2008 decline had one sizable correction during the big decline. It’s not clearly visible on the above chart due to the pace of the 2008 slide, but it’s definitely there. You can see it more clearly in one of the below charts.
So, no, the recent rally is not an invalidation of the analogies to the previous patterns, it continues to rhyme with them in its own way. And the extremely bearish implications for the following months remain intact.
How low can the HUI Index fall during the next big downswing?
As is the case with gold and silver, a move back to the 2020 lows is definitely in the cards. Please note that this level is also strengthened (as support) by other major lows: the 2019, 2014, and 2008 ones.
However, I wouldn’t rule out a move even lower on a temporary basis. If gold were to decline to about $1,450-1,500, it would mean that it would double its current 2022 decline. If the HUI Index does that, it will move below 150.
So, all in all, 100-150 is my current target area for the upcoming slide in the HUI Index.
All right, let’s zoom in and see how mining stocks declined in 2008.
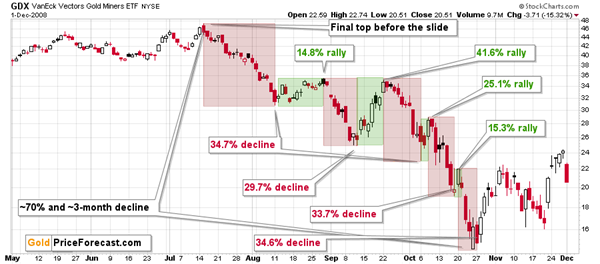
Back then, the GDXJ ETF was not yet trading, so I’m using the GDX ETF as a short-term proxy here.
The decline took about 3 months, and it erased about 70% of the miners’ value. The biggest part of the decline happened in the final month, though.
However, the really interesting thing about that decline – that might also be very useful this time – is that there were five very short-term declines that took the GDX about 30% lower.
I marked those declines with red rectangles. After that, a corrective upswing started. During those corrective upswings, the GDX rallied by 14.8-41.6%.
Do you know now how much the GDX ETF has rallied from its September 2022 bottom? It moved up by 41.7%. This means that the move higher now is practically identical with the corrective (!) upswing that we saw in September 2008. The analogy was not broken – it remains intact, and it points to much lower prices in the future.
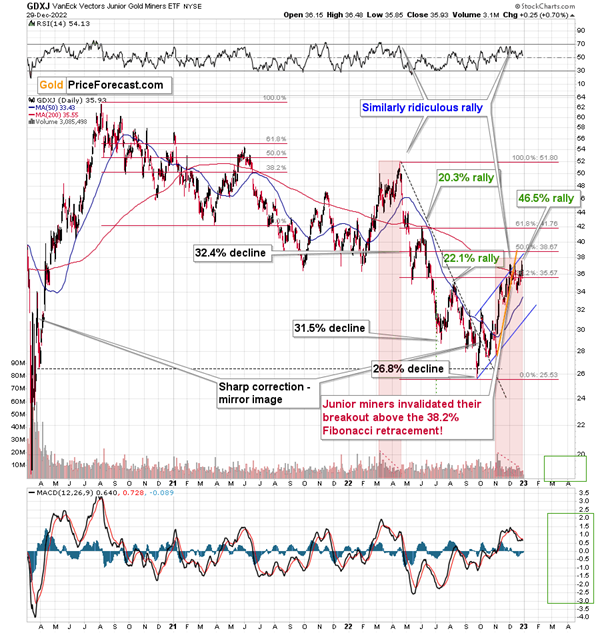
Just like gold, the GDXJ invalidated the breakout above its 38.2% Fibonacci retracement a few times, and now it also broke below the rising, short-term support line (marked with orange).
This is a powerful, bearish combination of factors, especially that miners were the first to decline – gold followed, while silver was still showing strength.
Yes, miners are now once again slightly above the 38.2% Fibonacci retracement, but since the previous attempt was invalidated shortly and miners are now practically ignoring gold’s rallies, it’s extremely likely that this small breakout will be invalidated as well.
Please keep in mind that the above comes on top of the analogy that I marked with red rectangles, and my previous description thereof remains up-to-date:
The current upswing continues to be similar to what we saw in March and April earlier this year. On the above chart I named both rallies “ridiculous” – I did so as what we see now is contrary to what’s happening in the real interest rates, and it appears that it’s the general public that’s pushing the prices higher now.
Technically, one could say that the GDXJ formed an inverse head and shoulders pattern (the early September bottom being the left shoulder and the mid-October bottom being the right shoulder), which was just completed.
Just as the March – April rally ran its course on declining volume, we saw the same thing recently. Even the RSI was slightly below 70 at the April top, just like it was recently.
Speaking of analogies, earlier today (and yesterday), I discussed the analogy to mid-2021. The GDXJ’s performance also supports this link. Back then, junior miners had corrected a bit more than half of the preceding decline before sliding again, and this time, they corrected a bit less than half of the preceding decline.
Interestingly, after the mid-2021 correction, the pace of the decline picked up, and miners declined almost twice as fast. And yes, this could happen in the following months as well.
And yes, this means that another decline could take the GDXJ all the way down to its 2020 low, or very close to it.
On the below chart, I marked just how perfectly the recent price moves played out according to the Elliott Wave Theory.
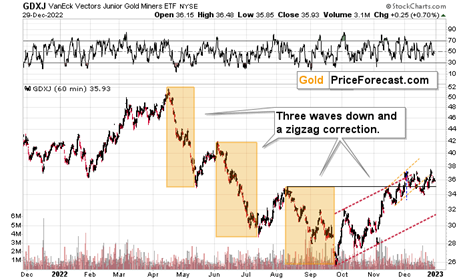
Of course, EWT is not the only tool that one could use, and I find other technical tools more useful, but still, this kind of pattern-following is uncanny.
The classic EWT pattern is three waves down (I marked those with orange rectangles) and then a correction consisting of two smaller waves.
That’s exactly what we have seen in recent months. The September–now pattern appears to be the above-mentioned correction. It didn’t only consist of two smaller waves higher – they were actually almost identical in terms of size and sharpness. This created a classic ABC correction (flag) pattern.
Three weeks ago, I wrote that the Dec. 1 small breakout above the upper red line didn’t have meaningful bullish implications as it hadn’t been confirmed. And indeed, it was invalidated.
Now, since this pattern is complete, another huge 3-stage move lower can – and is likely – to unfold. This is very bearish for junior mining stocks (as well as for gold, silver, and probably other commodities and stocks), and the fact that juniors are already showing weakness relative to gold (the latter was almost flat yesterday, while miners declined) serves as a bearish confirmation. As always, I can’t guarantee anything, but in my view, the profits that can be reaped on this upcoming slide can be enormous.[PR1]
Thank you for reading our free analysis today. Please note that the above is just a small fraction of the full analyses that our subscribers enjoy on a regular basis. They include multiple premium details such as the interim targets for gold and mining stocks that could be reached in the next few weeks. We invite you to subscribe now and read today’s issue right away .
Naturally, the above is up-to-date at the moment when it was written. When the outlook changes, I’ll provide an update. If you’d like to read it as well as other exclusive gold and silver price analyses, I encourage you to sign up for our free gold newsletter.
Thank you.
Przemyslaw Radomski, CFA
Founder, Editor-in-chief
Sunshine Profits: Effective Investment through Diligence & Care
* * * * *
All essays, research and information found above represent analyses and opinions of Przemyslaw Radomski, CFA and Sunshine Profits' associates only. As such, it may prove wrong and be subject to change without notice. Opinions and analyses are based on data available to authors of respective essays at the time of writing. Although the information provided above is based on careful research and sources that are deemed to be accurate, Przemyslaw Radomski, CFA and his associates do not guarantee the accuracy or thoroughness of the data or information reported. The opinions published above are neither an offer nor a recommendation to purchase or sell any securities. Mr. Radomski is not a Registered Securities Advisor. By reading Przemyslaw Radomski's, CFA reports you fully agree that he will not be held responsible or liable for any decisions you make regarding any information provided in these reports. Investing, trading and speculation in any financial markets may involve high risk of loss. Przemyslaw Radomski, CFA, Sunshine Profits' employees and affiliates as well as members of their families may have a short or long position in any securities, including those mentioned in any of the reports or essays, and may make additional purchases and/or sales of those securities without notice.
**********
 Przemyslaw Radomski, CFA, is the founder, owner and the main editor of SunshineProfits.com. You can reach Przemyslaw at: http://www.sunshineprofits.com/help/contact-us/.


