Gold Market Update


Gold's post-plunge rally of the past 9 trading days has been quite impressive, given what preceded it, but it has not vitiated the implications of the support failure and plunge, and it won’t until either a substantial base pattern forms, or the price breaks back above the strong support that has now become strong resistance. The chance of the latter happening over the short-term is low, and with the price now up within sniffing distance of the resistance, gold is viewed as being at a good point for traders to short it for a retreat back towards the recent lows, at the least.
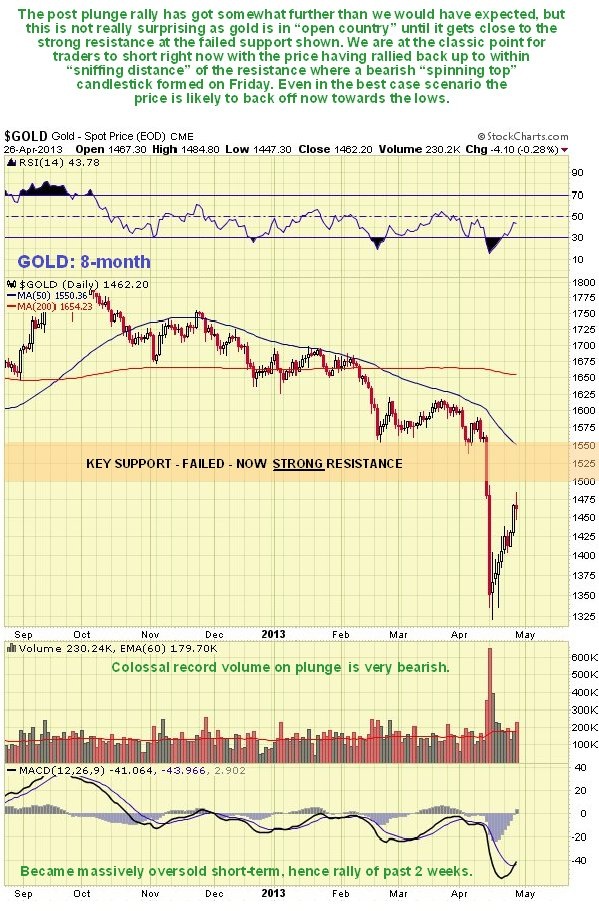
We can see the latest action clearly on the 8-month chart. The price has risen an impressive $150 off the lows, but this rebound has brought it up perilously close to the wall of overhanging supply from the trapped traders above the failed support and to its 50-day moving average now falling quite steeply overhead. Thus it is interesting to observe the appearance of a bearish “spinning top” candlestick on the chart on Friday, which is a warning that it is probably on the point of reversing to the downside. The massive record volume on the plunge remains a bearish omen as does the volume pickup on Friday’s intraday reversal. The rebound has served to unwind the extremely oversold condition resulting from the plunge, and has thus restored downside potential. Gold is thus viewed as a trading short here.
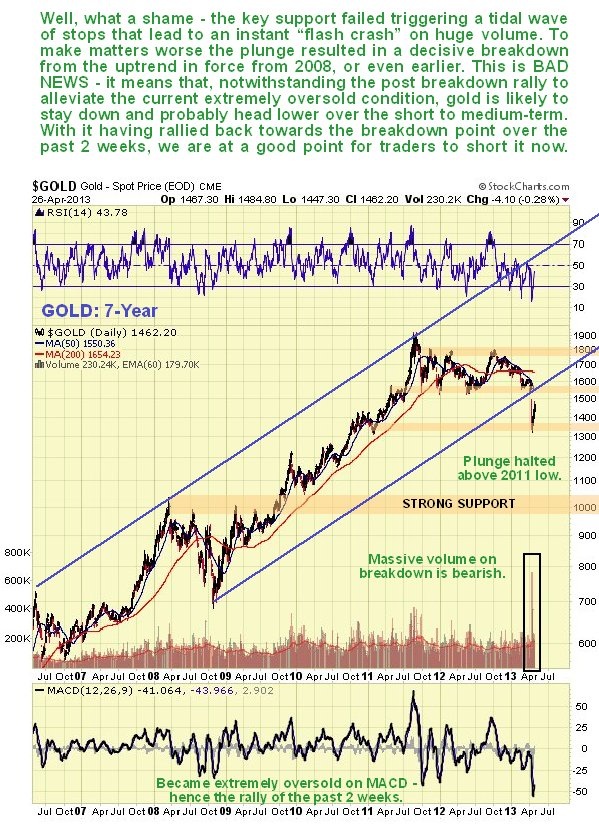
The 7-year chart reminds us that gold not only broke down below key support when it plunged, but also broke down from the long-term uptrend in force from 2008, or 2006 if you use its top line, on massive record volume, and it is hard to view this as anything other than a bearish development. We can also see on this chart that the plunge halted just above gold’s early 2011 low, and failure of this low can be expected to lead to a further severe decline back to strong support in the $1000 - $1050 area.
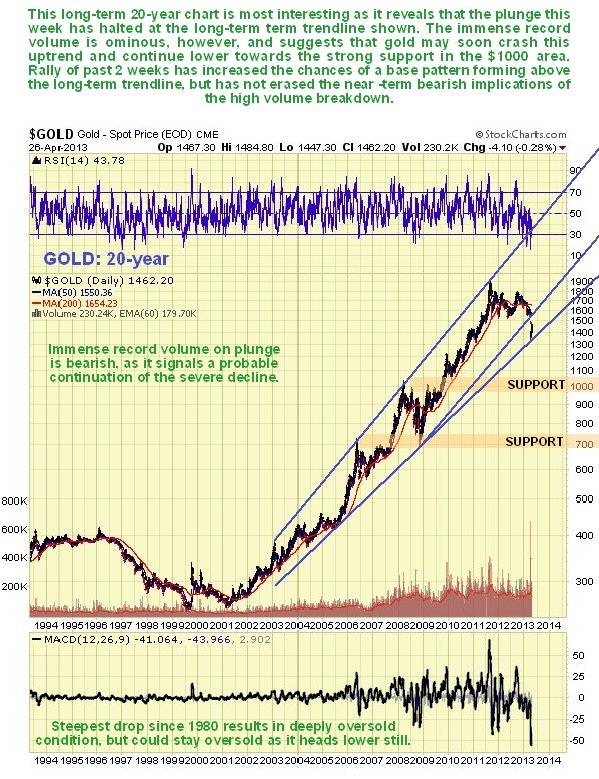
The long-term 20-year chart for gold is most interesting as reveals that the plunge halted right at an important long-term trendline. If this trendline holds it could reverse to the upside from about the current level. The problem is that the huge volume on the plunge and the preceding Big Money rundown of physical inventory suggest that this trendline will fail, and sadly if that happens then we will have no choice but to label gold as being in a bearmarket, although it’s not sad at all of course if you are a bear. We should keep in mind however that a drop to the $1000 - $1050 area could be followed by a turnaround and a major new bullmarket phase that sees gold ascend to clear new highs and then go parabolic, which would mean that the current convulsion is similar to what happened in the mid-70’s which at the time was labeled a bearmarket. This scenario is suggested as likely by the COTs.
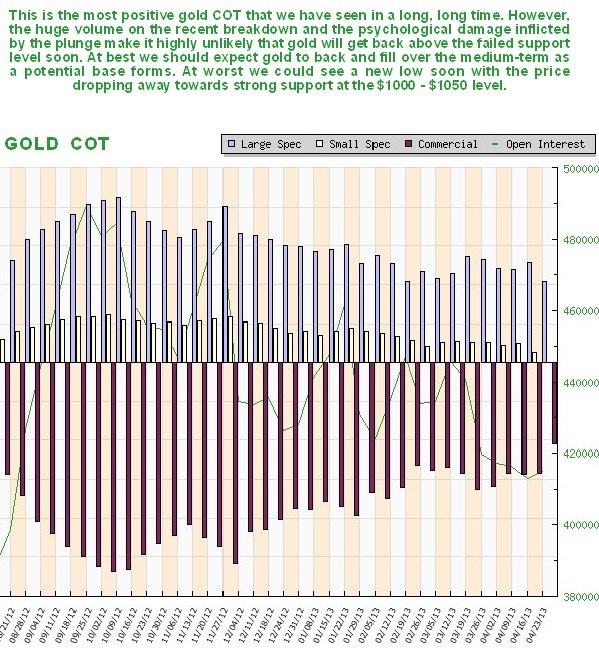
The latest COTs do look the most bullish for a long, long time, with Commercial short and Large Spec long positions dropping to their lowest levels for ages, with another substantial drop just last week. While this in itself does preclude further price declines – the Commercials could even wind up being long – it is a sign that a bottom is not too far away.
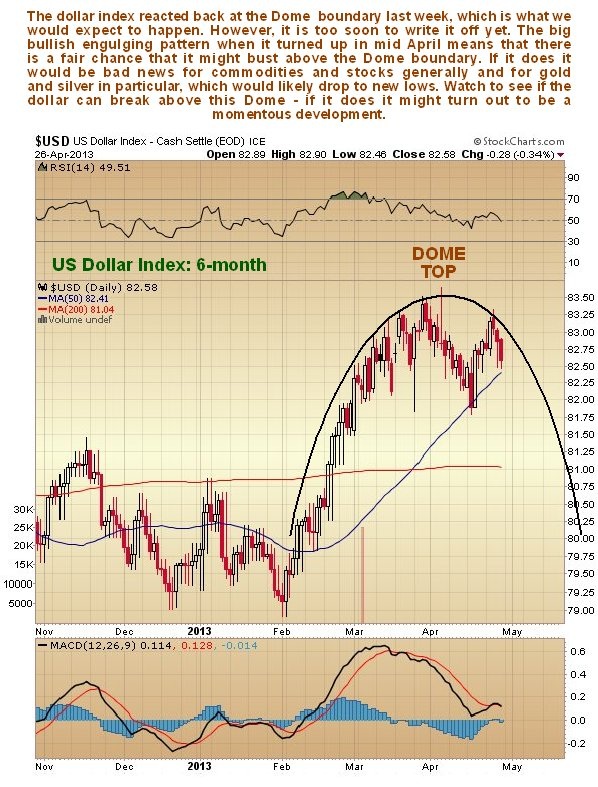
Although the dollar had little to do with gold’s recent plunge, it is likely to have a major role to play in gold’s future course, so we should always keep it in our sights. On the 6-month chart for the dollar index we can see how it rallied up to the boundary of a Distribution Dome and then backed off last week, which is normal action. Despite the name, Domes do not always result in reversal and a drop. While they are named appropriately as they are an indication of distribution, quite often a second upwave develops that breaks the price out of the top of the Dome to commence another upleg. This could happen here with the dollar, especially as a big bullish engulfing pattern occurred when the index reversed to the upside in mid-April. We need to be on the lookout for this, as such a breakout from this Dome would be bad news for commodities and stocks generally and for gold and silver in particular.
Two storylines have been doing the rounds since gold plunged, designed to keep bullish hopes alive. One is that the supposedly huge disconnect that exists between the paper and physical gold price is going to lead to a massive ramp in the price. If such a price differential did exist, then Big Money would arbitrage it away. The other is that as gold is going to $10,000 or $50,000 eventually, you should not therefore be upset if the price drops a mere 30% over the short to medium-term, as you are “in it for the long haul” or “in it to win it” etc. We try to keep “one foot on the ground” and avoid Alice in Wonderland type fantasizing – sure gold could go to $50,000 if there is hyperinflation, but this is still some way off even if it’s brewing and there is not a deflationary implosion first, and anyway it not such a big deal when it takes a wheelbarrow full of banknotes to buy a loaf of bread. If it’s hope you want, nip down to the local store and buy yourself a lottery ticket, it’s a lot cheaper.
Silver Market Update
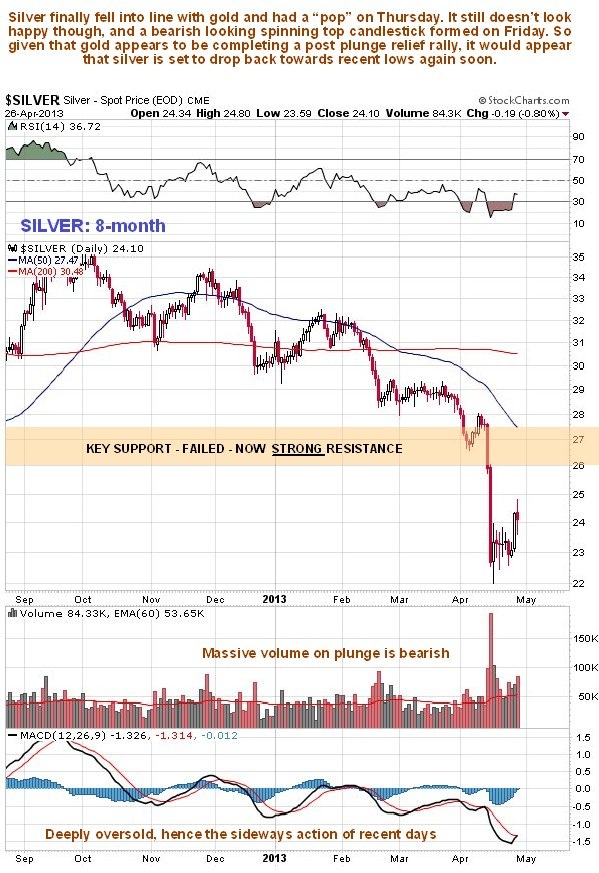
After being stuck in a tight range following its plunge about 9 trading days ago, silver finally responded to gold’s creeping advance and “popped” on Thursday, but it was not that impressive and was followed by a rather negative “spinning top” candlestick on Friday, meaning that it could have been a 1-day wonder especially given that gold’s relief rally looks to be about done.
We can see recent action in detail on the 8-month chart below. On this chart we see that once silver crashed key support at and above $26 it plunged on very heavy turnover, which was bearish. The current minor relief rally is serving to unwind the oversold condition and thus creating the conditions for renewed decline. This rally is unlikely to get far and may be done already. With the earlier strong support so clearly and sharply defined, any attempt to get above $26 will meet with heavy selling from the wall of overhanging supply above that level arising from trapped traders who bought at higher levels.
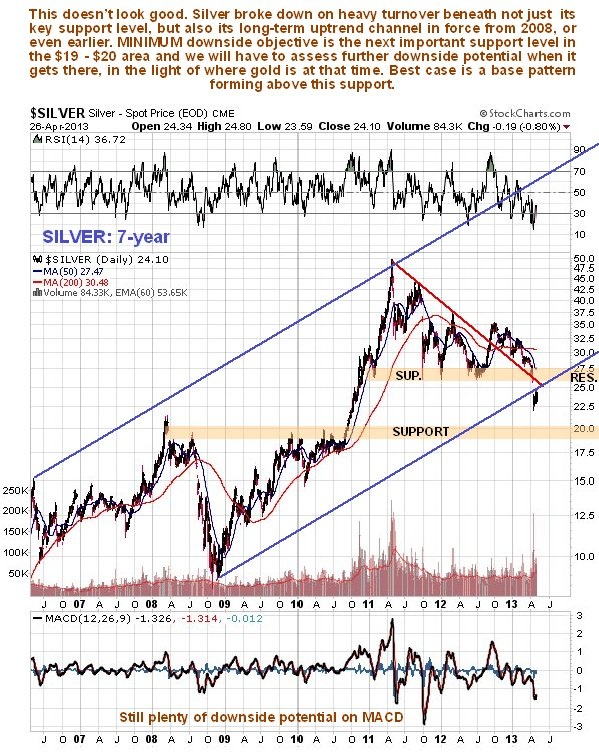
On the 7-year chart we can see that, as is the case with gold, silver not only broke below a key support level, but it simultaneously broke down from the long-term uptrend in force from 2008, or 2006 if you use its top line, opening up the risk of a more serious decline, with the first downside target being the quite strong support shown in the $19 - $20 zone. It is not so oversold as gold and so it has plenty of leeway to drop down to this level.
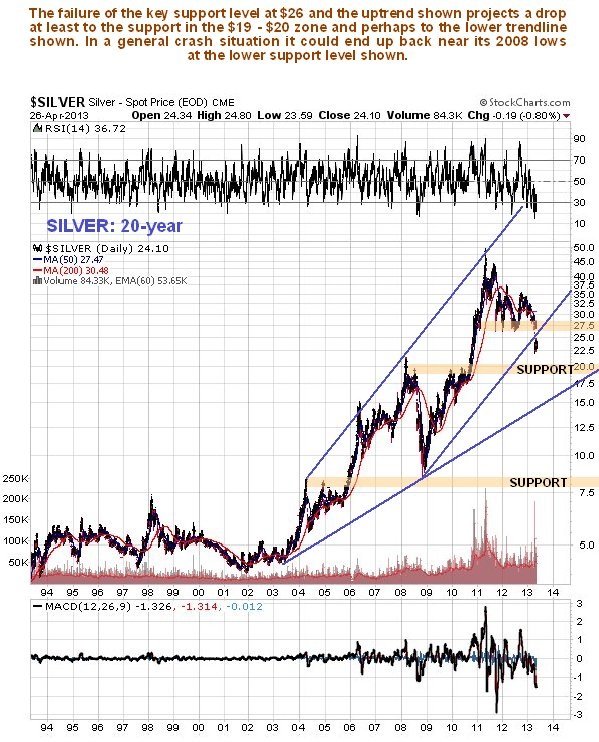
On its 20-year chart we can see that having crashed important support and broken down from the steeper uptrend, silver looks set to drop at least to the quite strong support in the $19 - $20 area, and in the event that gold breaks down from the long-term uptrend shown on its 20-year chart, which it is now perched some way above, and heads for the $1000 - $1050 area, then silver is likely to dig deeper into the broad band of support and continue on down towards the lower trendline shown on this chart, currently at about $16.
Although silver’s price charts look discouraging, its COT chart is at it most positive in recent memory, with Small Spec long positions being now almost non-existent and Commercial short positions being at a relatively very low level. By itself this suggests that a bottom is not too far away, and what may happen over the short to medium-term is that a base pattern forms between the current price and the support in the $19 - $20 area. We should keep in mind that in the event of the silver price falling further, the Commercials' positions could even shift into net long territory for the first time in years.
Clive Maund, Diploma Technical Analysis
[email protected]
www.clivemaund.com

Clive P. Maund’s interest in markets started when, as an aimless youth searching for direction in his mid-20’s, he inherited some money. Unfortunately it was not enough to live a utopian lifestyle as a playboy or retire very young. Therefore on the advice of his brother, he bought a load of British Petroleum stock, which promptly went up 20% in the space of a few weeks. Clive sold them at the top…which really fired his imagination. The prospect of being able to buy securities and sell them later at a higher price, and make money for doing little or no work was most attractive – and so the quest began, especially as he had been further stoked up by watching from the sidelines with a mixture of fascination and envy as fortunes were made in the roaring gold and silver bull market of the late 70’s.
Clive furthered his education in Technical Analysis or charting by ordering various good books from the US and by applying what he learned at work on an everyday basis. He also obtained the UK Society of Technical Analysts’ Diploma.
The years following 2005 saw the boom phase of the Gold and Silver bull market, until they peaked in late 2011. While there is ongoing debate about whether that was the final high, it is not believed to be because of the continuing global debasement of fiat currency. The bear market since 2011 is viewed as being very similar to the 2-year reaction in the mid-70’s, which was preceded by a powerful advance and was followed by a gigantic parabolic price ramp. Moreover, Precious Metals should come back into their own when the various asset bubbles elsewhere burst, which looks set to happen anytime soon.
Visit Clive at his website: CliveMaund.com


