Gold Price To Ascend Into Year's End?


 'Tis quite the question, that title, with but four trading days in the balance for 2015. Of late, Gold is giving -- the appearance anyway -- of at least basing for year's end into which we are racing. To say nothing of the fact 'tis been better than three years now of Gold's having ignored its mitigant role against currency debasing.
Indeed three years ago to this very day, the StateSide M2 money supply per the St. Louis Fed was $10.45 trillion, with Gold then priced at 1658. Today's M2 reading is 18% higher at $12.33 trillion, whilst Gold is 35% lower at 1076. Yes I know, 'tis all boundlessly bass-ackward -- so much so that overshoot of valuation, (of which we were acutely aware during 2011), might of its own accord have no bound the next time 'round -- making holders of Gold oh so financially sound.
For the present, the case can be made for a base to take place. The below graphic shows us Gold by the week from three years ago-to-date. During that stint, we've subjectively identified four basing incidents for Gold, all of which led to rallies well-exceeding 100 points to the upside, two of which notably arrived right 'round year's end in 2013 and 2014. And as you can see for 2015, that similar look of yet another year-end base is being put in place, such that a repetitive rally would place Gold up in the 1200s:
And why not, eh? The Federal Open Market Committee members are all a-fawn over the strengthening economy, unanimously having voted to embark on a perceived series of interest rate rises, which as you shall recall between 2004-2006 found the cost of FedFunds rise from 1% to 5%, whilst Gold ascended throughout from 400 to 650. We'll take such repeat of history; why, it might even slap some sense into a stock market which continues to trade at better than double its earnings foundation.
Quite the giddy thought of markets regressing to some reasonable means of valuation; make sure the champagne is properly chilled, as is the economy. For despite the past week's release on the final calculation of gross domestic product for Q3 coming in at +2.0%, here's how our Economic Barometer tracked that period (pale blue portion); note as well the ever-revered Reuters reportage:
"That doesn't look very good to me, mmb..."
Well, Squire, 'tis all about what the Bureau of Economic Analysis selects for its quarterly GDP formulation: they use four aggregated components; for the Econ Baro we use in excess of 50 metrics per month. Voilà la différence.
One might therefore conclude that the FOMC believes that which it reads: from the Bureau rather than the Baro. (But as above exemplified, 'tis our preference instead to actually run the numbers -- what a difference the truth makes). And truly for Gold, basing or otherwise, zooming next into the weekly year-over-year bars still results in a paltry picture, the parabolic Short trend now eight weeks in length, with the flip-to-Long price 51 points up the road at 1127. Further given that Gold's expected weekly trading range is presently 34 points, such flip price would appear ought of reach for when we again meet in a week. 'Course, millennium-to-date, the yellow metal has scored three weeks of 100+ point gains, a subtle reminder that when Gold goes, it goes:
What have been on the go of late for Gold are its "Baby Blues", which day-by-day depict the consistency of the ever-evolving 21-day linear regression trend. Yet as we go to the following three-panel chart of 21-day views, whilst the blue dots have been rising on the left for Gold, price (if indeed basing) is rather stagnant, with little upside tilt to the diagonal trendline itself. Whereas in the center for the Swiss Franc as Gold's "brother-in-arms" mitigant against the Doggie Dollar, the display is clearly more upside consistent, despite the Precious Metals not keeping pace, (Silver's picture is essential that of Gold). Perhaps most poignant on the right is the trend of the S&P 500 ("SPOO" futures), for when you "see" the joyous Santa Claus rally in context, 'tis vastly superficial as to how you "hear" it broadcast:
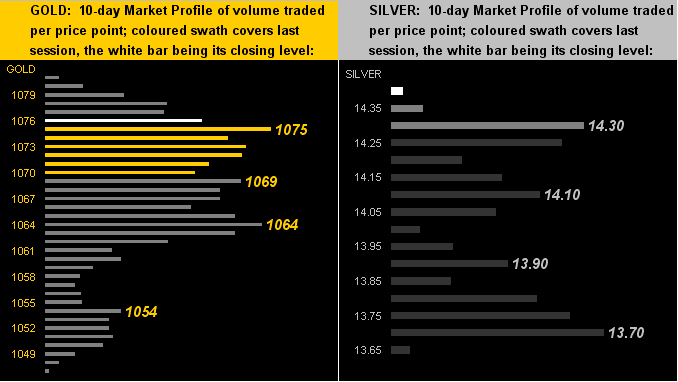
Next, what is impressive, indeed underpinning the case for a base, is the state of the 10-day Market Profiles for both Gold (left) and Silver (right), their attendant support levels as labeled. And note Sister Silver's present price (14.380) as right at the top of her stack: Way to go, Sis!
As for Gold's Big Picture, the stack remains a most formidable structure. Here 'tis:
The Gold Stack
Gold's Value per Dollar Debasement, (from our opening "Scoreboard"): 2566
Gold’s All-Time High: 1923 (06 September 2011)
The Gateway to 2000: 1900+
Gold’s All-Time Closing High: 1900 (22 August 2011)
The Final Frontier: 1800-1900
The Northern Front: 1750-1800
On Maneuvers: 1579-1750
The Floor: 1466-1579
Le Sous-sol: Sub-1466
Base Camp: 1377
Year-to-Date High: 1307
Neverland: The Whiny 1290s
Resistance Band: 1240-1280
The 300-day Moving Average: 1167
The Weekly Parabolic Price to flip Long: 1127
10-Session directional range: up to 1081 (from 1047) = +34 points or +3%
Trading Resistance: none
Gold Currently: 1076, (weighted-average trading range per day: 15 points)
Trading Support: 1075 / 1069 / 1064 / 1054
10-Session “volume-weighted” average price magnet: 1067
Year-to-Date Low: 1045
Finally, these few notes as we go racing into year's end:
■ Next in our 02 January edition we'll have the final BEGOS Markets standing for 2015, (the components being the Bond, Euro/Swiss, Gold/Silver/Copper, Oil, and S&P). 'Twill be a pretty sickly list of performances, to be sure.
■ A tip of the cap to Visual Capitalist founder Jeff Desjardins for having just pieced together in a single chart how much money exists in the entire world. What really caught our eye in doing some math was that the amount of all debt owed has increased from $154 trillion during the Black Swan of 2008 to today's level of $199 trillion. That's +29%. That's overwhelming. That's Gold positive. And that's an understatement.
■ Lastly, the year ain't quite over yet, folks. Data being fed into the Econ Baro next week includes consumer confidence, pending home sales, and that always wily month-end precursor to the ISM Index: the Chicago PMI. And just in case you're scoring at home, recall as well that in the final week of 2014, the S&P fell whilst Gold gained. Shall we thus again see Gold ascend into year's end? Bring it on!
With best wishes for a safe, happy and reinvigorating celebration of the New Year, I toast you beloved readers!

Mark Mead Baillie has had an extensive business career beginning in banking and financial services for two years with Banque Nationale de Paris to corporate research for three years at Barclays Bank and then for six years as an analyst and corporate lender with Société Générale.
For the last 22 years he has expanded his financial expertise by creating his own financial services company, de Meadville International, which comprehensively follows his BEGOS complex of markets (Bond/Euro/Gold/Oil/S&P) and the trading of the futures therein. He is recognized within the financial community of demonstrating creative technical skills that surpass industry standards toward making highly informed market assessments and his work is featured in Merrill Lynch Wealth Management client presentations. He has adapted such skills into becoming the popular author each week of the prolific “The Gold Update” and is known in the financial website community as “mmb” and “deMeadville”.
Mr. Baillie holds a BS in Business from the University of Southern California and an MBA in Finance from Golden Gate University.
More from Gold-Eagle


