Gold Price Costs 80oz Of Silver
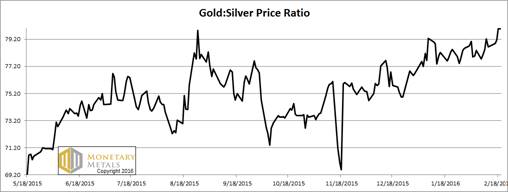
 The big news is that the gold-silver ratio closed at 80. This is not only a new high for the move. It’s higher than it has been since 2008.
It’s also exactly what Monetary Metals has been calling for. Last week, we said the gold fundamental was $1,450 and the silver fundamental was $14.90 (i.e. a fundamental value for the ratio over 97 last week). This week, the ratio moved up, and it’s now 1.3 points closer. In other words, silver got cheaper when measured in gold terms.
We had a soggy dollars spotting this week (our term for an article that’s misleading or based on false assumptions). A gold mining executive declared that the people are losing faith in the central banks. The take-away was clear: the gold trade is on again! buy gold now, to make big profit$.
It should be bloody obvious that he just wants you to bid up the price of the product his company sells (i.e. gold). He wants to make money (i.e. dollars).
But that aside, our larger point is that articles like this (and there are plenty of them) are quite ironic. When there is a loss of faith, there will be a great paradigm shift. No longer will people think of gold going up, but of the dollar going down (and finally, collapsing). That is not occurring today. These articles exist just to rationalize a trade. The dollar still enjoys the full faith of everyone—most especially the gold bugs who need a currency in which to measure the worth of their gold, and in which to take their profit$ when they sell.
Read on for the only true picture of the gold and silver supply and demand fundamentals…
But first, here’s the graph of the metals’ prices.
The Prices of Gold and Silver
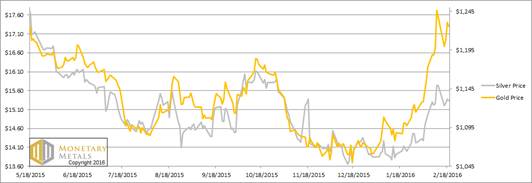
We are interested in the changing equilibrium created when some market participants are accumulating hoards and others are dishoarding. Of course, what makes it exciting is that speculators can (temporarily) exaggerate or fight against the trend. The speculators are often acting on rumors, technical analysis, or partial data about flows into or out of one corner of the market. That kind of information can’t tell them whether the globe, on net, is hoarding or dishoarding.
One could point out that gold does not, on net, go into or out of anything. Yes, that is true. But it can come out of hoards and into carry trades. That is what we study. The gold basis tells us about this dynamic.
Conventional techniques for analyzing supply and demand are inapplicable to gold and silver, because the monetary metals have such high inventories. In normal commodities, inventories divided by annual production (stocks to flows) can be measured in months. The world just does not keep much inventory in wheat or oil.
With gold and silver, stocks to flows is measured in decades. Every ounce of those massive stockpiles is potential supply. Everyone on the planet is potential demand. At the right price, and under the right conditions. Looking at incremental changes in mine output or electronic manufacturing is not helpful to predict the future prices of the metals. For an introduction and guide to our concepts and theory, click here.
Next, this is a graph of the gold price measured in silver, otherwise known as the gold to silver ratio. The ratio was up to a new record weekly close.
The Ratio of the Gold Price to the Silver Price
For each metal, we will look at a graph of the basis and cobasis overlaid with the price of the dollar in terms of the respective metal. It will make it easier to provide brief commentary. The dollar will be represented in green, the basis in blue and cobasis in red.
Here is the gold graph.
The Gold Basis and Cobasis and the Dollar Price
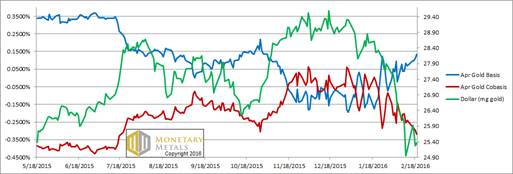
The dollar went up a quarter of a milligram (i.e. the price of gold fell nine bucks). And the scarcity of gold (i.e. the cobasis, shown in red) fell a little.
That said, there’s still quite a bit of scarcity in the gold market. Although our fundamental price of gold is down 13 bucks, it’s still over $1,435. And that’s over $200 over the current market price.
Our prediction of a rising gold-to-silver ratio is not based on the common pattern of both metals going down—in dollar terms—with silver going down more.
As we noted in a prior report, it becomes easier to see in gold terms. The dollar and silver are both going down now—in gold terms.
Now let’s look at silver.
The Silver Basis and Cobasis and the Dollar Price
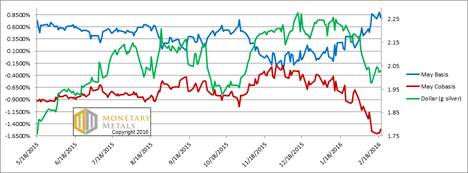
We finally switched from looking at the March silver contract to the May. First Notice Day for March is a week from Monday and the bases are becoming very volatile. That said, and unlike in the past, the silver basis for March is still positive. We coined the term temporary backwardation, because contracts for gold and silver—and silver much more than gold—tended to tip into backwardation as they approached expiry. Not in silver now, at this price.
Unlike the trivial price move in gold, the one in silver was more substantial—40 cents. The silver cobasis (our scarcity indicator) barely budged. It’s still in the basement, rising from -1.55% to -1.51%. For reference, the gold cobasis is -0.32%.
We have been observing a pattern for several weeks. We wrote about this phenomenon a while back. I am talking about “icicles” on the price chart. They occur in the spot price, but not futures. Here is a picture of most of the trading day (times are Arizona time).
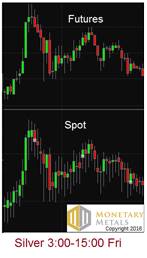
Notice the visual difference between the two. Spot has these dripping lines, where the price temporarily fell but then recovered before the close of the time period. These happen to be 15-minute candles, but the same thing occurs with other periods. If you watch it in real time, you see the price drop, then drop, then drop, then snap back. Repeatedly. This has been going on for weeks.
On the futures chart, the drooping lines are much less frequent, and appear more balanced with lines above (like what one would expect with normal market price fluctuations during any 15-minute block on any actively traded security).
What does it mean?
We think it shows in the price chart what we see in the basis. The silver basis is showing weak demand. For the May contract, the basis is 78 bps. This is the yield (quoted as an annualized percentage) that you can earn by carrying silver—buying metal and selling a future against it. It’s a spread, with no price risk, for a 3-month position. For reference, 3-month LIBOR is about 60 bps. The silver carry trade is attractive right now. Certainly, it’s much more attractive than carrying April gold, which yields 13 bps (annualized).
We think that what’s happening is that the price of silver metal is selling down, and every time the carry rises to a threshold, arbitrageurs are buying spot to sell futures and pocket that spread. If they wait for opportune moments, we’re sure they can make over 1%.
The marginal demand for silver is to go into carry trades, into the warehouse (we do not mean necessarily to be stored in a COMEX approved depository and this has nothing to do with those persistent rumors that the COMEX depositories are running out of metal, that they’ve sold the metal 100 times over, etc.) We are looking at marginal supply and marginal demand here.
The risk is that today’s marginal demand—namely the warehouse—can turn off abruptly. And it can become tomorrow’s supply.
Silver in the futures market—silver paper, you will—has more robust demand than silver metal in the spot market.
Metal, of course, is often bought unleveraged by hoarders. Paper is often bought by speculators, who could be using 10:1 leverage. We realize that this is not the Narrative that circulates in the silver bug community. Yet these icicles on the price chart offers another look, using a different data set than what Monetary Metals normally focuses on.
The fundamental price of silver fell a few pennies more than the market price this week. It’s about 80 cents below market.
The fundamental price of the ratio rose even more.
© 2016 Monetary Metals


 Dr. Keith Weiner is the CEO of Monetary Metals and the president of the


