Gold Price Forecast – Gold Performance During The Upcoming USD Index Twists And Turns


It’s hard not to mention gold and its paper nemesis in one breath. And understandably so, as the yellow metal moves have a certain relation to the way the greenback performs. Consequently, one of the critical parts of gold analysis is actually the analysis of one of its key drivers – the USD Index. In today’s essay, we’ll discuss the outlook for the latter and we’ll discuss the lessons that it brings to gold.
Long-Term USDX Assessment
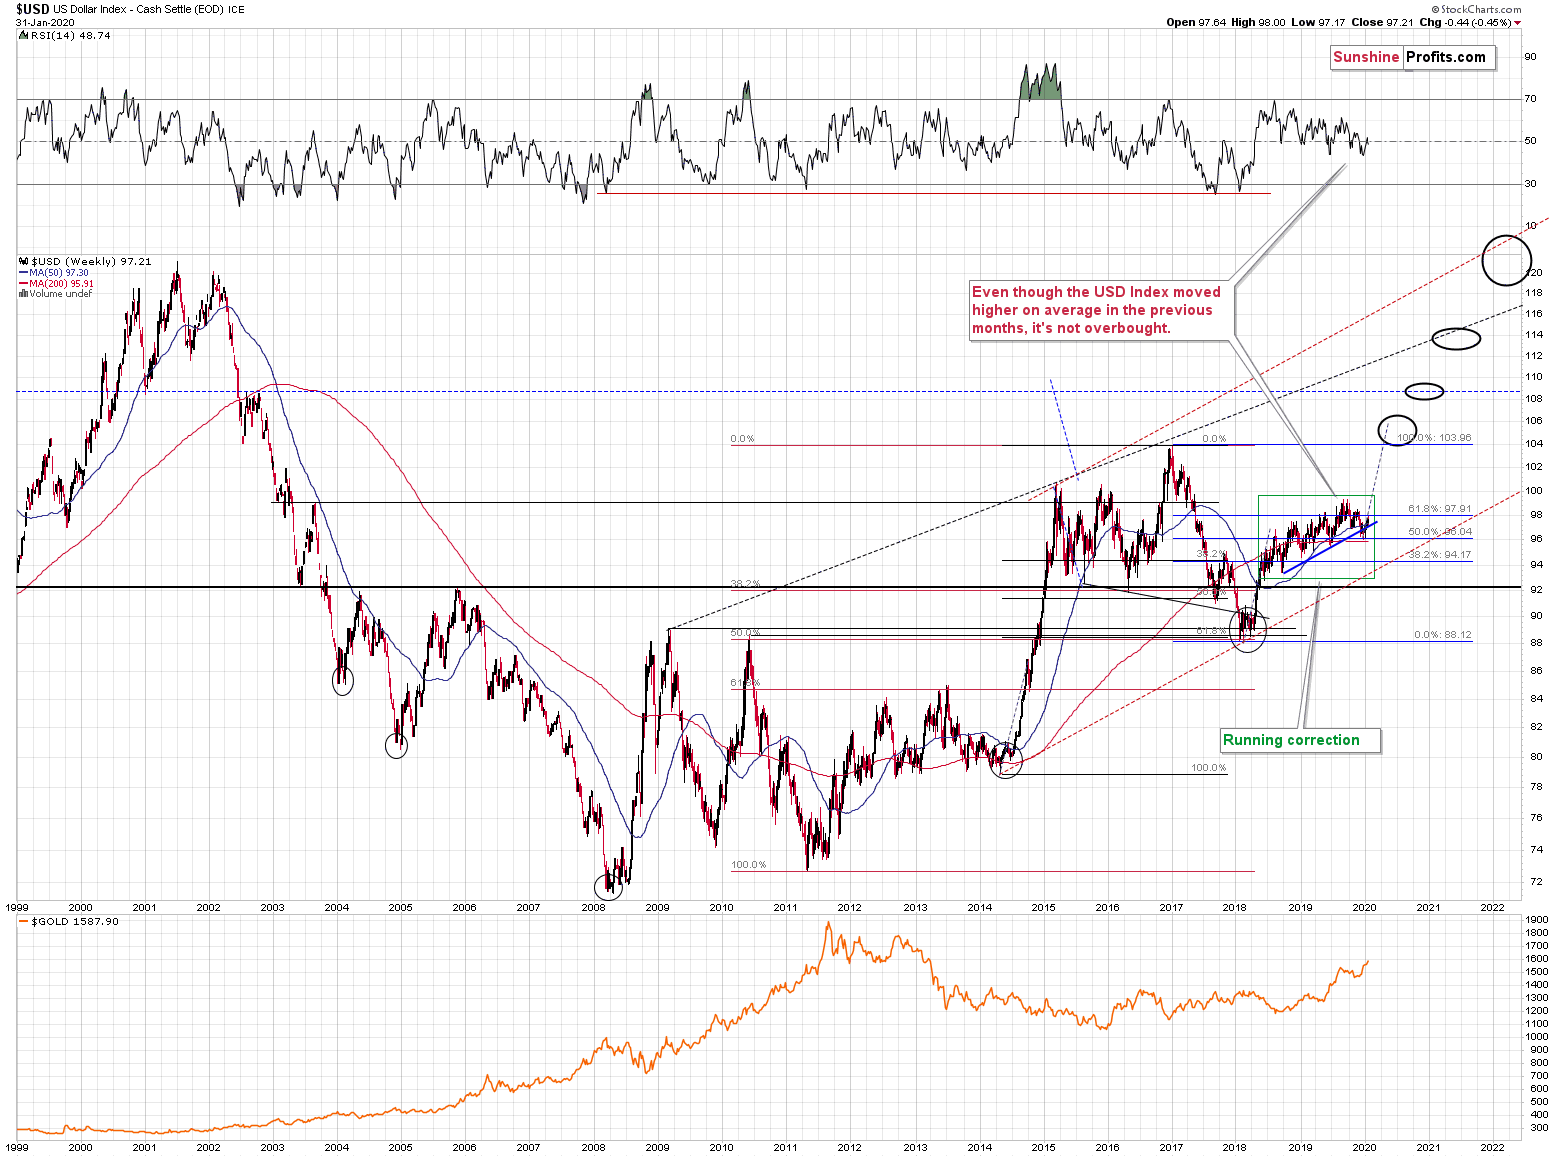
The USD Index is moving up in a rising trend channel (all medium-term highs are higher than the preceding ones) that formed after the index ended a very sharp rally. This means that the price movement within the rising trend channel is actually a running correction, which is the most bullish type of correction out there. If a market declines a lot after rallying, it means that the bears are strong. If it declines a little, it means that bears are only moderately strong. If the price moves sideways instead of declining, it means that the bears are weak. And the USD Index didn’t even manage to move sideways. The bears are so weak, and the bulls are so strong that the only thing that the USD Index managed to do despite Fed’s very dovish turn and Trump’s calls for lower USD, is to still rally, but at a slower pace.
The temporary breakdown below the rising blue support line was invalidated. That’s a technical sign that a medium-term bottom is already in.
While the coronavirus’ impact on gold may seem to be the most important short-term issue, the above long-term uptrend is what really matters as far as the following 5-20 months are concerned.
Short-Term Look at the USDX
Now, as far as the short-term outlook for the USD Index is concerned, the situation just clarified. And by clarified, we mean that it developed exactly as we have outlined it in one of our previous premium Alerts.
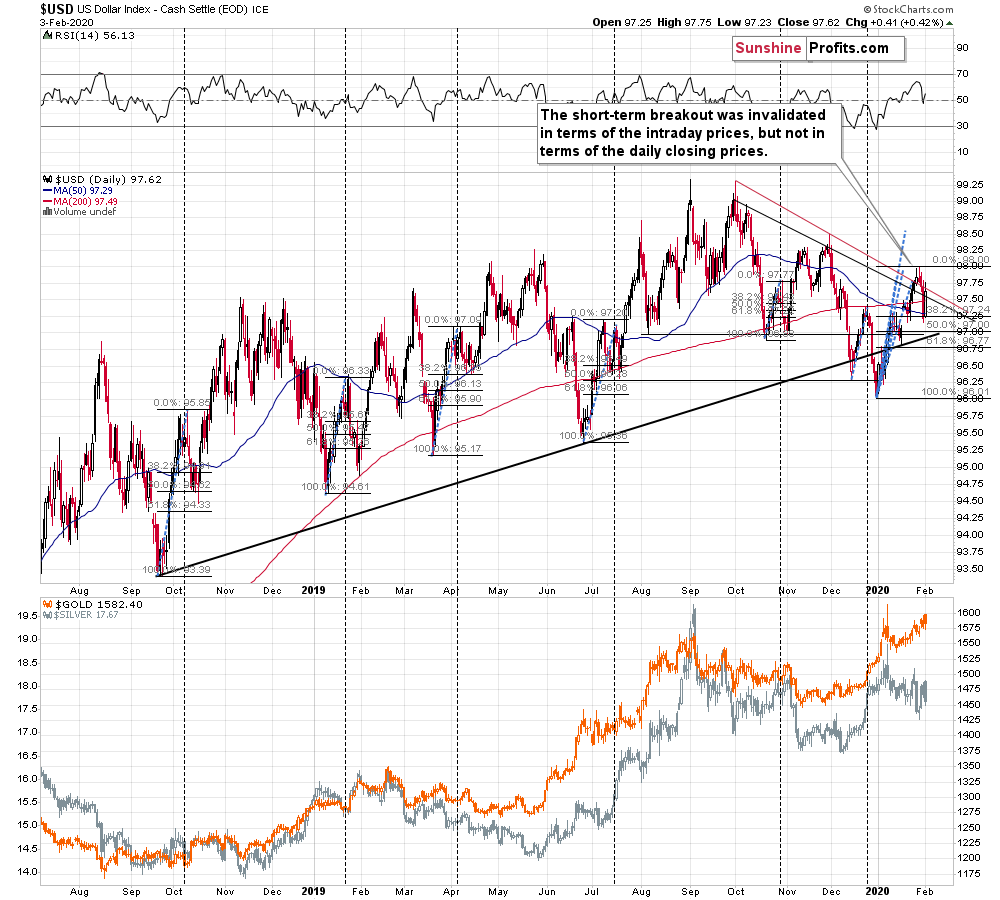
The USD Index invalidated its breakout above the declining resistance lines in terms of both: intraday highs and daily closing prices. This is a very bearish factor for the short term.
To be clear, we continue to think that the USD Index is headed much higher in the following months and perhaps years, but this doesn’t mean that it will rally in a straight line.
But the USDX is rallying once again!
Indeed, the above chart shows that the USD Index has not only rallied, but that yesterday’s session was volatile overall. It’s not that surprising given the significant amount of news that hit the market yesterday. As we wrote in yesterday’s Market News Report, most of the news were important from traders’ point of view, but not necessarily so from investors’ point of view. Indeed, the bigger trends didn’t change at all, but the short-term turmoil was definitely present. This has implications going forward as well. Since the news was mostly likely to cause short-term movement, but not much more, then what was likely to happen, has probably already happened. In other words, one shouldn’t expect additional significant market movement based on yesterday’s news (like the ISM Manufacturing PMI).
Yesterday, the USD Index moved back above the declining resistance line that’s based on the closing prices and in today’s pre-market trading, it moved above the upper one, based on the intraday prices. This second attempt to break above the resistance lines may or may not be successful – it’s far from being confirmed. In our view, another decline is still more likely.
That’s what we saw in April and July 2019 – 2 of the previous 5 similar cases. The additional factor that supports this outcome is the similarity to the shape of the last two important tops – the October and November 2019 tops. In October, there was a small corrective upswing before the decline accelerated. In November, the USDX moved briefly above the previous high, before the decline really picked up.
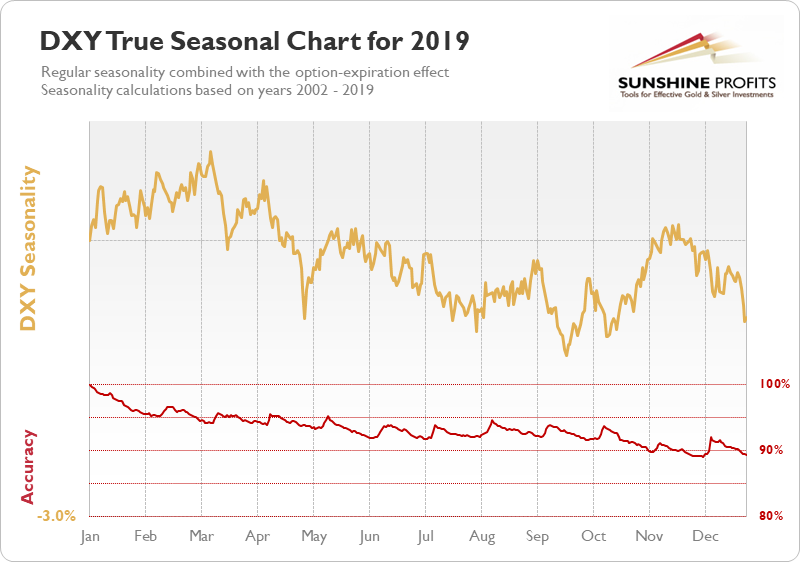
Let’s keep in mind that based on its seasonality, USD’s early February rally is likely to be short lived and the USDX tends to give these gains away closer to the middle of the month, before rallying again. A decline in the next 5 days or so and then a rally would perfectly fit the scenario that we outlined as likely for PMs – a rally for another week or so and then a reversal followed by a decline.
Ok, so, how low could the USD Index move?
The vertical dashed lines and the Fibonacci retracements on the above chart show what happened when the USDX entered such corrective downswings in the recent past. In one case, the USDX declined to new lows, in two cases (January 2019 and October 2019) it moved very close to its previous lows, in two other cases, it corrected about half of the preceding rally (October 2018 and July 2019), and in one case (April 2019), it moved to the 38.2% Fibonacci retracement before rallying once again.
If the history is to rhyme, as it usually does, then the USD Index is likely to decline to at least 97.24. Friday’s low was 97.17, so one might say that the bottom is already in, but this isn’t likely the case. Why? Because the coronavirus scare doesn’t seem to be over.
Consequently, the 97 level seems to be a quite likely downside target as this support is additionally strengthened by the October low and the rising medium-term support line. It’s also possible that the USDX would move briefly even lower – perhaps to the 61.8% Fibonacci retracement at 96.77.
Implications for Gold and Silver
Gold’s and silver’s reaction to the USD movement has been quite specific before and during corrections in the latter.
In almost all above-mentioned cases, gold and silver declined (usually relatively sharply) prior to USD’s declines. The July 2019 case may seem to be an exception, but it really isn’t one. Back then, the USD formed two tops and the first top was indeed immediately preceded by a quick dip in both precious metals. The true exception is what happened in December 2019 – in this case, gold and silver paused a bit before rallying again. We saw that once again this week. Gold, silver, and mining stocks declined quickly, but then they came back up with vengeance as the USDX started to correct.
So, while the USD Index is still likely to move lower in the following days, the precious metals are likely to move higher. The opposite is likely in the following months.
Summary
While the USD index is in a long-term uptrend, it’s standing on a shakier ground in the short-term. That’s one of the key factors that could contribute to higher gold prices in the near term. The 97 level seems to be a reasonably likely downside target for the USDX, which can be counted on to fuel another precious metals’ upswing. But what about the coming weeks and months?
The following months are not likely to be pleasant times for anyone who refuses to jump on the bullish bandwagon just because prices moved higher in the previous months. But what’s profitable is rarely the thing that feels good initially. As silver often moves in close relation to the king of metals, forecasting gold’s upswing without a bigger decline first is thus likely to be misleading. The times when gold is trading well above the 2011 highs will come, but they are unlikely to be seen without being preceded by a sharp drop first.
Naturally, the above is up-to-date at the moment of publishing and the situation may – and is likely to – change in the future. If you’d like to receive follow-ups to the above analysis, we invite you to sign up to our gold newsletter. You’ll receive our articles for free and if you don’t like them, you can unsubscribe in just a few seconds. Sign up today.
Przemyslaw Radomski, CFA
Editor-in-chief, Gold & Silver Fund Manager
Sunshine Profits - Effective Investments through Diligence and Care
* * * * *
All essays, research and information found above represent analyses and opinions of Przemyslaw Radomski, CFA and Sunshine Profits' associates only. As such, it may prove wrong and be subject to change without notice. Opinions and analyses are based on data available to authors of respective essays at the time of writing. Although the information provided above is based on careful research and sources that are deemed to be accurate, Przemyslaw Radomski, CFA and his associates do not guarantee the accuracy or thoroughness of the data or information reported. The opinions published above are neither an offer nor a recommendation to purchase or sell any securities. Mr. Radomski is not a Registered Securities Advisor. By reading Przemyslaw Radomski's, CFA reports you fully agree that he will not be held responsible or liable for any decisions you make regarding any information provided in these reports. Investing, trading and speculation in any financial markets may involve high risk of loss. Przemyslaw Radomski, CFA, Sunshine Profits' employees and affiliates as well as members of their families may have a short or long position in any securities, including those mentioned in any of the reports or essays, and may make additional purchases and/or sales of those securities without notice.
 Przemyslaw Radomski, CFA, is the founder, owner and the main editor of SunshineProfits.com. You can reach Przemyslaw at: http://www.sunshineprofits.com/help/contact-us/.


