Gold Price Forecast: Don’t Fall Victim To Miners’ Fake Strength!


 Did something catch your attention yesterday? If so, it could have been mining stocks’ strength relative to gold. Or so it seems… Until we take a closer look.
Additionally, gold didn’t get enough power from its previous breakout, and seems to be running out of gas again.
So, what’s happening?
In short, the GDX ETF moved higher yesterday, even though gold moved lower. This is a sign of strength from the former, which might be viewed as something bullish. But should it be viewed as such?
In my opinion – no. One swallow doesn’t make a summer, and a daily data outlier could be nothing more than that. Acting on gold’s daily, unconfirmed breakout, would have one buy gold at the end of the previous week. And as we’ll soon discuss, it wasn’t such a good idea after all.
1. What are Miners Up To?
So, why did miners rally?
Ultimately, it’s never possible to reply to the “why did a given market move” other than to say that “because buyers won over sellers”. It’s not particularly informative, though. The reason that seems most likely to me is that it was… a purely technical development that “needed” to happen for a formation to be complete.
This hypothesis would also explain the one odd thing that happened yesterday. Namely, while the GDX closed the day slightly higher, the GDXJ ended the day lower. This would make sense if the general stock market declined (junior mining stocks – GDXJ tend to follow its lead more than seniors – GDX) – but the point is that the general stock market ended yesterday’s session basically flat (declining by mere 0.09% decline).
Ok, so what kind of formation are miners completing?
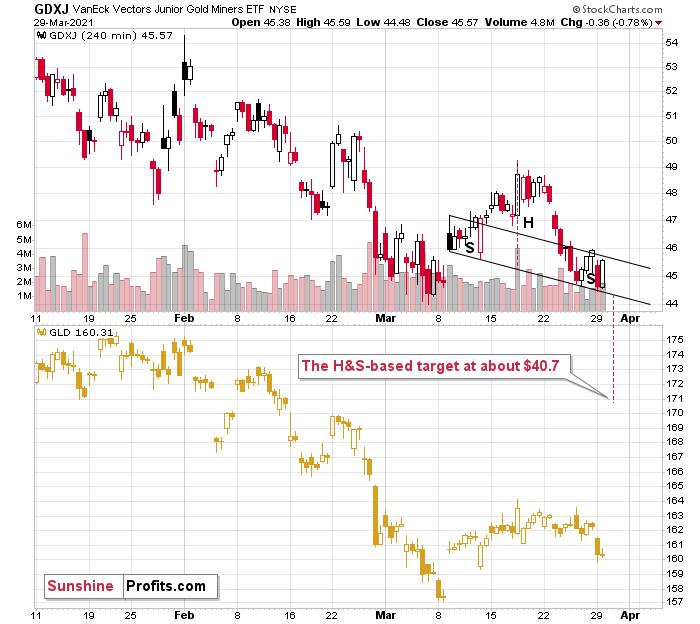
Quite likely the head and shoulders formations. The reason for yesterday’s underperformance of the GDXJ would be the fact that in case of this ETF’s head-and-shoulders formation, the neckline is descending much more visibly. These formations are more visible on the 4-hour charts – so, let’s zoom in.
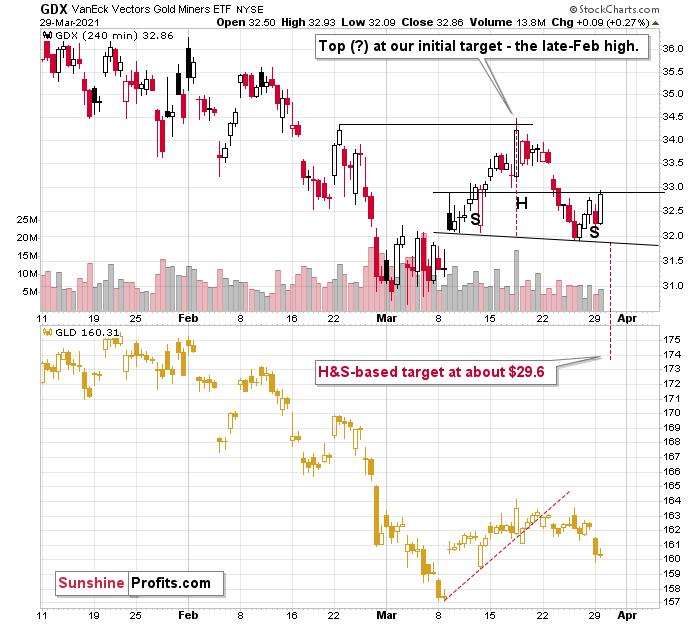
Currently – based on yesterday’s (Mar. 29) closing prices – the formations are not yet completed, so they should be viewed as “potential”. Still, given today’s (Mar. 30) pre-market decline in gold, it seems that they will be confirmed shortly, and the entire scenario outlined above will become reality (the recent decline will have turned out to be just the right shoulder of a bearish head-and-shoulders pattern).
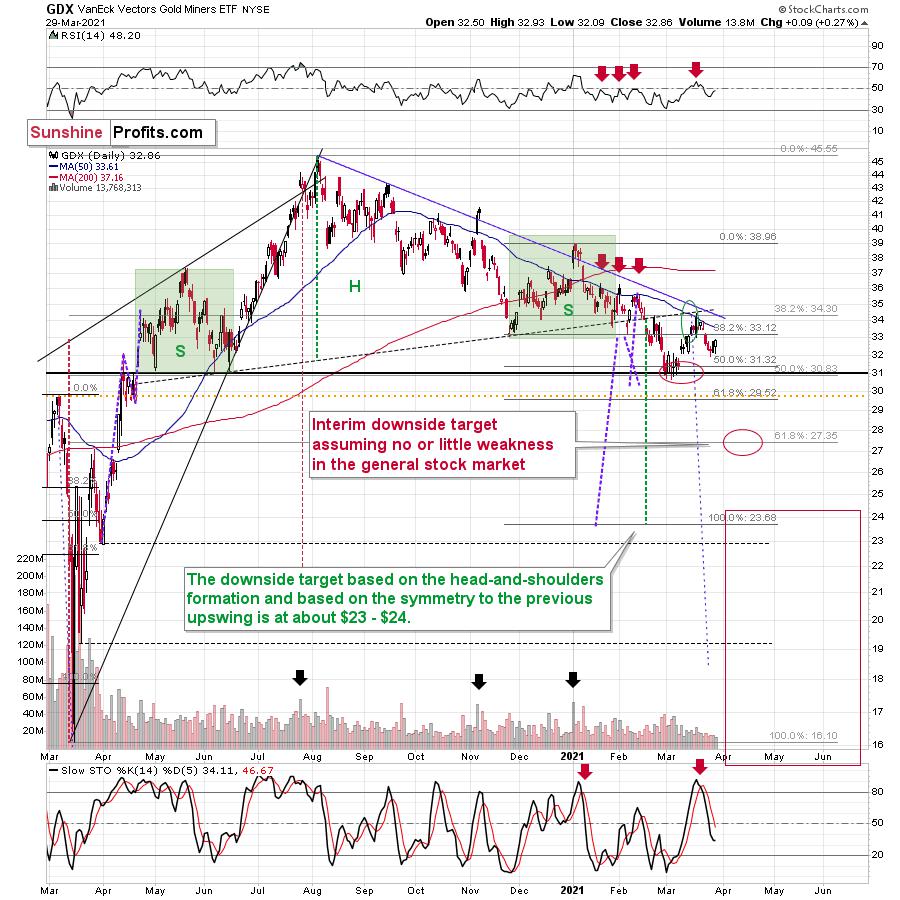
The price targets based on those formations are $29.6 and $40.7 for GDX and GDXJ, respectively. However, let’s keep in mind that the H&S-based target should be viewed as “minimum” targets, not necessarily the final ones.
2. Gold is Invalidating its Breakout
Let’s take a look at gold.
In yesterday’s analysis, I wrote the following:
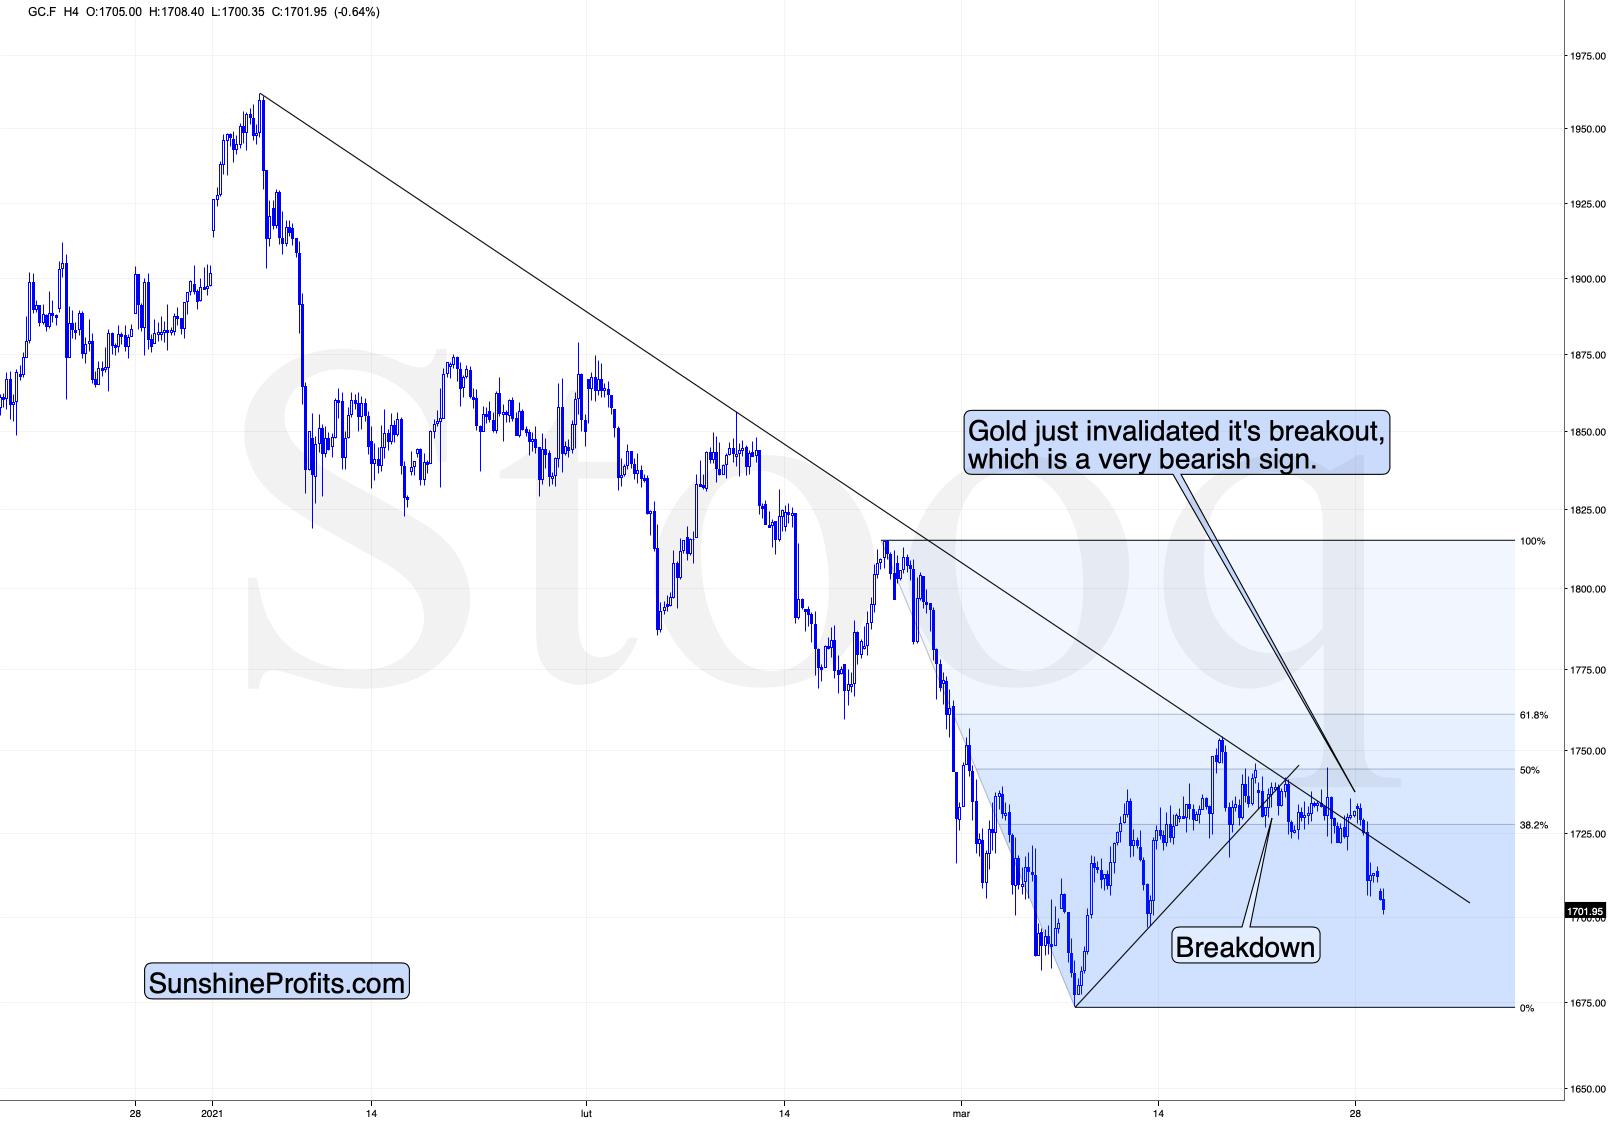
At the moment of writing these words, gold is trading once again very close to the previously broken line, ready to invalidate the breakout. If it does invalidate it (by moving below $1,725), then the bullish potential created by Friday’s rally will be gone.
Does the possibility (!) of seeing a temporary upswing imply that it’s a good idea to close our short positions? I don’t think so. In my view, the risk of missing the decline is too big and the situation in the USD Index is too bullish right now, to justify this action.
In short, gold just invalidated its small breakout above the declining resistance line. The previous breakout was small and thus it required a confirmation. It never got one, and instead gold plunged, invalidating the move. This is yet another sell sign.
It’s no wonder that gold is sliding. After all, gold tends to react more to breakouts and breakdowns in the USD Index than to its regular moves.
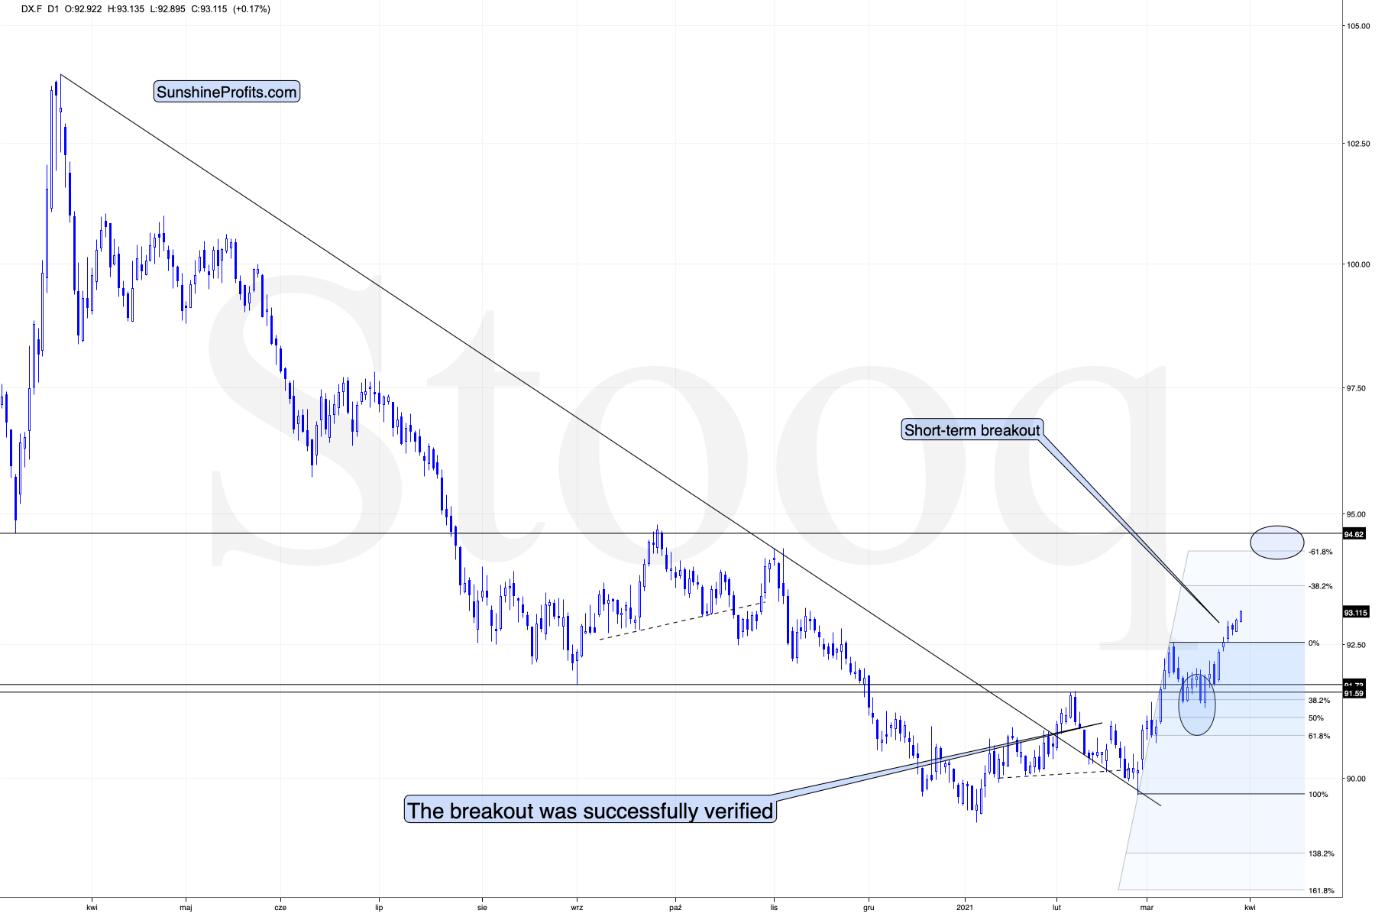
The thing is that the breakout to new yearly highs in the USD Index is now clearly visible. Yesterday’s close was the third consecutive daily close that we saw above the February high, which means that the breakout was confirmed. This a big deal from the short-term point of view, and it means that the road is now fully open for the U.S. currency index to soar to about 94.5 (before rallying even higher).
On Thursday (Mar. 25), I wrote the following:
(…) The breakout in the USD Index is not yet confirmed, but it seems quite likely that it will be confirmed shortly. I would not be surprised to see a weekly close near the previous yearly highs (the February highs) and then a powerful rally next week. This – if it happens in the above-mentioned way – would be likely to result in a major slide in the PMs next week.
The USD Index has indeed closed the week near the previous yearly highs (not right at them – apparently the USDX was too strong do decline right to them) and we see the beginning of a powerful rally this week. We also see the beginning of a major slide in the PMs this week. At the moment of writing these words, gold is already down by over $30 this week.
Summary
The precious metals are well on track in their medium-term downtrend, and any small upside from here is bound to be temporary.
The corrective upswing is pretty much over (or just about to be), and the weeks that follow are not likely to be pleasant times for anyone who jumps on the bullish bandwagon just because prices moved higher in the previous months or based on some forum posts. Tread carefully.
What’s profitable is rarely the thing that feels good initially. As silver often moves in close relation to the yellow metal, forecasting gold’s longer-term rally without a bigger decline first is thus likely to be misleading. Silver is likely to slide as well. The times when gold is continuously trading well above the 2011 highs will come, but they are unlikely to be seen without being preceded by a sharp drop first.
Thank you for reading our free analysis today. Please note that it is just a small fraction of today’s all-encompassing Gold & Silver Trading Alert. The latter includes multiple premium details such as the outline of our trading strategy as gold moves lower.
If you’d like to read those premium details, we have good news for you. As soon as you sign up for our free gold newsletter, you’ll get a free 7-day no-obligation trial access to our premium Gold & Silver Trading Alerts. It’s really free – sign up today.
Przemyslaw Radomski, CFA
Founder, Editor-in-chief
Sunshine Profits - Effective Investments through Diligence and Care
* * * * *
All essays, research and information found above represent analyses and opinions of Przemyslaw Radomski, CFA and Sunshine Profits' associates only. As such, it may prove wrong and be subject to change without notice. Opinions and analyses are based on data available to authors of respective essays at the time of writing. Although the information provided above is based on careful research and sources that are deemed to be accurate, Przemyslaw Radomski, CFA and his associates do not guarantee the accuracy or thoroughness of the data or information reported. The opinions published above are neither an offer nor a recommendation to purchase or sell any securities. Mr. Radomski is not a Registered Securities Advisor. By reading Przemyslaw Radomski's, CFA reports you fully agree that he will not be held responsible or liable for any decisions you make regarding any information provided in these reports. Investing, trading and speculation in any financial markets may involve high risk of loss. Przemyslaw Radomski, CFA, Sunshine Profits' employees and affiliates as well as members of their families may have a short or long position in any securities, including those mentioned in any of the reports or essays, and may make additional purchases and/or sales of those securities without notice.
********
 Przemyslaw Radomski, CFA, is the founder, owner and the main editor of SunshineProfits.com. You can reach Przemyslaw at: http://www.sunshineprofits.com/help/contact-us/.


