Gold Price Forecast: Gold Price Around Labor Day (Part 2)


Based on the situation in the USD Index, the analogy to what happened in mid-90s, and – most importantly from the short-term point of view – gold was supposed to decline similarly to how it had declined 8 years ago. Back in 2011, THE top formed right after the U.S. Labor Day and that started the multi-year decline. We saw yet another top in gold yesterday, and gold is refusing to rally today even though the USD Index declined by almost 0.5. The history is repeating, and the implications run deeper than 99% of investors think.
Today’s analysis is a follow-up to what we wrote previously about what gold tends to do around the US Labor day, but for the sake of clarity, we will go through the entire discussion once again.
There are many techniques that investors and traders use to gain insight into gold’s future prices, and different people usually have different set of tools that they use. Some focus on moving averages, while others pay attention to Fibonacci retracements and indicators, and some insist to apply the Elliott Wave Theory… But among all these discussions there is usually one common denominator to which everyone, or almost everyone agrees. Certain price moves tend to happen at similar times during the year. This technique, called seasonality (we will refer to it as plain seasonality as opposed to True Seasonality), is something that is being used by many investors and traders. And even if it is not used, its usefulness of this particular gold trading hint is very rarely being questioned. That’s exactly what we’ll discuss today. We’ll start with a specific event that just took - US Labor Day - and then we’ll move to a more general overview of the True Seasonal patterns.
Let’s start with discussion what tends to happen on the gold market after the US Labor Day.
In short, something special is often happening on the gold market around the US Labor Day. In almost all cases, gold is either topping or already after a nearby top. In other words, it’s perfectly set for a major decline in the following weeks, and sometimes, months.
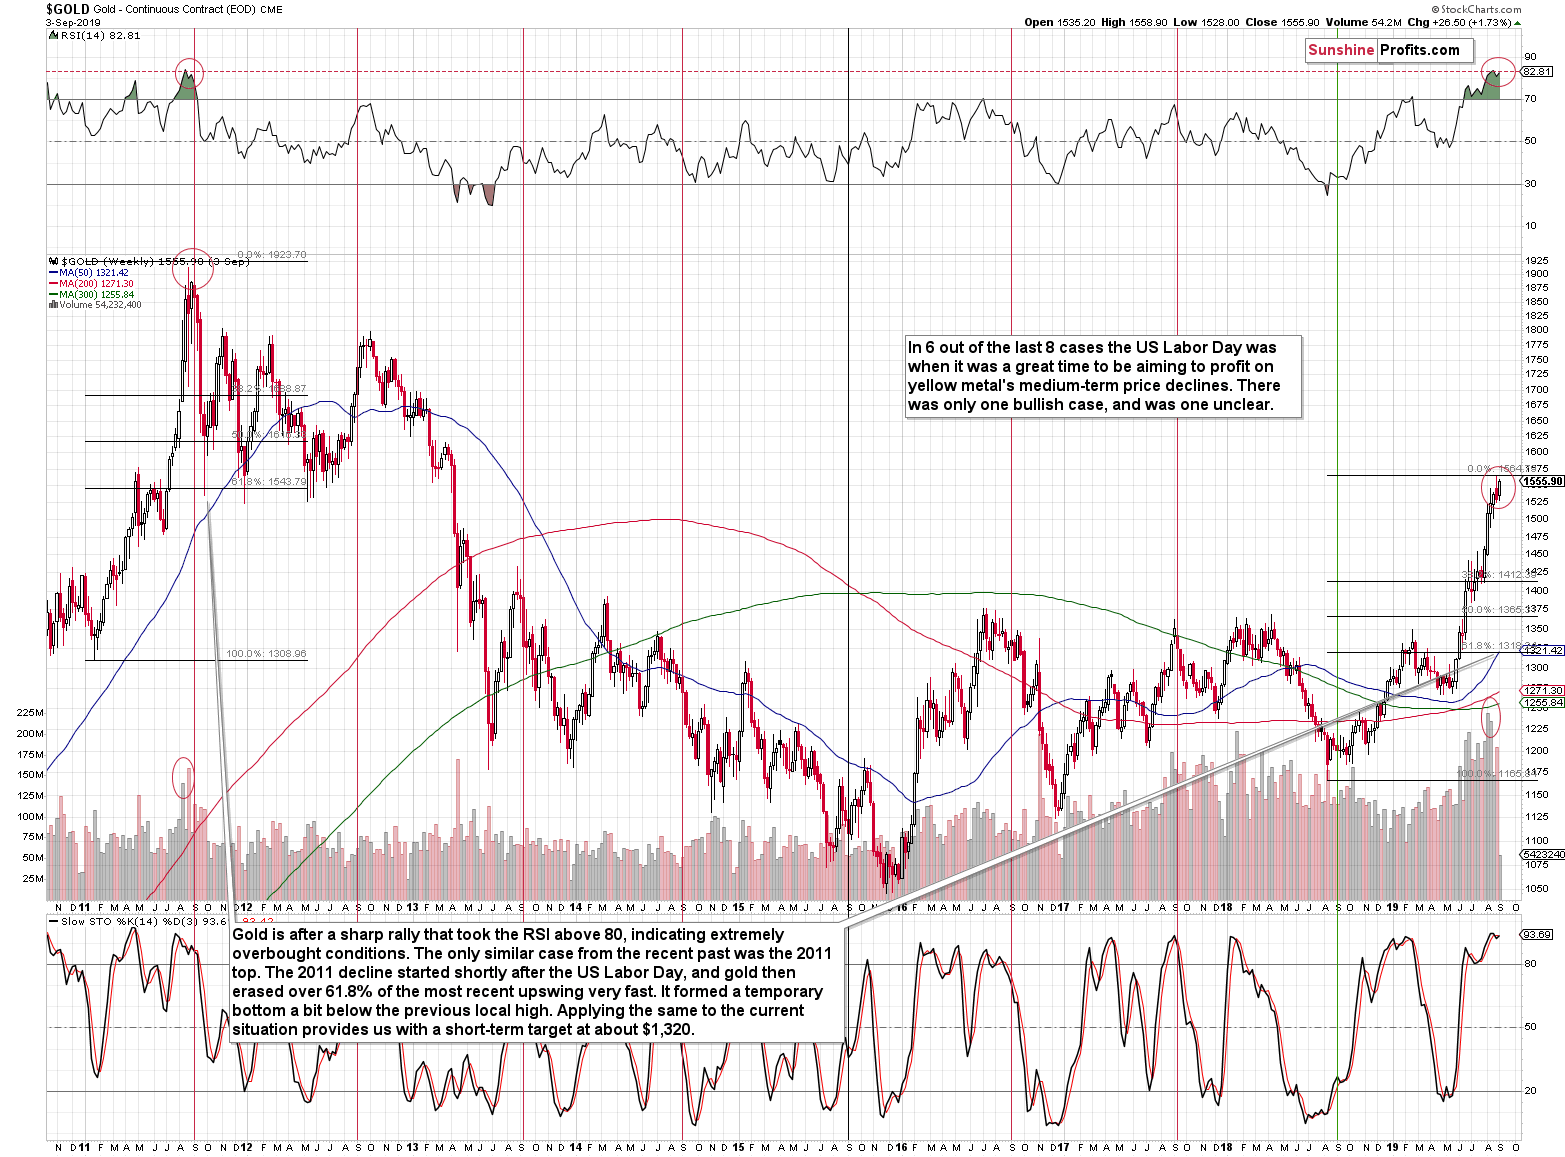
In 6 out of the last 8 cases the US Labor Days was were great times to be aiming to profit on yellow metal's medium-term price declines. There was only one bullish case (in 2018), and was one unclear (in 2015, when gold moved higher in the short run, but then declined anyway). Consequently, it appears that it’s high time for gold to end its recent rally.
This analogy in terms of time as a building bridge to yet another analogy that becomes obvious once you take a look at the RSI indicator in the upper part of the chart. It’s currently above the 80 level. There was only one other case in the previous years when we saw something similar. It was at the 2011 top.
The 2011 top is usually just mentioned as the 2011 top, or THE top, as it was the most prominent high of the past decades, so there’s no way to mistake it for a different high. Consequently, it’s easy to forget when did exactly this top take place. The initial high took place on August 23, 2011, and the final (THE) top took place on September 6, 2011 (the first session after the US Labor Day).
Interestingly, the August 13, 2019 session was very volatile overall, which might be similar (to a smaller extent, but still) to the initial August 2011 top.
To summarize, gold is after a sharp rally that took the RSI above 80, indicating extremely overbought conditions, and the only similar case from the recent past is the 2011 top. The 2011 decline started shortly after the US Labor Day (the first session after the Labor Day was THE top), and gold then erased over 61.8% of its most recent upswing – and very fast. It formed a temporary bottom a bit below the previous local high. Gold didn’t move to its 50-day moving average at that time.
The 61.8% Fibonacci retracement of the most recent rally is at $1,318. The most recent local high is at about $1,350. The 50-day gold moving average is at about $1,315 right now. Consequently, applying the 2011 details to the current situation provides us with a short-term target at about $1,320.
This is where gold is likely to move next before bouncing. It’s likely to then decline once again, but since no market moves up or down in a straight line, we’re adjusting our exit target for the current short position to accommodate the above – we’re moving them to $1,332, in order to maximize the chance of realizing the trade.
Before summarizing, please note that if we discount all the price moves surrounding the early September without looking exactly at this particular date, we get a picture in which gold might be topping right now or a one in which it has already topped.
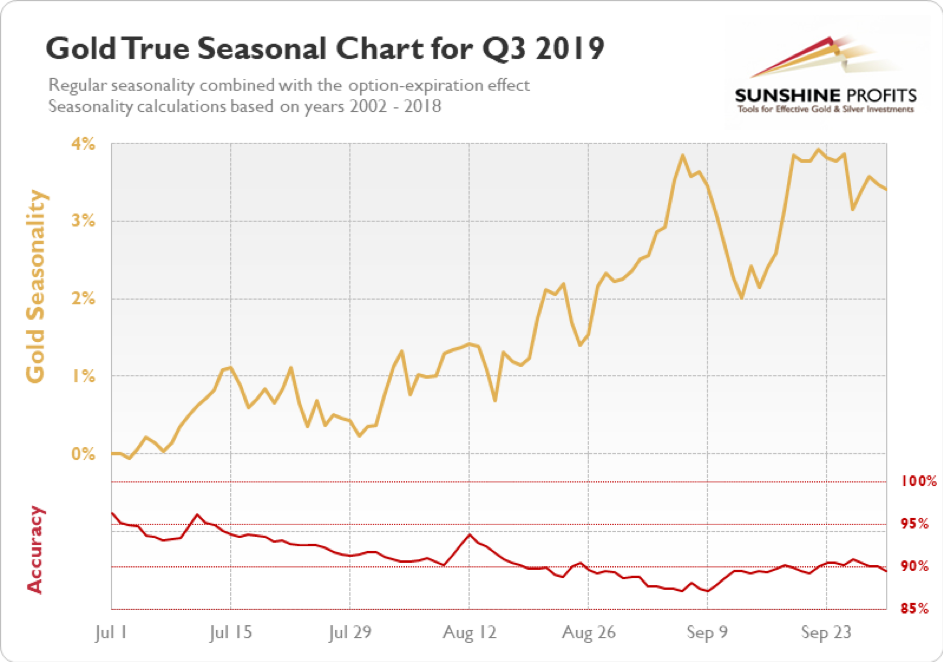
Our gold seasonality charts show that the rally in the yellow metal might already be over. The accuracy of the prediction (i.e. the difference between the previous cases) is relatively big right now, so it’s unclear whether the top is already in or not, but please note how the accuracy rises after the first part of September, along with lower forecasted gold prices. This means that whenever the top forms (whether it formed yesterday, will it form on Tuesday right after the US Labor Day, or anytime in between), gold is already likely to be much lower in mid-September.
Before summarizing, we would like to touch on the topic that many seem to get entirely wrong – silver’s recent strength.
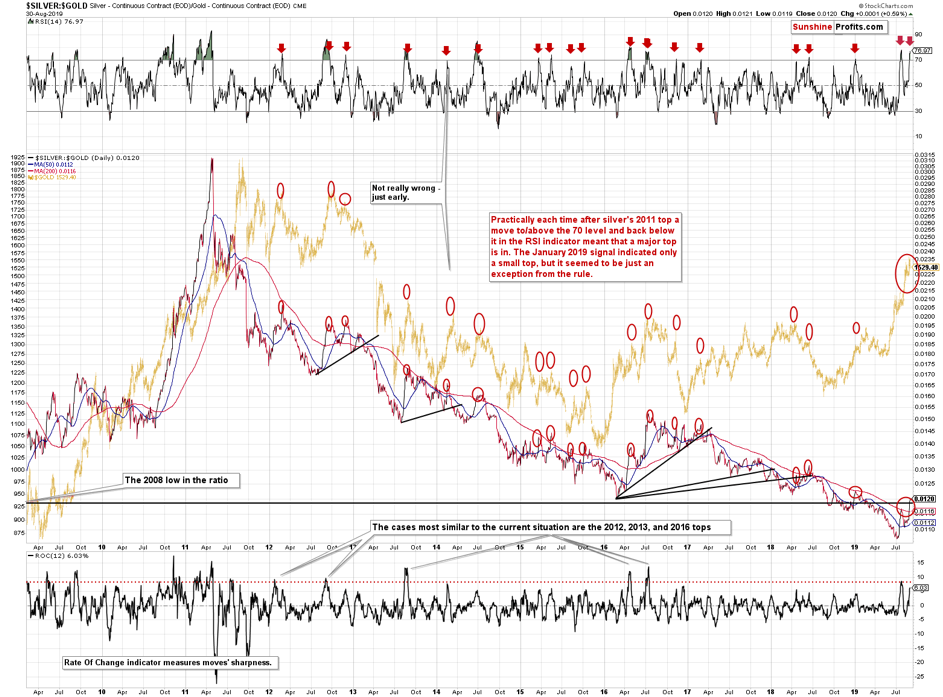
Those that do not specialize in the precious metals market, will often view silver’s strong performance in the short run as something profoundly bullish. And if this means that silver is outperforming gold (just as it did recently), this is a sell sign in disguise. It’s not intuitive and it's against some rules that apply to other markets, but that’s just how the precious metals market works. If you start forecasting silver going to the moon as it’s been outperforming gold on a short-term basis, rallying vertically etc., or you read an analysis or watch a video that claims so, please take a look at the above chart and count how many times per year – on average – gold and silver topped right after silver’s short-term strength. This will help you put silver’s rally into proper perspective.
Summary
Summing up, given what gold tends to do around – and in particular after – US Labor Day, it seems that betting on higher gold prices here will not be rewarded. The price of gold is likely to move much higher in the following years, perhaps based on a recession, but not before declining substantially first as the USD Index soars. Let’s keep in mind that taking the big investment picture into account, out of the following: gold, silver, gold stocks, silver stocks, the recent upswing was visible only in case of gold. Most of the precious metals portfolio: silver, gold miners, and silver miners suggest that what we saw in the last several months is nothing more than a corrective upswing within a bigger downtrend.
We know that these are not pleasant times for anyone who refuses to jump on the bullish bandwagon just because prices are moving higher, but what’s profitable is rarely the thing that feels good initially. In those circumstances, we simply cannot forecast gold at higher prices in the medium term. There will most likely be times when gold is trading well above the 2011 highs, but they are unlikely to be seen without being preceded by a sharp drop first.
Naturally, the above is up-to-date at the moment of publishing and the situation may – and is likely to – change in the future. If you’d like to receive follow-ups to the above analysis, we invite you to sign up to our gold newsletter. You’ll receive our articles for free and if you don’t like them, you can unsubscribe in just a few seconds. Sign up today.
Przemyslaw Radomski, CFA
Editor-in-chief, Gold & Silver Fund Manager
Sunshine Profits - Effective Investments through Diligence and Care
* * * * *
All essays, research and information found above represent analyses and opinions of Przemyslaw Radomski, CFA and Sunshine Profits' associates only. As such, it may prove wrong and be a subject to change without notice. Opinions and analyses were based on data available to authors of respective essays at the time of writing. Although the information provided above is based on careful research and sources that are believed to be accurate, Przemyslaw Radomski, CFA and his associates do not guarantee the accuracy or thoroughness of the data or information reported. The opinions published above are neither an offer nor a recommendation to purchase or sell any securities. Mr. Radomski is not a Registered Securities Advisor. By reading Przemyslaw Radomski's, CFA reports you fully agree that he will not be held responsible or liable for any decisions you make regarding any information provided in these reports. Investing, trading and speculation in any financial markets may involve high risk of loss. Przemyslaw Radomski, CFA, Sunshine Profits' employees and affiliates as well as members of their families may have a short or long position in any securities, including those mentioned in any of the reports or essays, and may make additional purchases and/or sales of those securities without notice.
 Przemyslaw Radomski, CFA, is the founder, owner and the main editor of SunshineProfits.com. You can reach Przemyslaw at: http://www.sunshineprofits.com/help/contact-us/.


