Gold Price Forecast Per Growth In US Money Supply


 Indubitably, there are several factors which heretofore have affected the price of gold. Needless to say, these factors have been material drivers that have fuelled the price of gold since the present secular bull market was birthed in 2001. Here are these gold price stimulating forces:
- The bombing of New York’s World Trade Center September 11, 2001 (the infamous 911 event).
- Major World Central Banks accumulating gold reserves.
- Accelerated Growth in the US Fed’s Balance Sheet.
- China’s goal to diversity its overtly dangerous FOREX risk away from the US greenback.
- China’s covert objective to replace the US$ reserve currency with its own gold backed Renminbi.
- Central Bank gold price manipulation with a view to protect its fiat paper money policies.
- Accelerated growth in the US Money Supply.
The following analysis will attempt to make a gold price prediction based solely on the last factor:
Accelerated Growth in the US Money Supply.
M-1 Money Supply
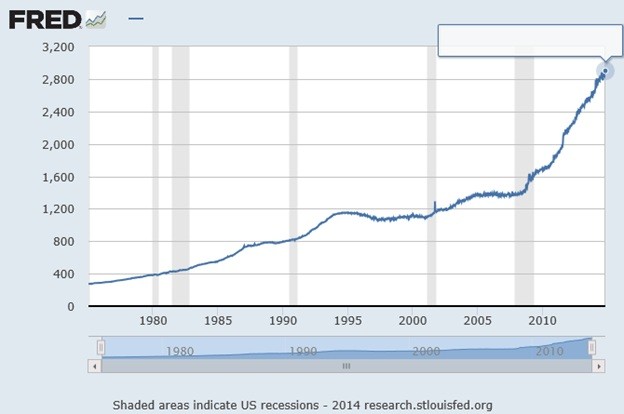
Since 1980 M-1 Money Supply has had a Compound Annual Growth Rate (CAGR) of 6.9%
However, since 2001 M-1 Money Supply has had a CAGR of 8.2%.
M-2 Money Supply
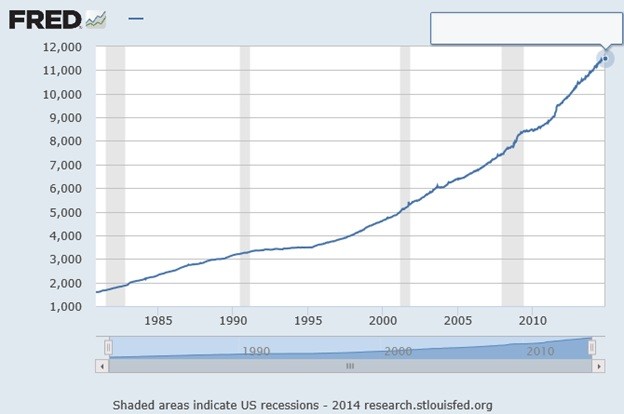
Since 1980 M-2 Money Supply has had a CAGR of 5.7%
However, since 2001 M-2 Money Supply has had a CAGR of 6.0%.
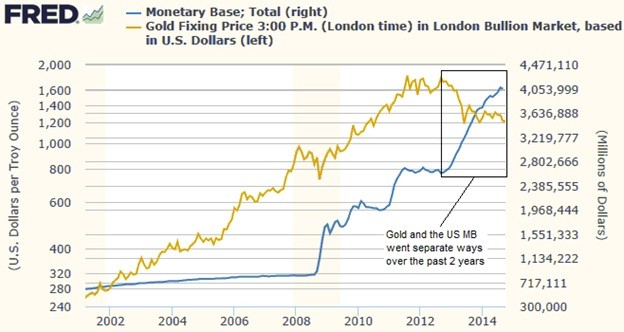
Monetary Base
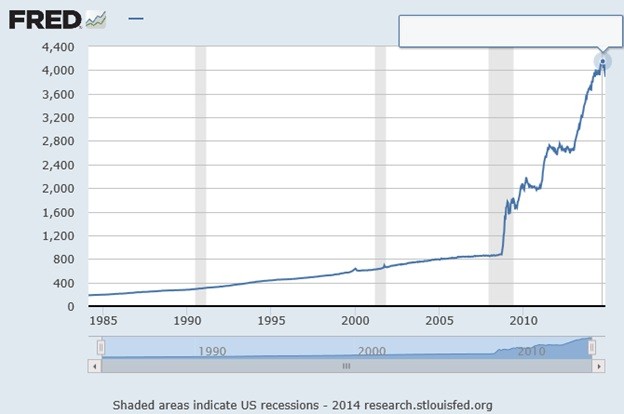
Since 1980 the US Monetary Base has had a CAGR of 10.5%
However, since 2001 the Monetary Base has had a CAGR of 13.6%.
The monetary base roughly matches the size of the Federal Reserve balance sheet, which indicates the level of new money creation required to prevent debt deflation. Previous gold bull markets ended when this ratio crossed over the 4.8 level (like in 1934 and 1980). (See Ratio chart below)
http://www.macrotrends.net/1444/gold-to-monetary-base-ratio
The next chart shows the divergence between money supply growth and the trend in the gold price that has been underway since 2011. It shows the combined balance sheet totals of Federal Reserve, ECB, Bank of England, People’s Bank of China and Bank of Japan. Whenever the money supply grows at a faster pace than the supply of physical gold, the gold price should rise and vice versa. The chart shows us that either the gold price has corrected too much, or that central bank balance sheets might stagnate or even decline in the future. However, anyone familiar with economic history knows how few precedents of sustained reductions in central bank balance sheets exist. (See chart below)
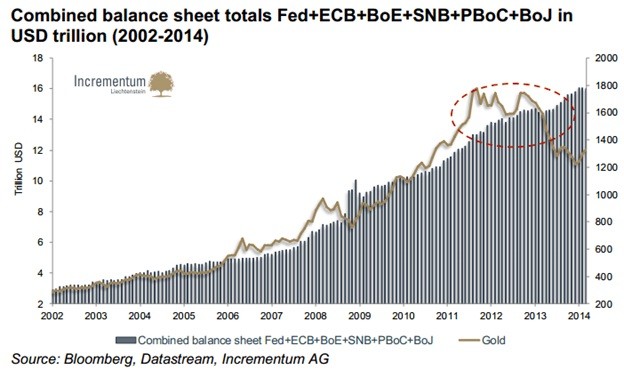
(Source: http://www.marketoracle.co.uk/Article46176.html )
Does the monetary base drive the gold price?
Without any doubt growth in the US Money Supply has had a positive effect in driving the gold price higher. To quantify the magnitude of this price driving force, one must compare the Compound Annual Growth Rates (CAGR) over protracted periods. Ergo:
From 1980 to the present, the average CAGR of M-1 and M-2 was 6.3%
During same period (1980-2014) the CAGR of the gold price was 1.2%
From 2001 to the present, the average CAGR of M-1 and M-2 was 7.1%
During same period (2001-2014) the CAGR of the gold price was 11.6%
It is obvious that since 2001 a relatively modest increase in the Money Supply produced a rather large increase in the price of gold.
Here below are the estimated gold prices in five years (2019) and in 10 years (2024)…assuming the CAGR of the US Money Supply remains the same at 7.1%...and continues the same price rising force on the price of gold (11.6% CAGR)…with all other factors remaining stable.
By 2019 the price of gold is forecast to reach $2,100.
By 2024 the price of gold is forecast to reach $3,600.
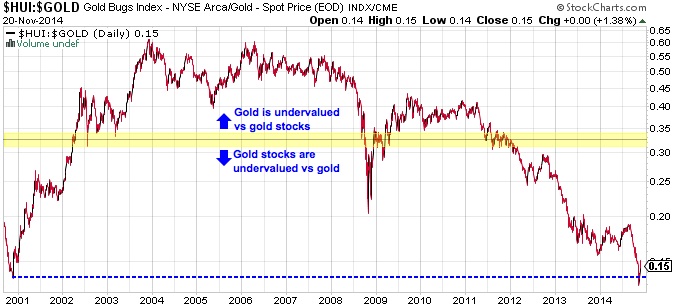
This begs the question: If indeed gold rises to $2,100 in five years and to $3,600 in 10 years, what might be the value of the HUI Index (Gold & Silver Stocks Index)? The results would be astounding to say the least! Here are the numbers. In 2003 and again in 2006, the HUI/Gold ratio topped 0.60.
In this regard sage precious metals’ analyst Jason Hamlin observes: “But it is hard to ignore the value being offered in mining stocks (HUI Index) at the moment. In fact, mining equities are the most undervalued (relative to gold) that they have been since the very start of the bull market in 2001. (See HUI/Gold ratio chart by clinking link below)
https://www.gold-eagle.com/sites/default/files/hamlin112114-3.jpg
And assuming the gold price is fuelled by an inexorably rising US Money Supply per above forecasts, then it is logical and reasonable to expect the HUI/Gold ratio to again rise to 0.60. In this event the HUI prediction is estimated to reach:
In 2019 HUI Index might top 1260…an increase of +628% from today’s value. That’s up 7X.
In 2024 HUI Index might top 2160…an increase of +1,148% from today’s value. That’s up 12X.
Frankly, these are conservative predictions for GOLD and the HUI Index based solely on steady increase in the Money Supply going forward…because there are several other factors affecting and fuelling the gold price (as mentioned at the beginning of this report).
********
9 Related Reads:
Gold Price Forecast Per US Federal Reserve Balance Sheet
Was Gold's Dip to $1,130 the Bottom?
Greenspan’s Gold Forecast Concurs With Chart Analysis
Accelerating money supply and gold prices
Money Supply & Monetary Base Fuel the Price of Gold and Silver
Golden Opportunity For Global Investors
Why Gold's Base Price Should Be North Of $2,000
Money supply and monetary base to gold price ratio: Long term charts till 2012
******


