Gold Price Forecast - The Strong Case For Gold’s Move Just Got Stronger


Gold certainly reacts with great sensitivity to fevers rising. And the most important fundamental factor right now remains the Covid-19 pandemic and what might be referred to as the Great Lockdown. We’ll open today’s article with the latest gold-related coronavirus news, and then technically assess gold’s prospects.
COVID-19 Revisited
The reason for the latter is that due to testing kits shortage, neither new reported Covid-19 cases, nor the reported Covid-19 deaths are particularly meaningful. The official US Covid-19 death toll at the moment of writing these words is 39k, and there are officially 735k Covid-19 cases in the US.
But, as we wrote previously, the real numbers are bigger, perhaps much bigger, and one of the reasons is the limited amount of testing that can be done each day. The title of this article from Milwaukee Independent summarizes it quite well: “A Shortage of Everything”.
Quoting NY governor Andrew M. Cuomo:
Supply chain problems have prevented widespread COVID-19 diagnostic testing, Cuomo said Saturday during his daily coronavirus briefing in the state Capitol.
A shortage of chemical reagents used to process COVID-19 tests created a testing bottleneck, Cuomo said. The majority of the required chemicals are manufactured in China — a supply chain flaw the governor characterized as a national security problem.
From the market’s point of view, the key take-away is whether the economy is going to be restarted anytime soon, so that’s what we’ll focus on. And there’s only one chart that we need to show you that it’s not likely to be the case.
The new cases count is not reliable, because smaller of bigger numbers of daily case count could be based not on the situation improving, but rather simply on the number of tests that were conducted on a given day.
However, if we look at how many of those who were tested on a given day were infected, and how many died, we could see whether the situation is improving or not.
And better yet, we could average out the recent daily fluctuations that could be attributed to relatively random factors by applying something we know from our technical chart analysis – a moving average.
That’s exactly what the chart below features.
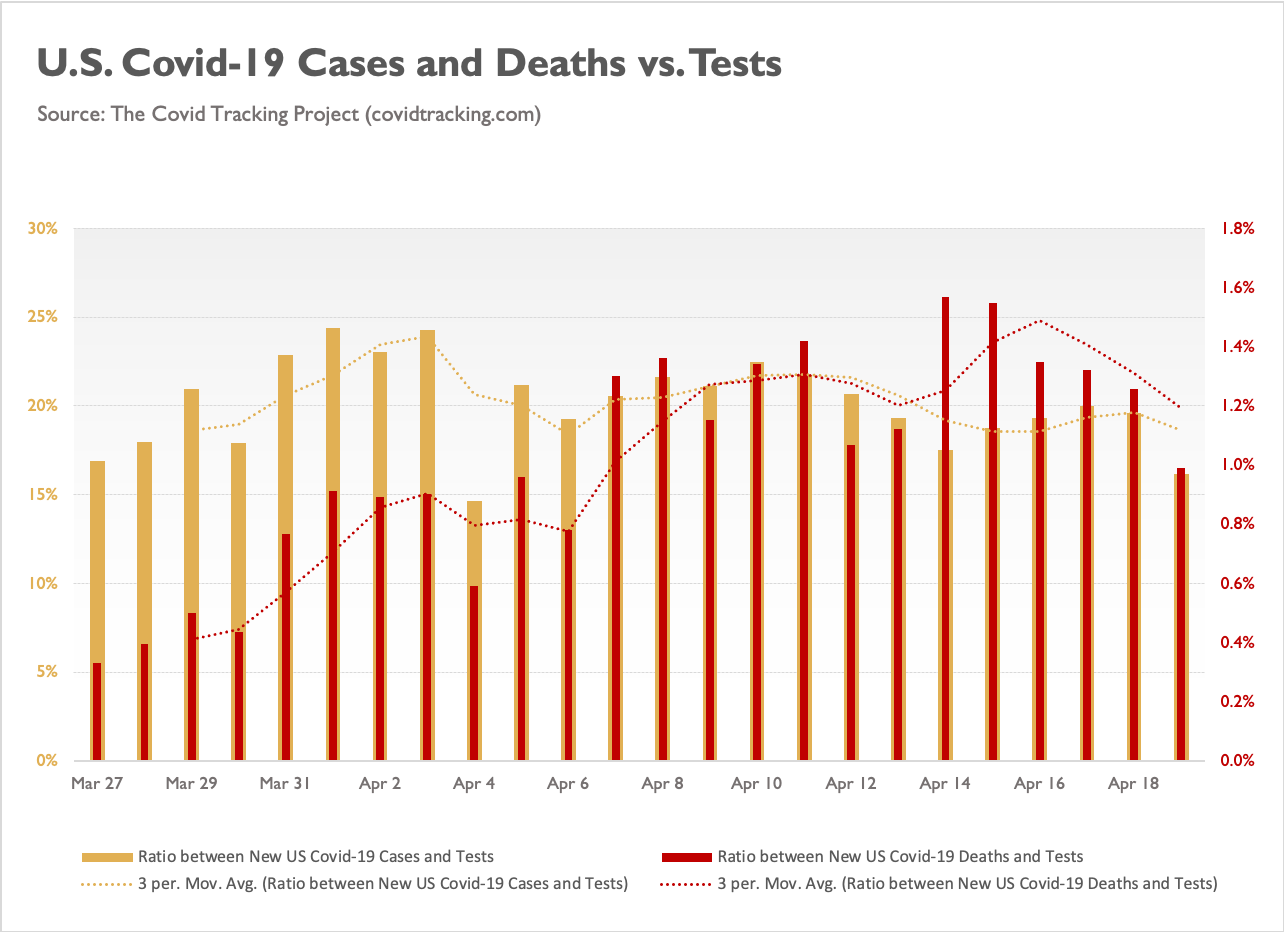
The golden bars represent the daily ratios between the new US Covid-19 cases and the US Covid-19 tests. The red bars represent the daily ratios between the daily US Covid-19 deaths and the US Covid-19 tests. The dotted lines are the 5-day moving averages of both ratios.
The dataset starts on March 27, which was the first day when the number of US cases climbed above 100k.
The key takeaway is that there is no meaningful improvement. There is a relatively stable link between the number of tests and the number of new cases. About one fifth (20%) tests result in new Covid-19 cases. There were daily back-and-forth moves in the ratio, but overall, it remains quite stable at the 20%. The exact percentage is not as important as the fact that it’s stable.
This means that the situation with new cases is not improving. Moreover, it also means that we have no idea how many more people are really infected. We would need to see both in order to really discuss the re-opening of the US economy.
The daily death toll is actually trending higher, despite temporary decreases in the ratio. The temporary declines give hopes that the worst is over, but nothing more than hope. It’s very far from a strong indication, and even further from a proof.
There’s one more blood-chilling thing that’s not that apparent. Please note that the new-cases-to-tests ratio was already at about 20% (on average) in the final days of March.
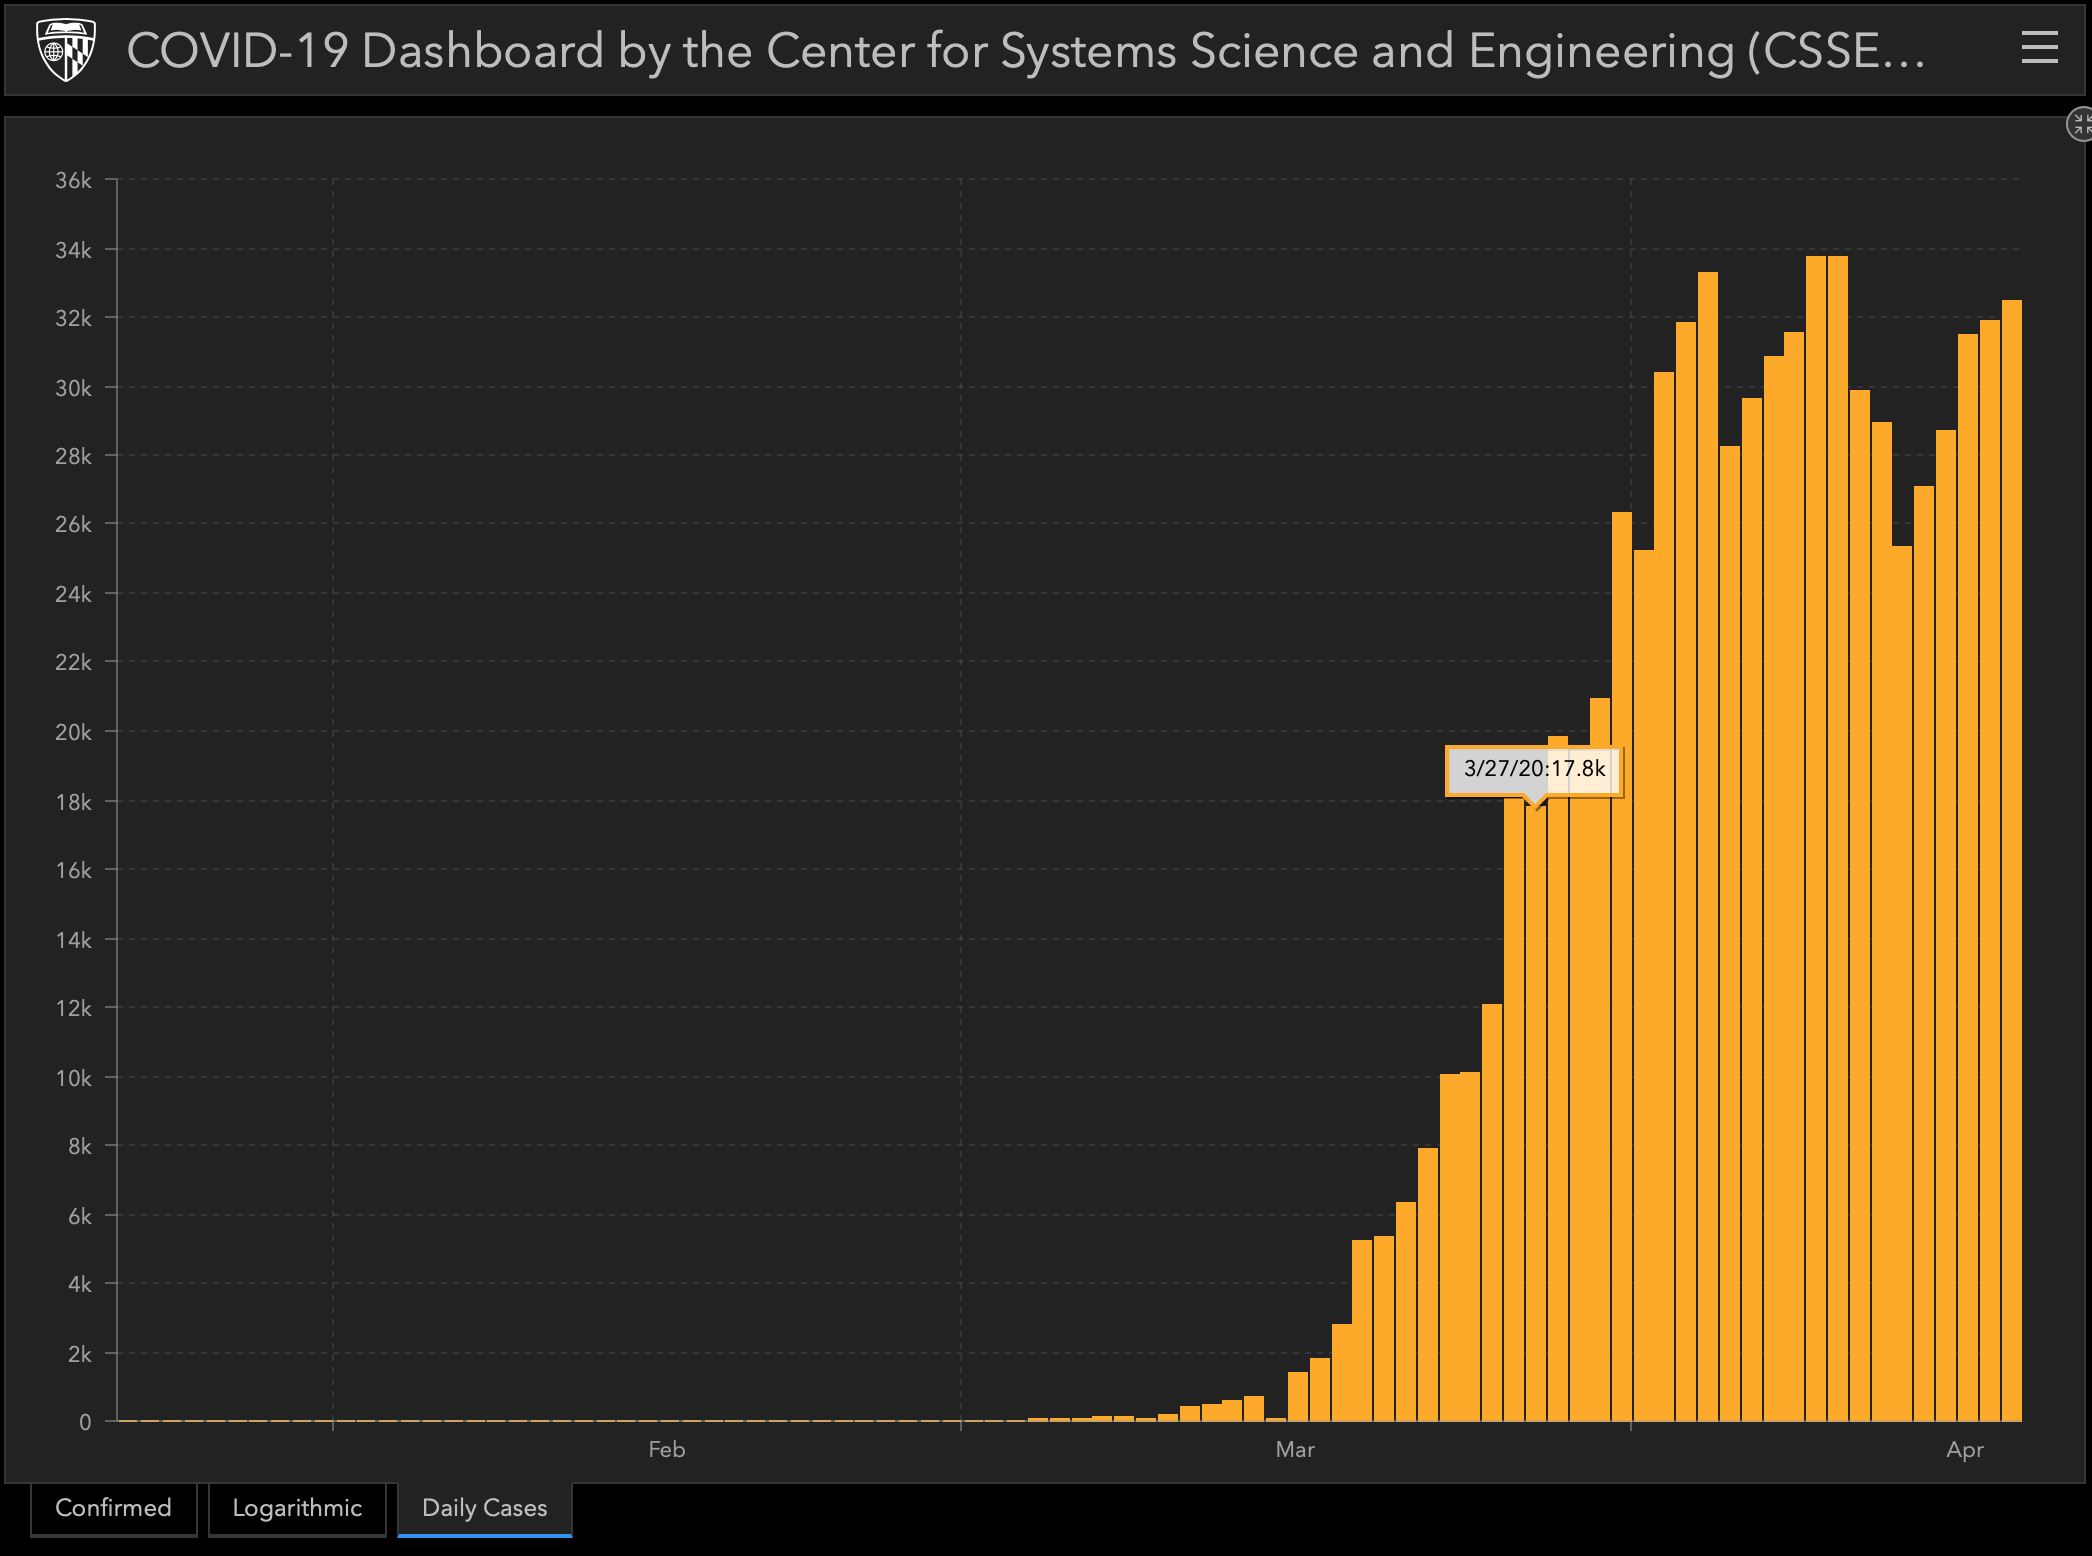
We know that the new cases continued to climb in the following days, and then plateaued out.
What if the spread of the virus was not really contained as the above chart might indicate, but what we actually saw was the maximum testing capacity that plateaued?
The problem is that it is possible that the new cases actually continued to climb at their late-March pace. They might have plateaued at a different – much higher – level, or they might have not plateaued at all. Given limited testing, we can’t know that.
This means that we are very far from being able to tell when the US economy could fully reopen, let alone be ready for reopening.
This, plus the rapid outbreaks in South America, Russia and India, confirms that the situation in the world – overall – is likely to get worse, putting further upward pressure on the US dollar.
Stocks (globally) are likely to fall further but gold will probably bottom sooner. In fact, gold bottoming despite the rising USD Index is what will be the confirmation that we will use to say that the final bottom in the precious metals market is in.
Gold, Euro and USD-Facilitated Breakdown
In other news, gold just invalidated its breakout above the previous highs in terms of the euro, and it also broke below the rising support line, which by itself is a lower border of the rising wedge pattern.
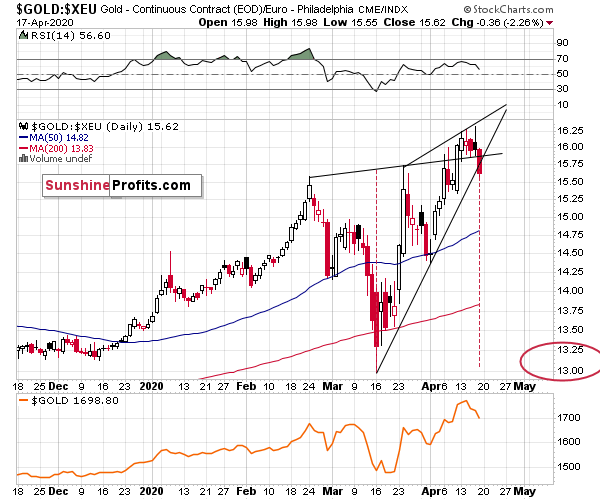
That’s a very bearish sign as it means that gold is likely to continue to magnify USD’s rallies as it declines.
Gold just invalidated the breakout above the $1,700 level and the breakout above the inverse head-and-shoulders formation in intraday terms. This is a major sell confirmation.
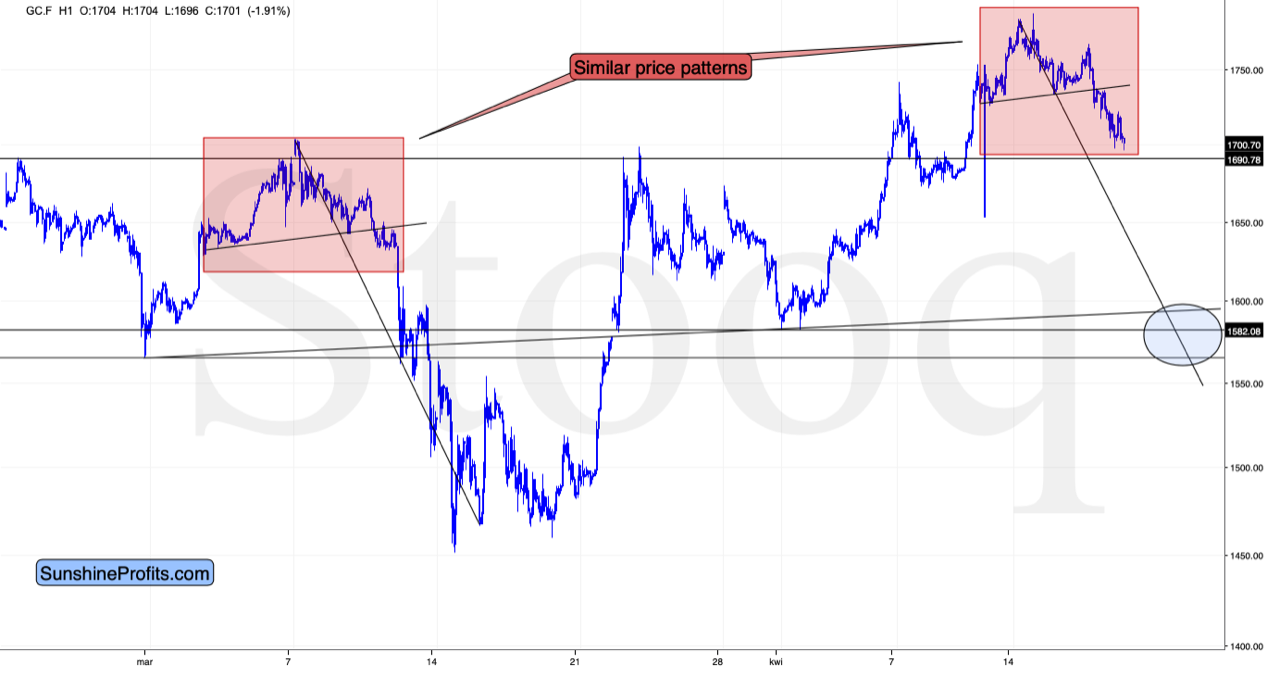
Moreover, on a short-term note, we see that the USD Index wasn’t the only market that’s been repeating its early March performance. Gold has been trading in a very similar way as well. We marked the similar patterns with red rectangles.
Back in March, gold topped in a head-and-shoulders form, and we saw the same pattern also recently. In March, gold plunged as it got a strong boost from the rising USD Index.
Right now, gold didn’t get the USDX boost, and… It’s been declining decisively nonetheless. This is a very bearish combination, because it shows that gold just can’t wait to slide lower.
The next support is theoretically at the early April lows, but given gold’s weakness relative to the USDX and the fact that the latter is likely to soar shortly, it seems rather unlikely that gold will decline by just $25 or so. A move several times larger seems more likely. The nearest strong support level that fills this requirement is the early April low – a bit below $1,600.
That’s our next interim target that could generate a (dead cat) bounce before the decline continues.
Summary
There’s a strong case to be made that the worst in the coronavirus pandemic isn’t over just yet, both in the US and around the world at large. The dollar is strengthening and not only is the yellow metal magnifying its moves as it declines against the greenback, but is experiencing a breakdown from the rising wedge against the euro. Gold is about to move profoundly in the coming days, to the surprise of those on the long side.
The following days are not likely to be pleasant times for anyone who refuses to jump on the bullish bandwagon just because prices moved higher in the previous months. But what’s profitable is rarely the thing that feels good initially. As silver often moves in close relation to the king of metals, forecasting gold’s rally without a bigger decline first is thus likely to be misleading. The times when gold is trading well above the 2011 highs will come, but they are unlikely to be seen without being preceded by a sharp drop first.
Naturally, the above is up-to-date at the moment of publishing and the situation may – and is likely to – change in the future. If you’d like to receive follow-ups to the above analysis, we invite you to sign up to our gold newsletter. You’ll receive our articles for free and if you don’t like them, you can unsubscribe in just a few seconds. Sign up today.
Przemyslaw Radomski, CFA
Editor-in-chief, Gold & Silver Fund Manager
Sunshine Profits - Effective Investments through Diligence and Care
* * * * *
All essays, research and information found above represent analyses and opinions of Przemyslaw Radomski, CFA and Sunshine Profits' associates only. As such, it may prove wrong and be subject to change without notice. Opinions and analyses are based on data available to authors of respective essays at the time of writing. Although the information provided above is based on careful research and sources that are deemed to be accurate, Przemyslaw Radomski, CFA and his associates do not guarantee the accuracy or thoroughness of the data or information reported. The opinions published above are neither an offer nor a recommendation to purchase or sell any securities. Mr. Radomski is not a Registered Securities Advisor. By reading Przemyslaw Radomski's, CFA reports you fully agree that he will not be held responsible or liable for any decisions you make regarding any information provided in these reports. Investing, trading and speculation in any financial markets may involve high risk of loss. Przemyslaw Radomski, CFA, Sunshine Profits' employees and affiliates as well as members of their families may have a short or long position in any securities, including those mentioned in any of the reports or essays, and may make additional purchases and/or sales of those securities without notice.
 Przemyslaw Radomski, CFA, is the founder, owner and the main editor of SunshineProfits.com. You can reach Przemyslaw at: http://www.sunshineprofits.com/help/contact-us/.


