Gold Price Forecast: Swan Dive Comes Right on Schedule


 From the comments made in past articles, the last key low for Gold came back in November of 2022, with that low coming from the combination of 72 and 310-day cycles. From that low, strength was expected to play out into January of this year - before topping the smaller of the two waves, the 72-day cycle.
Gold's 310-Day Cyclical Component
In terms of price, it was our confirmed reversal above the 1680 level back in November of 2022 which confirmed a mid-term bottom in place for Gold, which targeted an eventual move back above the 1950's - simply based upon a statistical analysis of our bigger 310-day cycle, shown below:
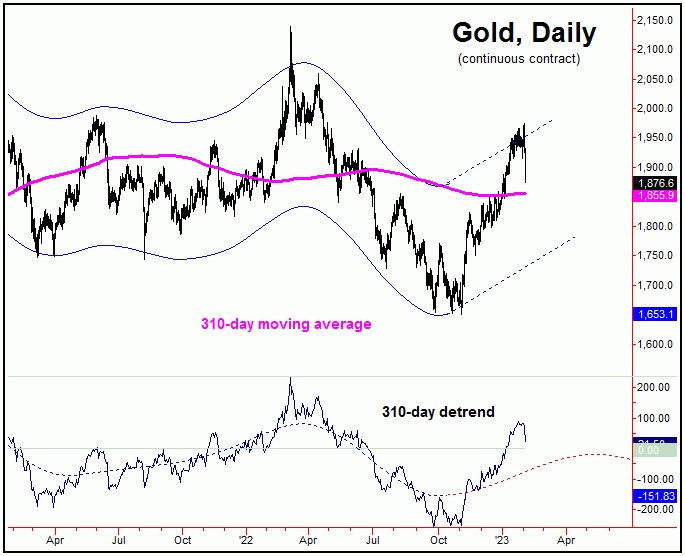
Going further with the above, Gold saw an additional 290 points of additional strength through our reversal figure, with that hitting our expected upside target of 1950. This target was arrived at, simply using a pattern analysis of this 310-day wave - with this cycle often seeing average rallies of 20% or more from trough-to-peak.
With the above said and noted, in looking at our 310-day detrend's projection, the overall position of our 310-day wave is currently seen as pointing higher into later this Spring, where we expect the next mid-term peak to form for the metal. In-between, however, Gold is now confirmed to be in a shorter-term correction phase, coming from our smaller 72-day cycle component.
Gold's 'Swan Dive' Comes from 72-Day cycle
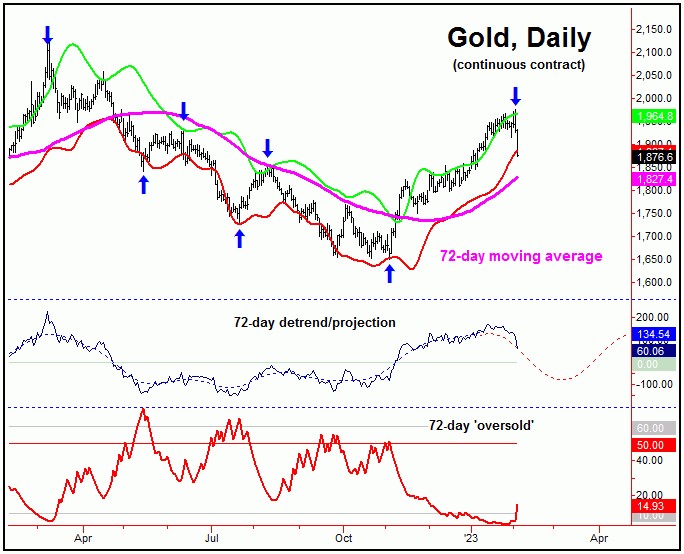
As mentioned above, the next correction of significance was due to materialize for Gold - coming from our 72-day time cycle, which is shown again on the chart below:
From my January 16th article: "our 72-day cycle is into topping range, and with that could peak at anytime. Having said that, you can't pick tops - unless there is a preponderance of supporting evidence from technicals. With that, Gold would currently need to see a reversal back below the 1824.00 figure (February, 2023 contract), a number which is expected to rise sharply in the days ahead, with the latest figures always posted in our thrice-weekly Gold Wave Trader market report."
Back in January, I mentioned that it would take a reversal back below the 1824.00 figure (at the time, the February, 2023 contract) to confirm this 72-day wave to have turned south - a number which was expected to rise. That figure was able to contain the downside, and thus the continued rise to higher highs into early last week.
Having said the above, by last Thursday, our downside 'reversal point' figure (always posted in our Gold Wave Trader report) had moved up to the 1912.60 figure for the April, 2023 contract. This was taken out to the downside early in Friday's session, thus triggering the downward phase of this 72-day cycle to be back in force.
In terms of price, upon the reversal below the 1912.60 figure, our minimum target was back to the 34-day moving average for Gold - simply due to the fact that a smaller 34-day wave was also due to turn south, along with our 72-day cycle; this 34-day moving average was easily met with Friday's decline. Having said that, the 72-day moving average is the more ideal price magnet in the days/weeks ahead.
Mid-Term Picture for Gold
With the above said and noted, the correction phase of our 72-day cycle is deemed to be in force, with the next low of significance expected to come from the same. In terms of patterns, the current decline is favored to end up as a countertrend affair, inside the larger upward phase of our bigger 310-day component.
Going further with the above, the next upward phase of the 72-day cycle should see a rally of around 14% off of whatever bottom that forms with this wave, which is its statistical average rally - when coming off the pattern of a 'higher-low'. In terms of time, these average rallies have lasted 35-40 trading days or more before peaking, thus giving us at least some early idea of what to expect - once this wave troughs.
For the bigger picture, the next upward phase of our 72-day cycle should be the one that eventually peaks the bigger 310-day component - ideally sometime on or after mid-to-late Spring of this year. From there, the largest-percentage decline of the year - something in the range of 20% off the top - is expected to unfold, as this 310-day wave turns south into late-2023.
Jim Curry
The Gold Wave Trader
http://goldwavetrader.com/
http://cyclewave.homestead.com/
********


