Gold Price Forecast: What Does USDX’s Déjà Vu Moment Mean For Gold?


 It’s uncanny how the USDX is mirroring its 2017-2018 moves. This remarkably similar pattern is a strong indicator of the dollar’s rising strength.
And as we all know, a strong dollar does not bode well for gold.
The yellow metal is currently experiencing a corrective moment amidst a bigger downswing, while the miners are undergoing a decline on bigger volume than they had during last week’s correction. Overall, the signals remain bearish for the precious metals.
In yesterday’s flagship Gold & Silver Trading Alert, I emphasized that the next short-term top had most likely already formed last Thursday (Apr. 8). The basis for this was the triangle-vertex-based reversal in gold as well as the USD’s correction that appears to be analogous to its 2018 correction that was followed by another powerful rally.
In short, the above expectation (and reasoning behind it) remains up-to-date. Let’s start today’s discussion with a look at the USD Index.
The USD Index
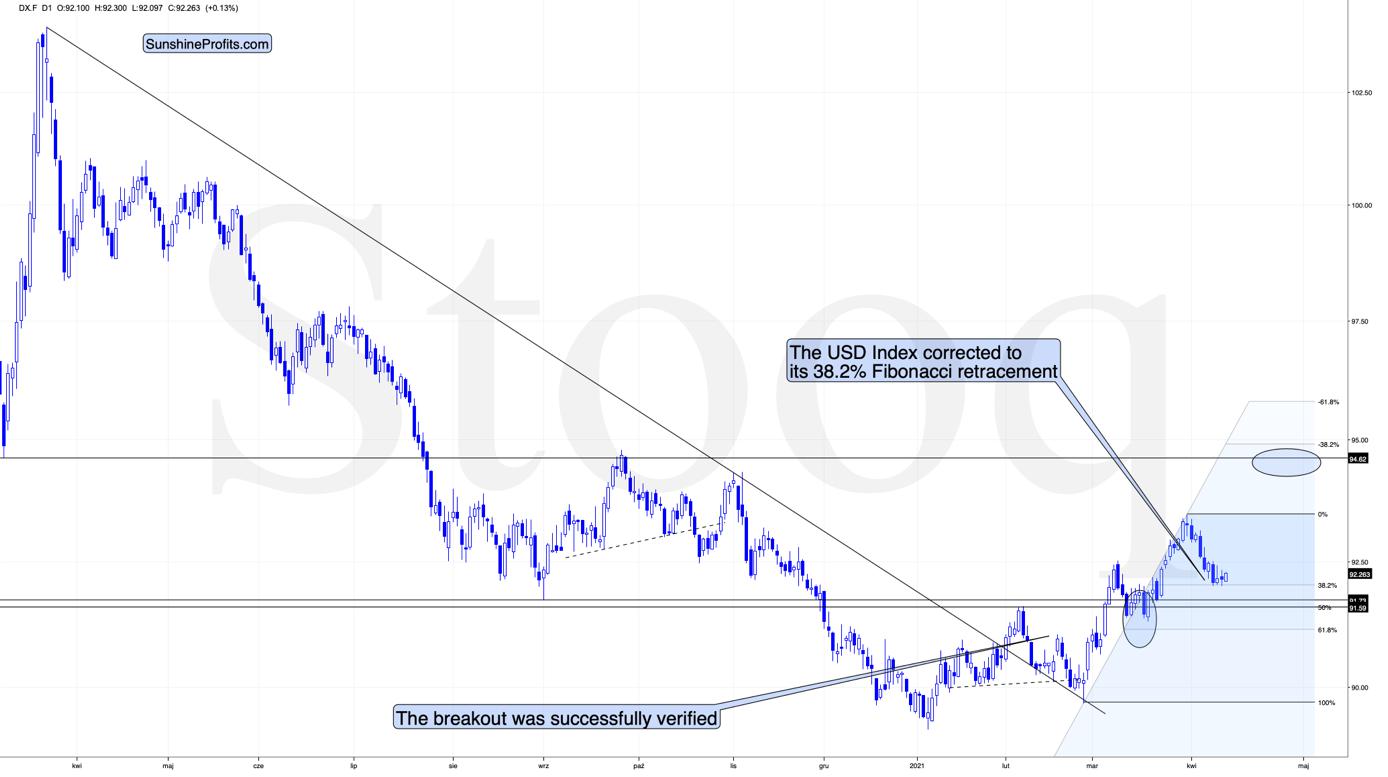
In short, the USD Index is trading sideways after moving to its mid-2020 lows and to its 38.2% Fibonacci retracement level. This combination of support levels has likely created a bottom in the USD Index, but that’s not the only factor that needs to be considered. The other – very important factor – is the continuous similarity in the USDX to how it rallied in 2018 after a very similar yearly decline. I wrote about it previously, and these comments remain up-to-date.
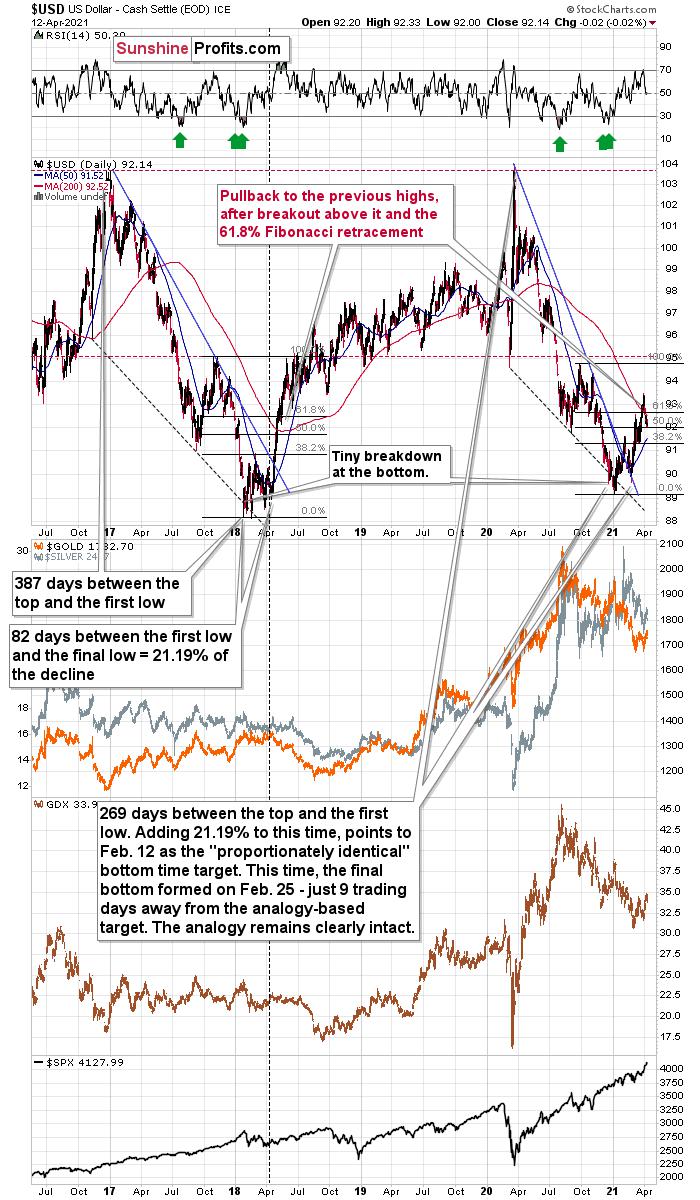
The similarity between two declines (2017-2018 and 2020-2021) is so big that it’s almost useless to describe it. Almost identical starting points, extremely similar ending points, and a very similar correction after the first half of the decline. The recent decline was a bit shorter, but otherwise both price moves are almost identical.
In both cases, the declines have ended below 90 and the final confirmation came when the USD Index rallied above both: its declining blue resistance line, and the 50-day moving average, which is also marked in blue. There was also – in both cases – a pullback after the USD Index soared above its 200-day moving average that I marked in red. That’s the “you are here” point on the roadmap.
What’s next? Most likely another sharp short-term upswing.
Given the magnitude of the 2017-2018 upswing, ~94.5 is likely the USD Index’s first stop. And in the months to follow, the USDX will likely exceed 100 at some point over the medium or long term.
Keep in mind though: as far as the fundamentals of different currencies are concerned, we’re not bullish the greenback because of the U.S.’s absolute outperformance. It’s because the region is doing (and likely to do) better than the Eurozone and Japan, and it’s this relative outperformance that matters, not the strength of just one single country or monetary area. After all, the USD Index is a weighted average of currency exchange rates and the latter move on a relative basis.
If the USD Index is practically done correcting, then the rally in the precious metals is also over, and that’s exactly what the charts are saying.
Gold
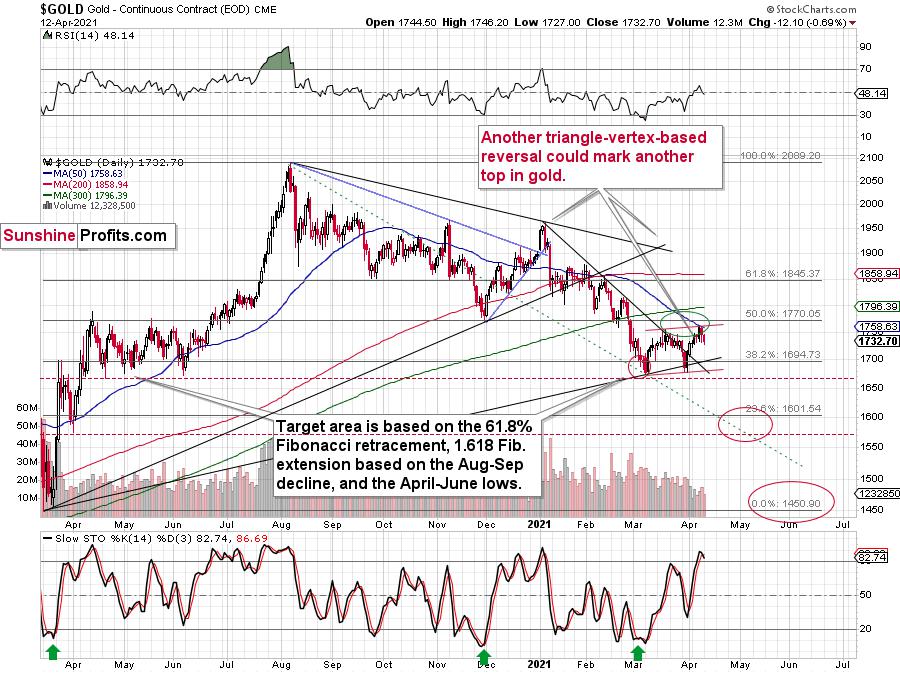
Gold topped right at its triangle-vertex-based reversal, just like it did in mid-March and in early January (please note the points that are marked on the above chart for confirmation – they are described in red). That happened on Thursday (Apr. 8), and since that time gold continue to move lower (also during today’s pre-market trading).
Gold invalidated the breakout above its mid-March highs, proving that what we saw was nothing more than just an ABC (zigzag) correction within a bigger downswing. The moves that follow such corrections are likely to be similar to the moves that precede it. In this case, the move that preceded the correction was the 2021 decline of over $150. This means that another $150+ decline could have just begun.
Miners: GDX and GDXJ ETFs
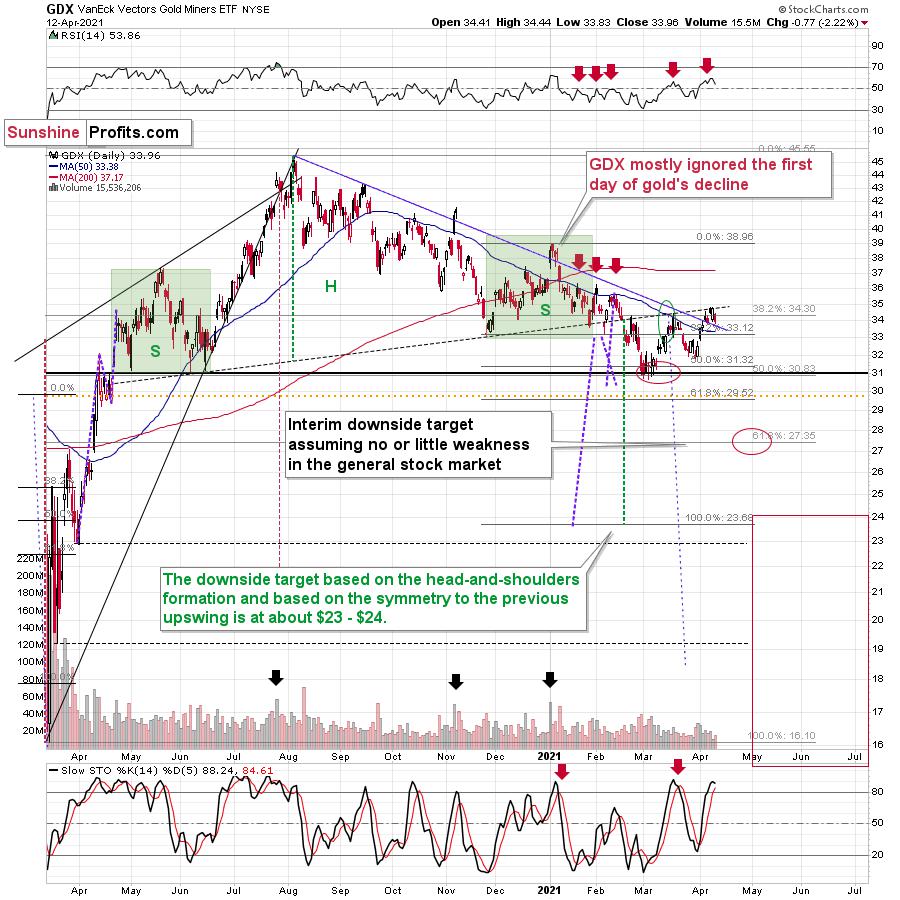
Just like the GDX ETF invalidated the breakout above its mid-March highs, it once again verified the breakdown below the broad head-and-shoulders pattern. Also, please note that the volume that accompanied yesterday’s (Apr. 12) decline was bigger than that which accompanied Friday’s (Apr. 9) intraday rally.
The implications are bearish, and we can say the same about the implications of the situation in the GDXJ chart.
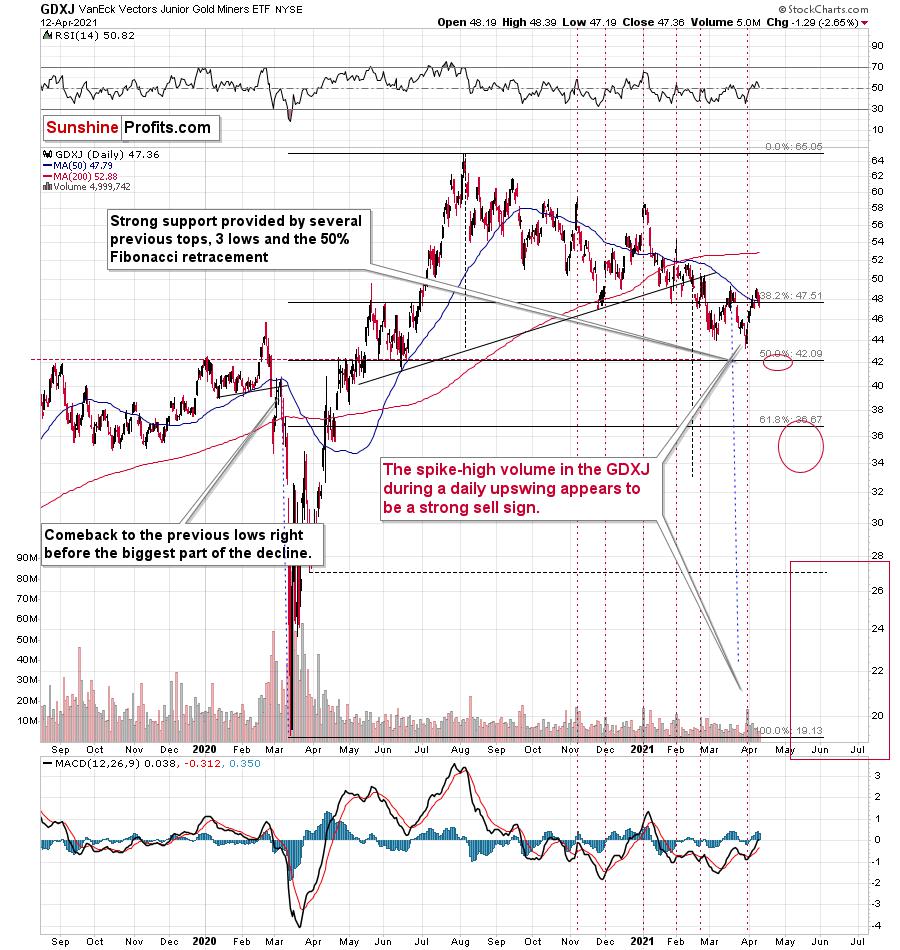
In this case, we even saw the invalidation of the breakout above the 50-day moving average.
Even more interesting is that the GDXJ to gold ratio that I described previously, has just invalidated its small breakout above its declining resistance line.
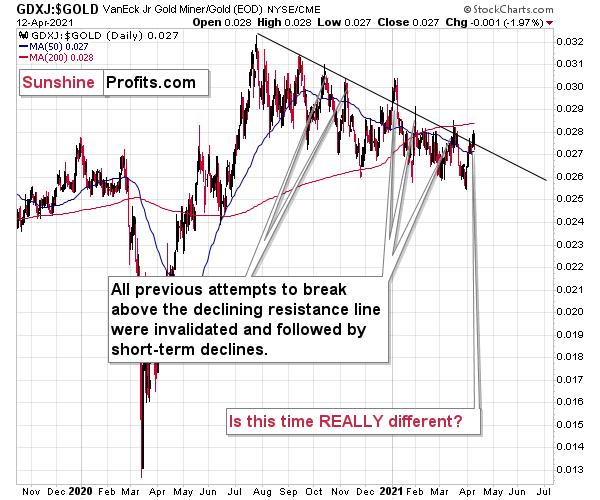
Yesterday, I commented on the above in the following way:
The breakout in the GDXJ to gold ratio is only tiny and unconfirmed. These moves always (since Oct. 2020) provided sell signals – the small breakouts below the declining resistance line were always invalidated and they were then followed by visible short-term declines.
Five out of five previous attempts to break above the declining resistance line failed and were followed by short-term declines. Is this time really different?
It seems to me that the five out of five efficiency in the GDXJ to gold ratio is more important than a single breakout in the GDX to gold ratio, especially considering that the latter was preceded by a similar breakout in mid-March. That breakout failed and was followed by declines.
The implications of yesterday’s invalidation of the breakout in the ratio are clearly bearish.
Summary
For gold, any small corrective upswing from here is bound to be temporary, and the most recent short-term rally is already running out of strength.
Conversely, the USD Index is gathering steam and appears to be finished its corrective downswing. Its rise can only signal more trouble for the precious metals.
Gold’s corrective action is pretty much over (or just about to be), and the weeks that follow are not likely to be pleasant times for anyone who jumps on the bullish bandwagon just because prices moved higher in the previous months or based on some forum posts. Tread carefully.
What’s profitable is rarely the thing that feels good initially. As silver often moves in close relation to the yellow metal, forecasting gold’s longer term rally without a bigger decline first is thus likely to be misleading. Silver is likely to slide as well. The times when gold is continuously trading well above the 2011 highs will come, but they are unlikely to be seen without being preceded by a sharp drop first.
Thank you for reading our free analysis today. Please note that it is just a small fraction of today’s all-encompassing Gold & Silver Trading Alert. The latter includes multiple premium details such as the outline of our trading strategy as gold moves lower.
If you’d like to read those premium details, we have good news for you. As soon as you sign up for our free gold newsletter, you’ll get a free 7-day no-obligation trial access to our premium Gold & Silver Trading Alerts. It’s really free – sign up today.
Przemyslaw Radomski, CFA
Founder, Editor-in-chief
Sunshine Profits - Effective Investments through Diligence and Care
* * * * *
All essays, research and information found above represent analyses and opinions of Przemyslaw Radomski, CFA and Sunshine Profits' associates only. As such, it may prove wrong and be subject to change without notice. Opinions and analyses are based on data available to authors of respective essays at the time of writing. Although the information provided above is based on careful research and sources that are deemed to be accurate, Przemyslaw Radomski, CFA and his associates do not guarantee the accuracy or thoroughness of the data or information reported. The opinions published above are neither an offer nor a recommendation to purchase or sell any securities. Mr. Radomski is not a Registered Securities Advisor. By reading Przemyslaw Radomski's, CFA reports you fully agree that he will not be held responsible or liable for any decisions you make regarding any information provided in these reports. Investing, trading and speculation in any financial markets may involve high risk of loss. Przemyslaw Radomski, CFA, Sunshine Profits' employees and affiliates as well as members of their families may have a short or long position in any securities, including those mentioned in any of the reports or essays, and may make additional purchases and/or sales of those securities without notice.
********
 Przemyslaw Radomski, CFA, is the founder, owner and the main editor of SunshineProfits.com. You can reach Przemyslaw at: http://www.sunshineprofits.com/help/contact-us/.


