Gold Price Goes 'Thunk'…And 'Tis A Good Healthy Thing


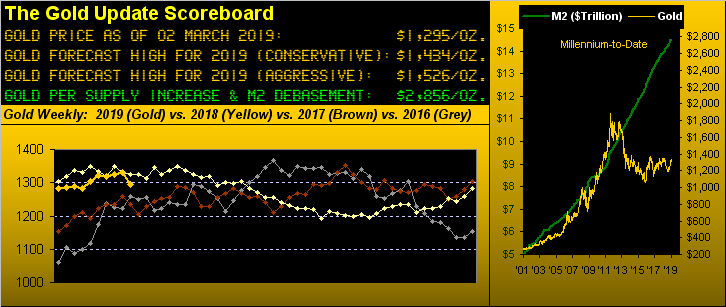
Cue Willie Nelson from back in '67 as we open straightaway with "Turn out the lights the party's over. They say that all good things must end..."Which is what Gold's 24-week parabolic Long trend just did, the nearly six-month ascent ranking third by duration since 2001. Price settled yesterday (Friday) at 1295 for its worst weekly drop (-2.7%) since that ending 28 November 2014 (-2.9%). ~~THUNK!~~
To wit as we herein penned a week ago "...we have to think the "Baby Blues" [our measure of daily trend consistency] are suggestive of the precious metals getting a case of the blues such that Gold's parabolic Long trend now 24 weeks old shall likely soon fold..." And so it did. And 'tis a good thing.
"A good thing, mmb???"
Absolutely right, Squire. Now pay attention. With Gold starting this past week still well up in the 1330s, we began thinking that a correction in price would be healthy as nothing ascends upward in perpetuity. We ruminated that a nice pullback toward testing the mass of underlying technical support would provide enough tightened coil to then spring price back upward beyond the most recent high of 1349 (20 February), once again giving Gold a shot at reaching Base Camp 1377. 'Tis our sense that such process now is underway: first this "thunk" ... consolidate ... and then back up! Remember: a recapturing of 1377 with a stabilizing of price 'round there, and then 'tis off toward our conservative forecast high (now for the second year running) at 1434. That's why this "thunk" is a good thing. That said, the pretty picture of Gold's weekly bars instead now sports its first red dot blemish since 07 September:

Too, we've emphasized in recent missives that in spite of the lengthy duration of this just-concluded up run, it didn't cultivate the upside percentage punch that has characterized similar multi-month up moves. To wit in above graphic, the ascent was not enough to rotate the dashed regression trendline across the entirety of the chart from down to up. But if you've been keeping up to date with The Gold Update, you know that since 2001 there've only been two such up trends of longer duration, which brings us to this neat bit: the 25-week Long stint (ending 31 December 2004) was followed by only 10 weeks of parabolic Short trend before resuming upward ... and the 26-week Long stint (ending 23 December 2005) was followed by a mere three weeks of Short trend before again flipping back to Long. Given Gold's support now here in these otherwise annoying Whiny 1290s -- and in turn the thick support slab of The Box (1280-1240) -- price can gather itself together through these ensuing weeks in prepping for the next upside launch.
Also it now being month's end (plus one trading day), let's go from this time a year ago with Gold's percentage track along with those of several key precious metals equities. And with Newmont Mining (NEM) opening its jaws for Goldcorp (GG) for $10 billion -- (notwithstanding Barrick Gold instead opening its jaws for NEM for $18 billion) -- we've removed GG from our graphic and per a fine friend's recommendation replaced it with mighty Pan American Silver (PAAS). And here's how they compare, best-to-worst, across the last 12 months: Franco-Nevada (FNV) is +5.5%; the VanEck Vectors Gold Miners exchange-traded fund (GDX) is +0.6%; Gold itself is -1.8%; NEM is -11.3%; the Global X Silver Miners exchange-traded fund (SIL) is -12.5%; and PAAS (sometimes ya gotta start last) is -17.3%. So why highlight PAAS?
Fundamentals aside and notwithstanding our usual disclaimer that "We're not a stocks person", let's take a layman's look at a few common sense numerical measures for PAAS. From one year ago-to-date, the average price of PAAS relative to Silver (i.e. the PAAS/Silver ratio) is a pristine 1.00x. But at present 'tis only 0.83x. That gives a tip of arbitrage leverage to PAAS right there. But wait, there's more: from one year ago-to-date, the average Gold/Silver ratio is an uncannily high 81.75x. But at present 'tis higher yet at 85.02x. More leverage. And more broadly, we've the millennium-to-date average of the Gold/Silver ratio at only 64.02x. Leverage upon which one can live? PAAS' all-time high came on 14 March 2008 at 44.10. Then from December 2010 into April 2011 PAAS teased the lower 40s on multiple surges. And yet today finds PAAS at a comparatively meager 12.69. 'Course then there's First Majestic Silver (AG), but as we confided in our friend, one first must "paas" muster before becoming "majestic". Ok, you can bring out the hook.
Moving right along, with January, February and a day of March in 2019's books, 'tis time to bring up our BEGOS Markets Standings, again featuring Oil well on top of the stack. Things that make the world go are leading the show, with all the safe havens being left back on the rack:
But then from the "Party Crasher Dept." comes the Economic Barometer. Have you noticed its decline stretches all the way back to last June and yet the so-called brightest of economic bulbs out there are only recently suggesting things might be slowing down? Where were they throughout the latter half of 2018? Speaking of down, that's what this market-leading tool is telling us, (as continues to be the suggestion of the unsupportive Moneyflow data and our "live" S&P price/earnings ratio of 30.6x). Tick tick tick tick tick...:
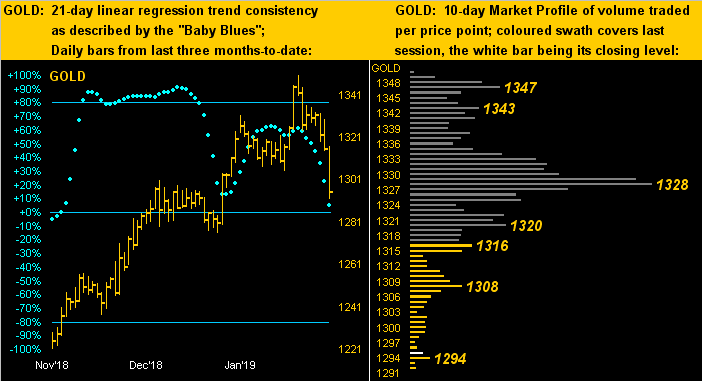
Now zooming in on near-term Gold, as mentioned off the top, a week ago the "Baby Blues" which denote linear regression trend consistency were not looking very healthy. And we thus see the ensuing fallout here on the left in the panel of Gold's daily bars from three months ago-to-date ... that's called takin' a bona fide header. No surprise therefore that on the right in Gold's 10-day Market Profile we find price down in the bargain basement of The Whiny 1290s:
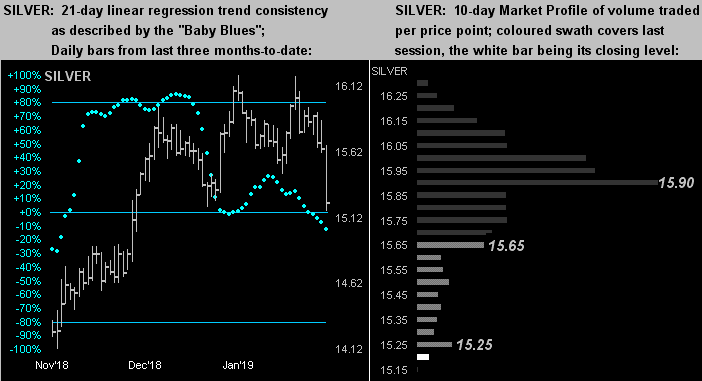
As for poor ole Sister Silver, she remains in that trap wherein when Gold goes up, she kinda goes up; but when Gold goes down, she really goes down. On the left, Silver's "Baby Blues" and on the right her Market Profile. From kinda pretty to ... in a heartbeat ... really ugly:
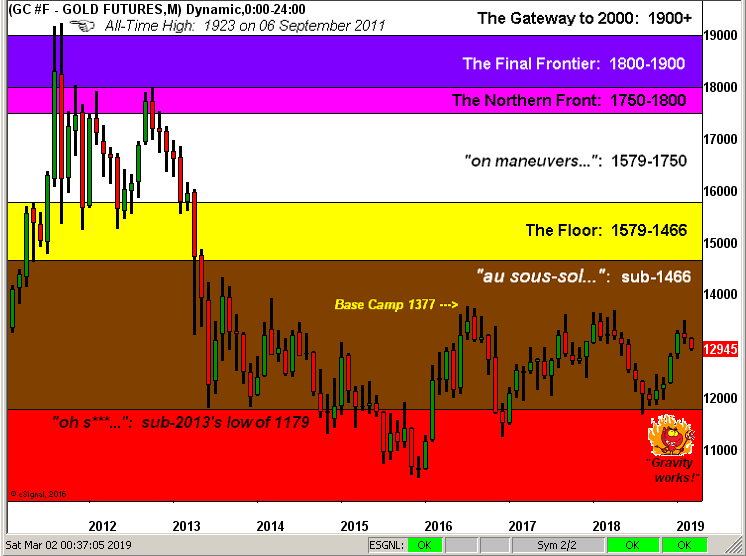
Finally we turn to Gold's broad structure by the monthly bars since 2011's All-Time High at 1923, a level which we firmly say (by some conservatively so) shall be revisited. We don't expect such to occur this year, but when it comes, it could well so do quite swiftly. Remember: the trading activity from the 1600s down through the 1400s was comparatively sparse; not a pure "gap" mind you, but forget-thee-not the trader's axiom that "All gaps get filled". Technically we've Gold now having entered a healthy corrective mode. And fundamentally we've so many Gold positives they could fill (and have filled many) a book. Here's the Structure:
Willie opened for us with the party being over; now Roy Orbison closes it out from back in '64 with "it's over, it's Over, it's OVER" But all that's just in recognition of Gold's podium-worthy 24-week parabolic Long trend having reached its end. Rather, for those of you who understand the Gold Story, the real upside is only beginning!

Mark Mead Baillie has had an extensive business career beginning in banking and financial services for two years with Banque Nationale de Paris to corporate research for three years at Barclays Bank and then for six years as an analyst and corporate lender with Société Générale.
For the last 22 years he has expanded his financial expertise by creating his own financial services company, de Meadville International, which comprehensively follows his BEGOS complex of markets (Bond/Euro/Gold/Oil/S&P) and the trading of the futures therein. He is recognized within the financial community of demonstrating creative technical skills that surpass industry standards toward making highly informed market assessments and his work is featured in Merrill Lynch Wealth Management client presentations. He has adapted such skills into becoming the popular author each week of the prolific “The Gold Update” and is known in the financial website community as “mmb” and “deMeadville”.
Mr. Baillie holds a BS in Business from the University of Southern California and an MBA in Finance from Golden Gate University.


