Gold Price! Gold Price!


There is a well-known fable of the shepherd boy who became bored and felt lonely while he was watching over the sheep of the village and shouted, ‘ Wolf! Wolf!’. The villagers heard him and, grabbing their fighting sticks, rushed to protect the flock – only to be quite upset to find it was only a joke. This happened more than once. One day a real wolf did come and there was no reaction from the villagers when the shepherd boy shouted the warning cry and a fat sheep got eaten. Since the post-2011 bear market had started, there often happened something in the PM markets that had us commentators writing, “This is it! The Bull has returned”, only again to be disappointed when the incipient rally flops. Like the cry of ‘Wolf!’ that became stale, the same may have happened to the PM market. Until the golden wolf . . .
Some time, not too long ago, there was the never before event that the OI of both gold and silver plummeted during only a few days. What made this unique in more than just the magnitude of the change is that there was no significant move in their prices. For that to happen to the degree it did in such a short time implies that a large and equal number of longs and the shorts, after having stared at each across over the bid-offer spread for years, suddenly and out of the blue decided to meet each other in the middle and close their respective open positions.
Nothing special in the news hinted as to a reason for both sides of the market to act as if they had completely lost interest in keeping their positions open, doing so at the same time. A very large number of both parties simultaneously waved the white flag, capitulated and retired. Very strange indeed! No wonder so many comments, including my own, hit the internet to say the manipulating banks have closed their short positions to the extent that they are going net long and the Bull has left the starting gates, so to speak.
Earlier, when gold bottomed at the end of 2015 and then in 2016 took off into a near steady rising trend, the message that our long wait was over and the bull was back reverberated through blogs and bullion chat rooms. By July the price of gold was up by 30% from the December 2015 low and gold bulls were euphoric. By mid December 2016 the price was down 17% off the July high. Those who remained patient after December 2016 saw the price of gold in April of 2018 again within a hair’s breadth of the 2016 high, only to fall 13% by August. Another example of the cry of ‘Gold! Gold!’ that came to naught.
Since then the price has crept higher at snail’s pace, only to remain trapped below $1300 despite umpteen recent attempts to challenge and break higher. Ten days ago the price was again slaughtered, but the fall did not extend much lower before the price steadied and then ended last week with a bounce to a little below $1300.
Compared to previous behaviour over a long period of time, this is a surprise; a big one. Monday is OPEX when Comex options on gold futures expire and Wednesday is FND or First Notice Day for February futures. In the past, at least the week before these red-letter days on the Comex futures market saw the prices of the metals under severe pressure. The Cartel wanted to make sure that many of the options and the futures they sold during the preceding 10 weeks or so will be out of the money so that they can bank the premiums with a big smile on their collective face.
They did so again to good effect starting ten days ago. Gold fell to below $1280 and silver to below $15.30 and it seemed history would repeat itself, for relatively few recently purchased options and futures to end in the money. Therefore the jump in the price of gold from a close of $1283.10 on Thursday and of silver at $15.32 to end the week at $1297.40 and $15.64 respectively, is very much against the norm. That gold’s OI on Friday jumped by 15 425 contracts while that of silver also gained 4887, adds to the volume of the cry of ‘Gold! Gold!’ to be heard across much of the internet. It does not require all that much to trigger new bullish sentiment in the PM market and what happened last week is almost unique.
Is this going to be another of those ‘Wolf! Wolf!’ calls of the fable? However, if the PM fundamentals hold true as we all accept, a time will come when, as the wolf did in the fable, these facts will eventually trigger a lasting bull market in the metals. It is not possible to predict when it will happen. But, each ‘Gold! Gold!’ call that fails to become the new reality, must bring the PM market closer to the time when the effort to suppress the prices no longer succeeds. May it come soon!
A long term analysis of the SP500 monthly average since 1871 – chart not shown because it appears in an academic paper under preparation – prove good evidence that the average for August 2018 should have been a new all time high. Following the January 2018 high at an average of 2789.80, the SP500 plummeted steeply to reach 2633.45, down by 5.6% - which sounds better than a daily close 2873 high in January to a 2582 low in April, just more than 10% down. Given that Wall Street is the key visible barometer for how the economy is doing, the authorities could not allow this trend to continue. By September the monthly average for the SP500 was 2901.50 for a new all time.
Assuming that patterns over a base line of almost 150 years hold true, the reversal lower after August 2018 should have been the start of a long term bear market. As it happened, for non market related factors, there was a new high in September to break a number of multi-decade patterns. The decline that is now in progress since September can, barring very strange circumstances, be the start of the Big Bear taking hold of Wall Street that so many commentators have been warning about for quite some time.
The dollar index, following the bearish break below a pennant formation, held close to the pattern as if trying to break back in, but not succeeding. The bear trend then resumed and suddenly reversed, hinting that the dollar had received a booster injection of some kind. The new rally lasted until late last week when weakness set in again. For this new move lower be the continuation of the bear trend that had started above 103 late in 2016, it has to extend the dollar weakness below channel YZ at 94.75 and also into bear channel CD below 93.53.
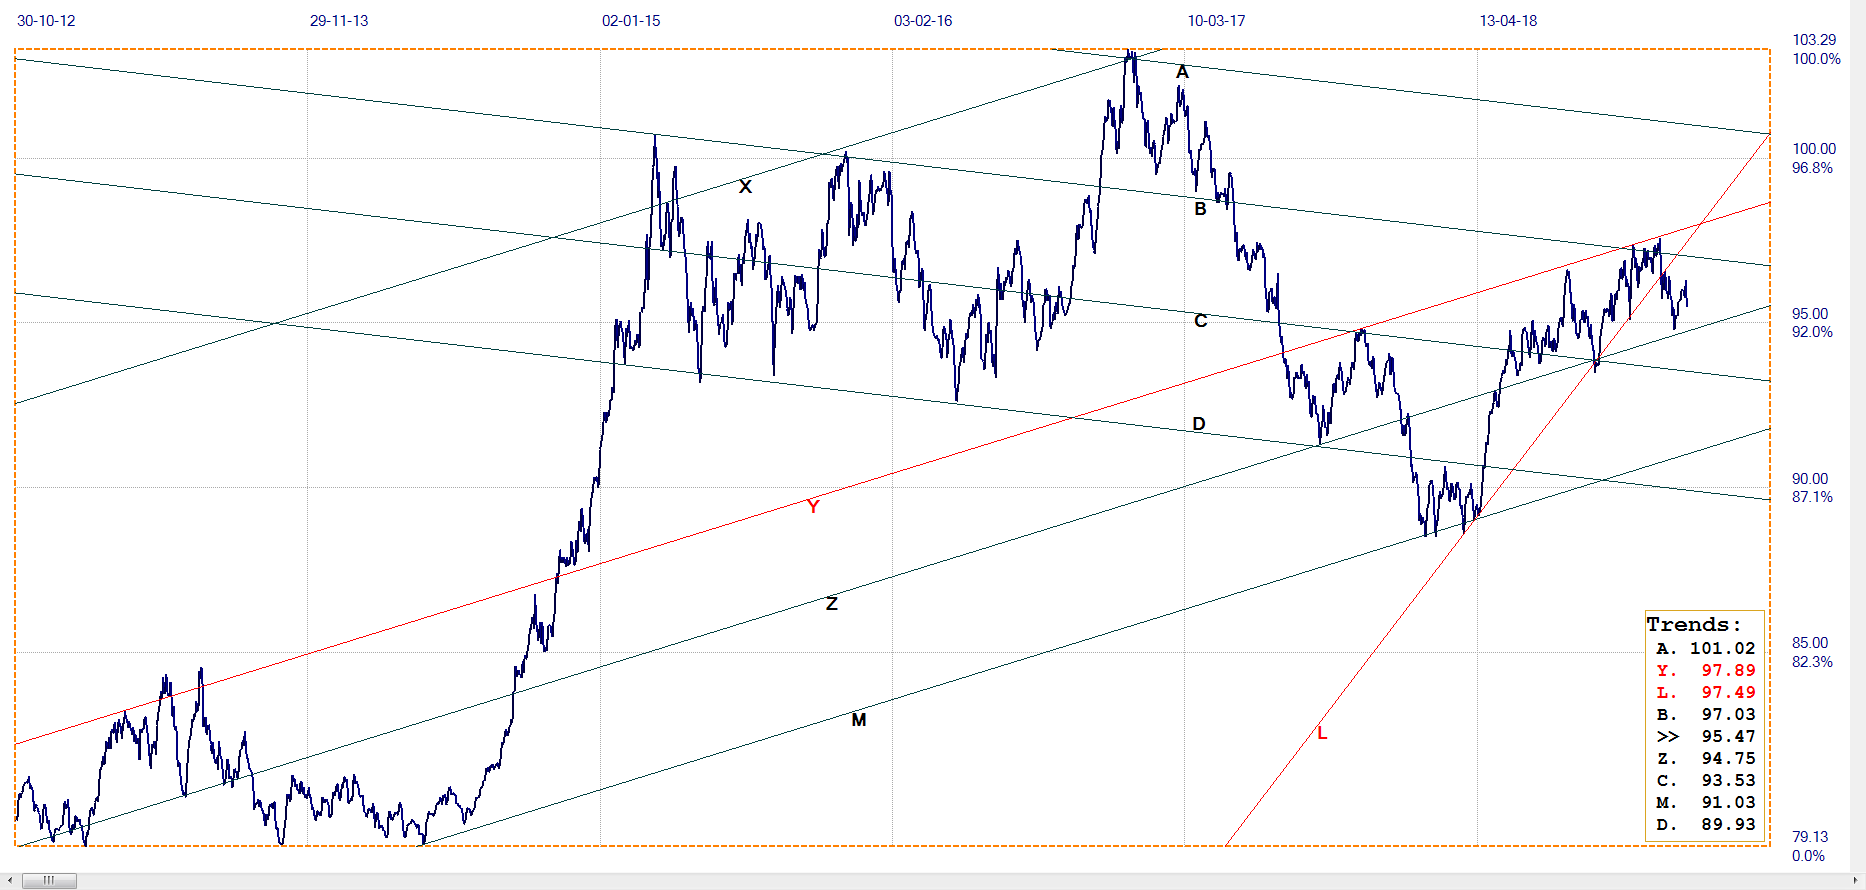
Dollar index daily. Last = 95.47
In other markets, the yield on the US 10-year Treasury note is consolidating around 2.72% while the rising trend in the price of crude has stalled above the $50 level.
The shutdown of the Feral Government has been lifted for about two weeks. There is nevertheless going to be some ripple effect through parts of the economy and more so if consultations during the two weeks do not bring results, with shutdown again being imposed after 15th February. The effects of the recent shutdown will take a time to become evident. The markets then have react to either a return to normalcy or to bad news should the shutdown resume after February 15th.
Euro–Dollar
The sudden reversal higher in the dollar placed the euro under new pressure and kept it from moving higher to break above bear channel VW ($1.1528). The euro pulled back to remain in the tight sideways trend, even spiking lower to again test the support along line L ($1.1304).
The fresh dollar weakness on Friday also boosted the euro so that there was a little rebound off line L. This week should show whether the rebound means that the euro could resume a move higher to break from the steep bear channel, or whether we will see an even weaker euro soon. They are having sufficient troubles of many kinds in Europe to compete with those in the US, so could go either way.
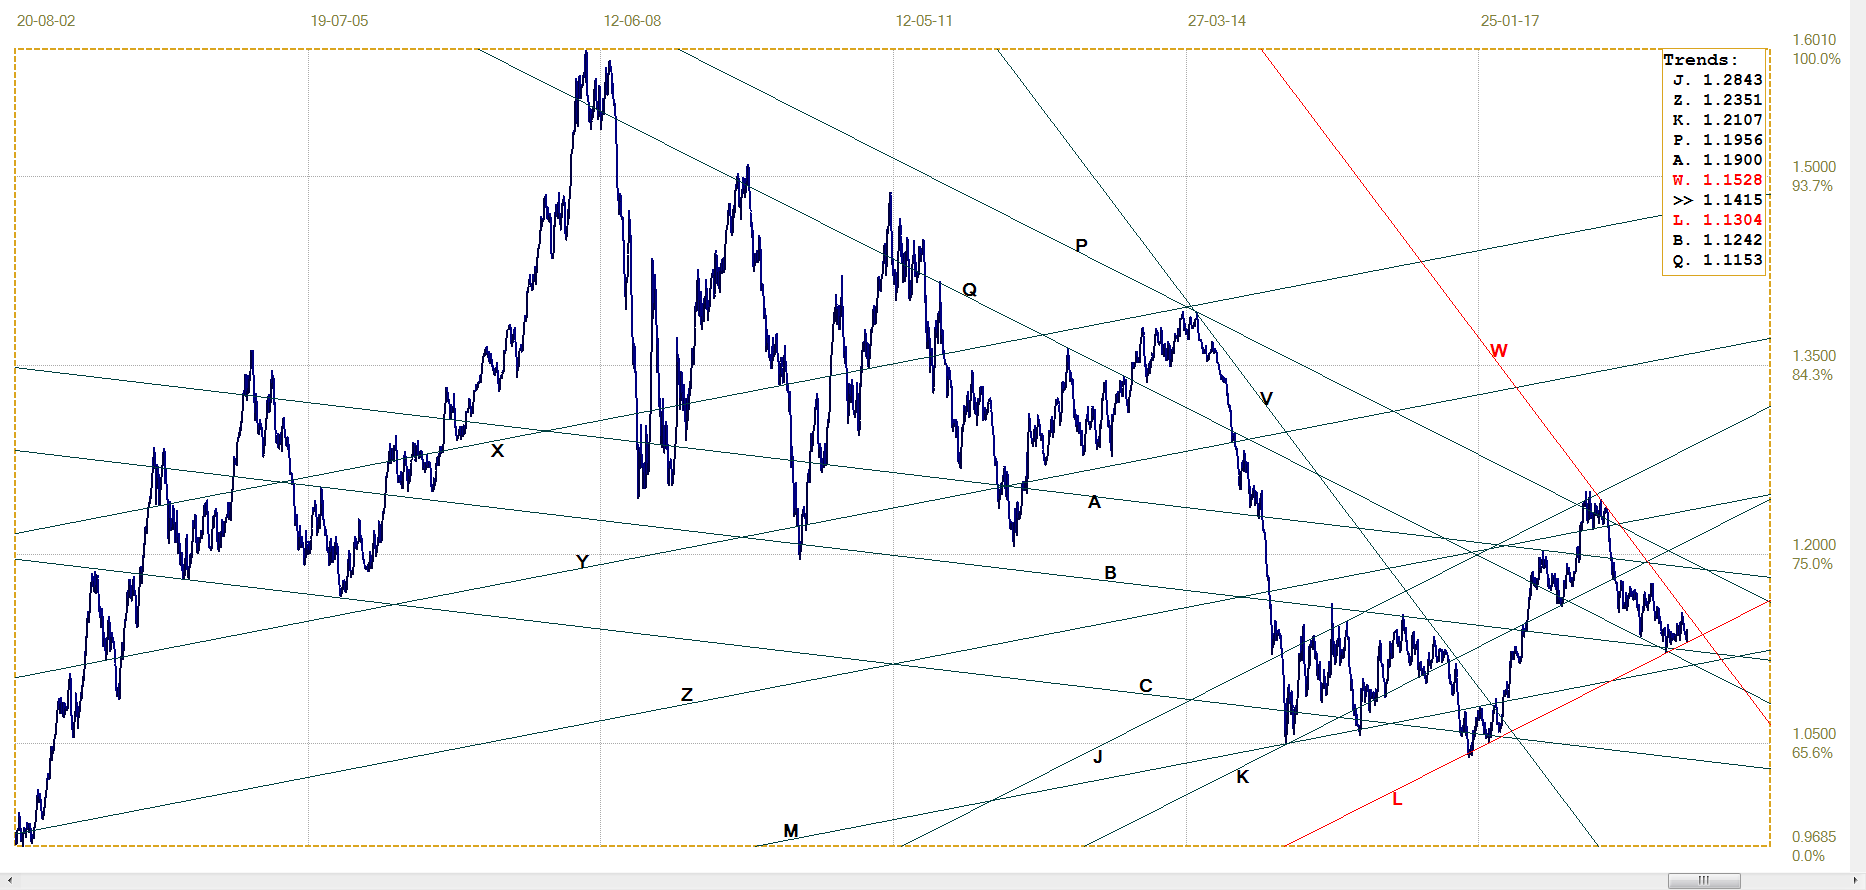
Euro–dollar, last = $1. 1415 (www.investing.com)
DJIA
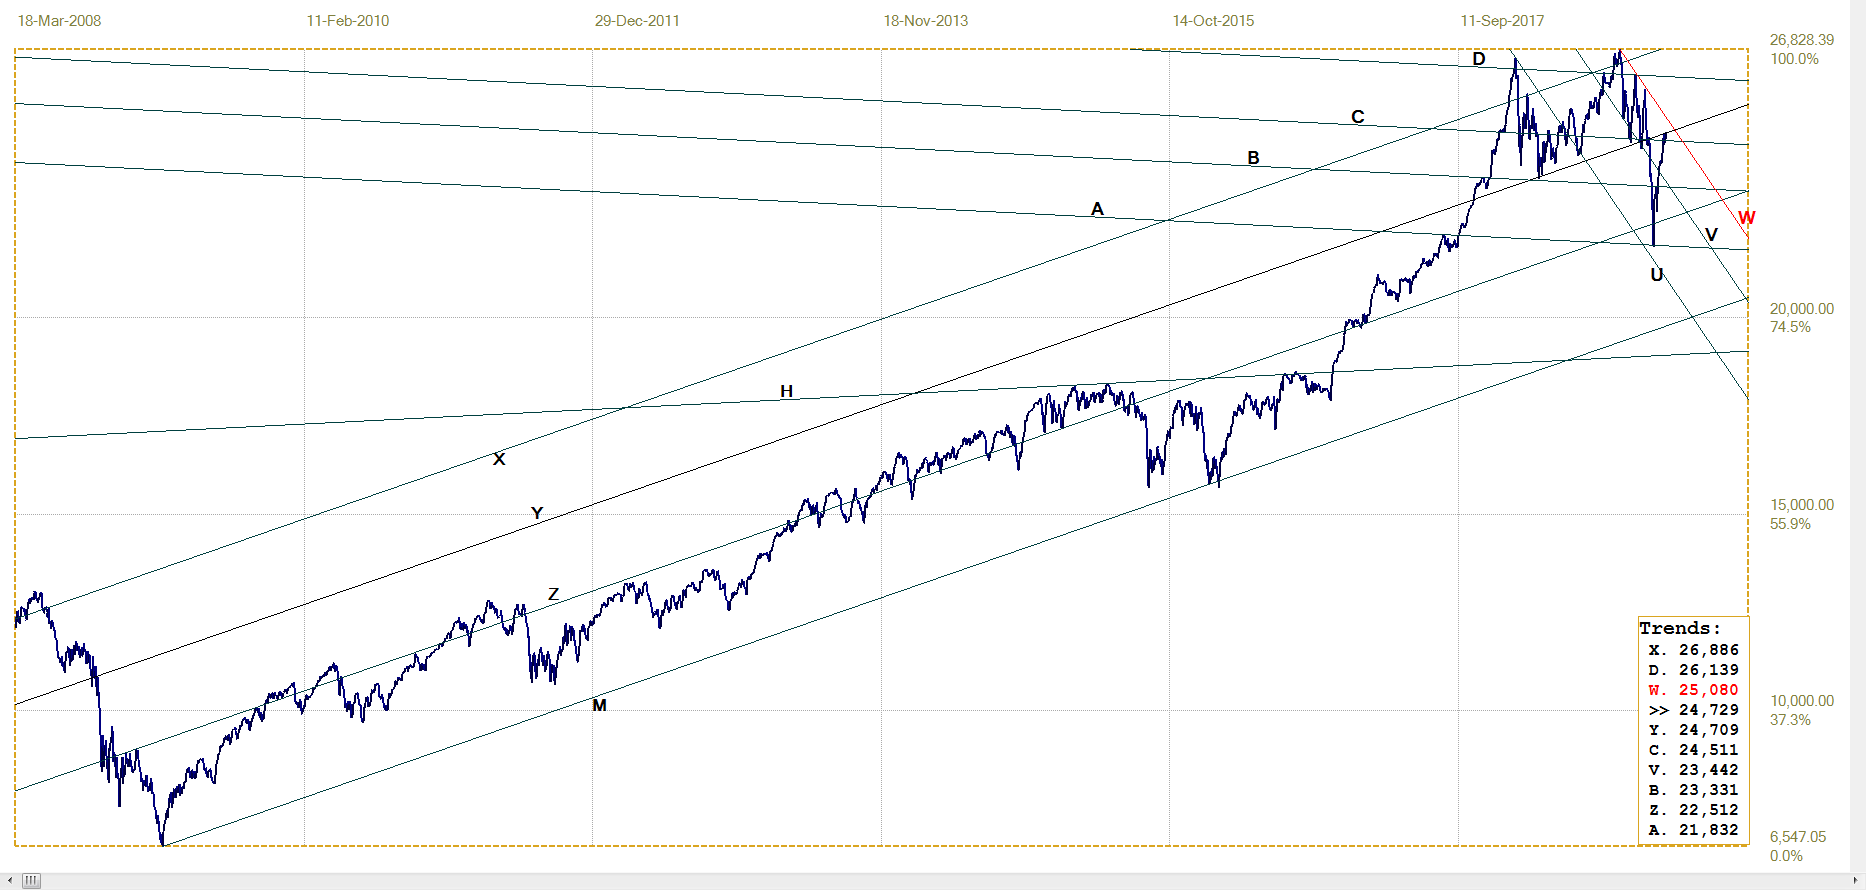
DJIA, last = 24729.16 (money.cnn.com)
On the positive side, the longer term broad bull channel XM is still intact, but on the bearish side, there is a near widely spaced double top that more often than not at best becomes a triple top. This is of course possible, but would require a break above channel UVW (25 080) that seems set to become a new bear channel.
Much of the double top formation developed in the sub-channel XY (24 709) of bull channel XM and the DJIA on Friday ended practically right on line Y following the break above line C (24 512). So far, the Federal shutdown does not seem to have had much effect on Wall Street, except perhaps to stall the rally above line C. What happens between now and mid February should determine the next direction, either to break above line Y and channel UW, or to reverse lower, back below line C, then to hold in the bear channel.
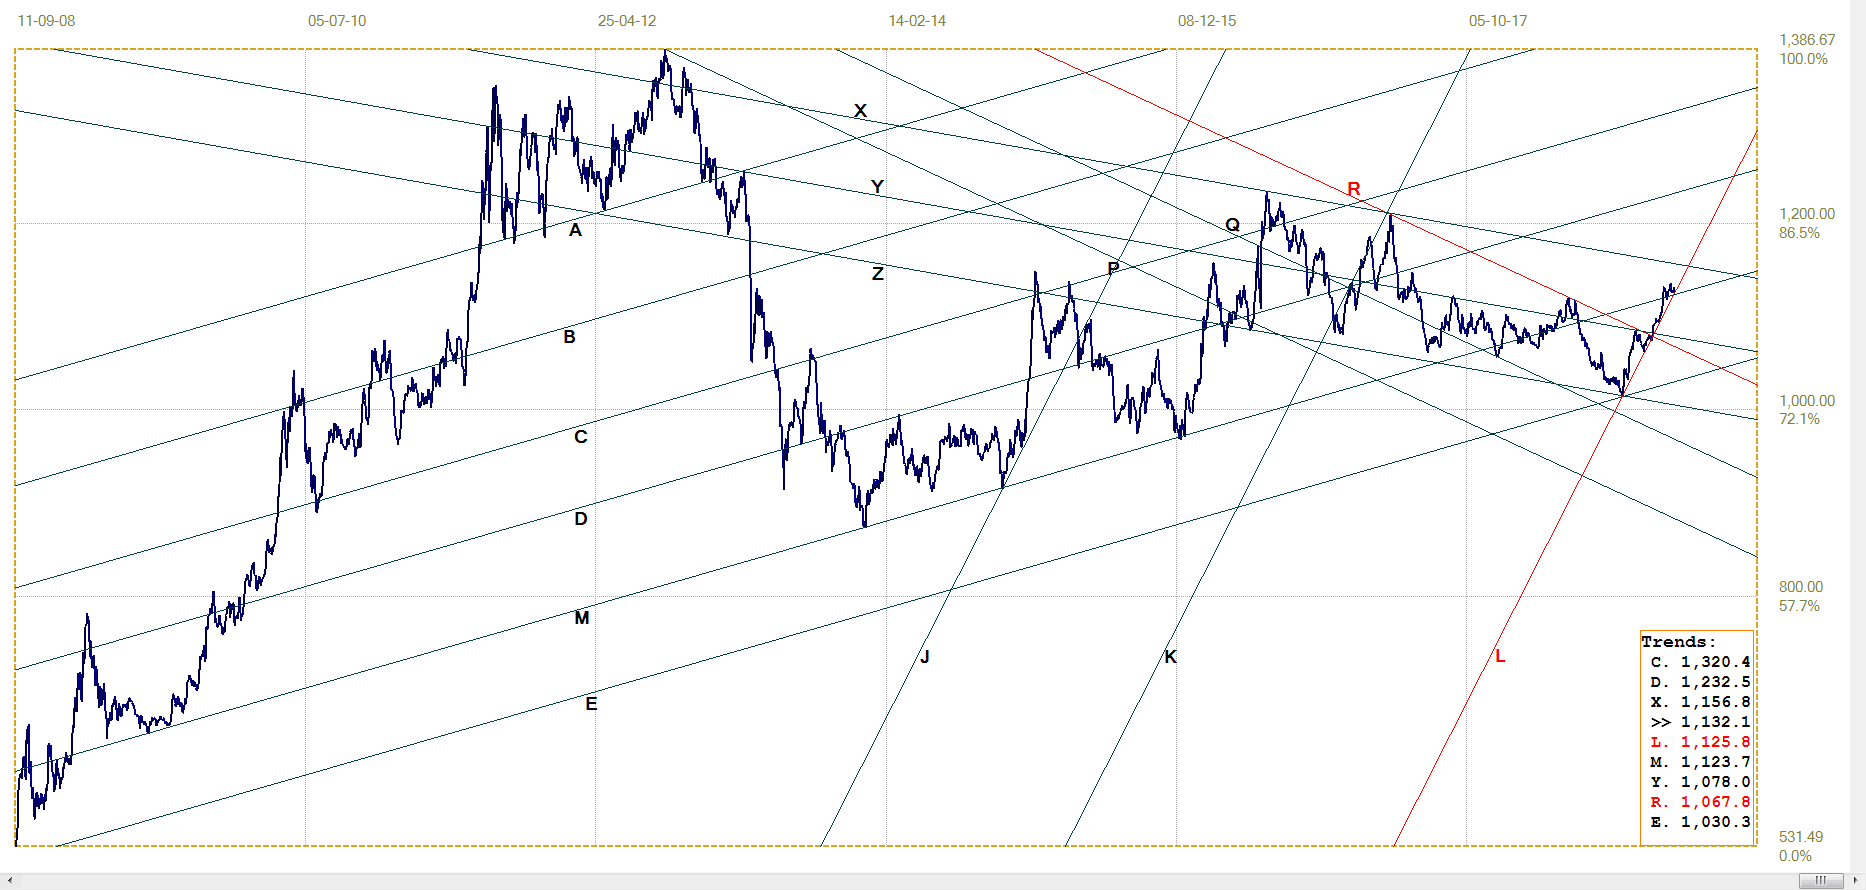
Gold PM fix – Dollars
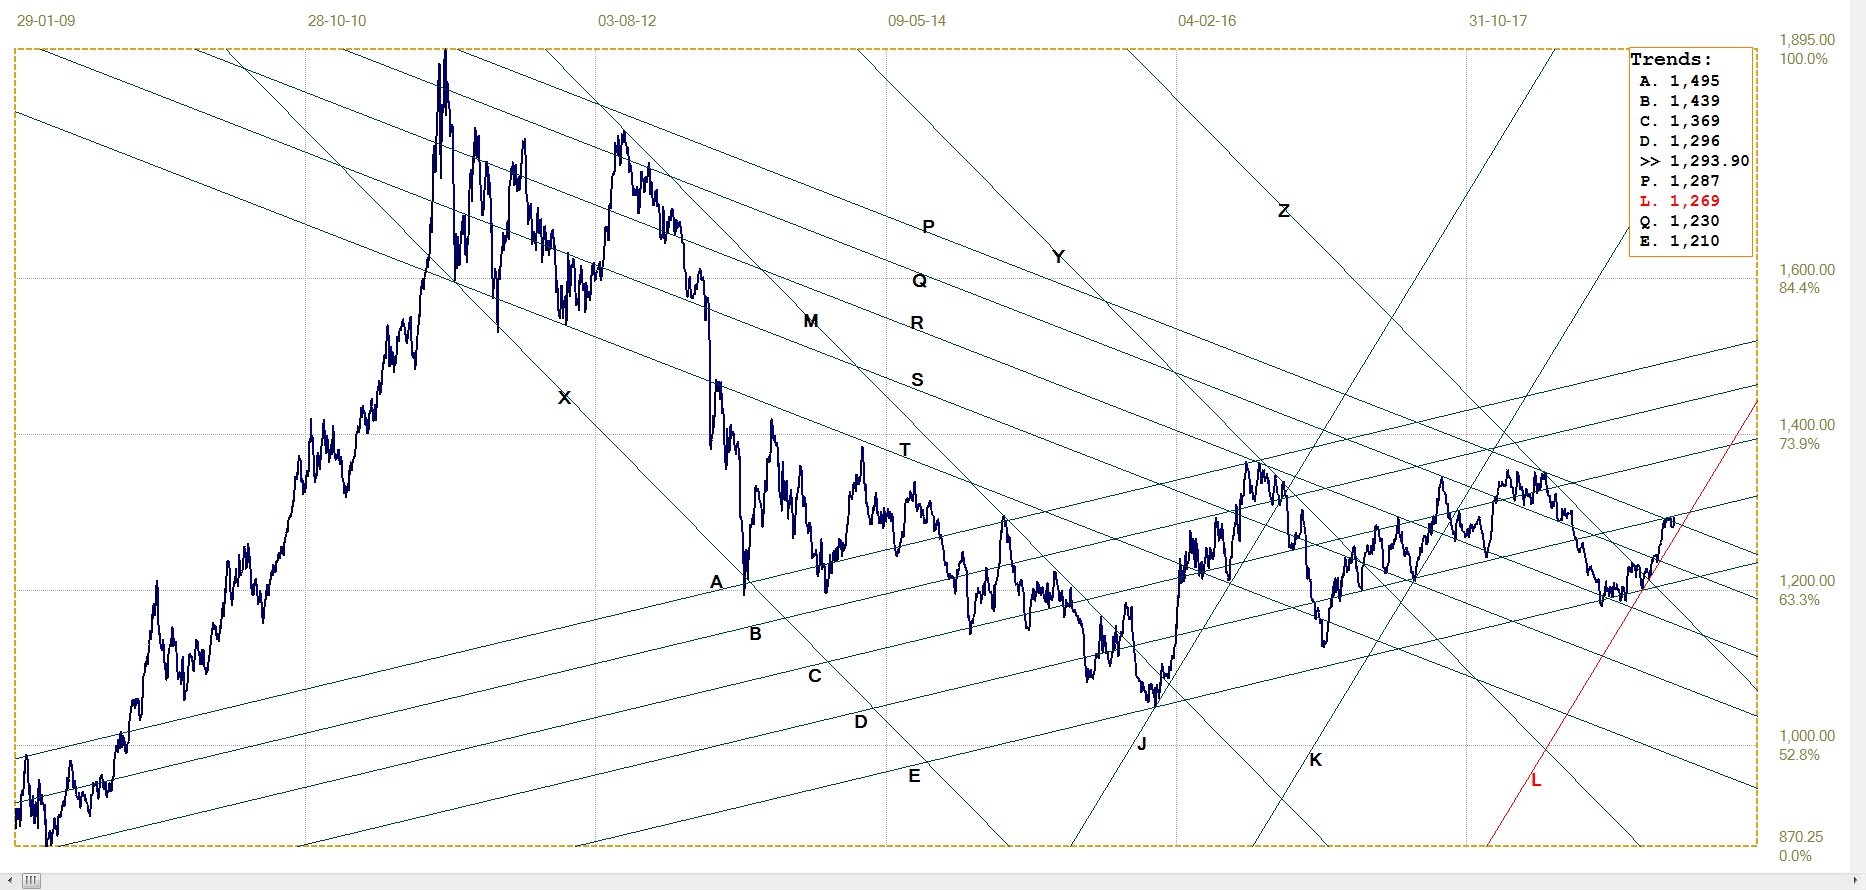
Gold price – London PM fix, last = $1293.90 (www.kitco.com )
Little real to say except that gold did not retreat very far after the hammering that it had ten days ago until the late rally on Friday to again challenge the major hurdle at $1300. It is also holding just along the top of the longer term bear channel QP ($1287), which is moving lower, no longer adding technical resistance to the $1300 level. Line D ($1296) is still a technical barrier, increasing to join the $1300 level as significant resistance. For the near term, and while $1300 is being tested, line L ($1269) is safe support, but it is steep and will soon come into play if there is no definite break higher.
As mentioned earlier, Friday delivered a golden surprise with a steep jump to carry the price of gold back to just below $1300. The open interest also jumped to show the new rally had met with selling resistance. This behaviour right before the OPEX on Monday and FND on Wednesday is a major break with past experience. It now remains to be seen if the naughty bulls will get a slap on the wrist, or whether the bounce will follow through to at least whisper ‘Gold! Gold!’
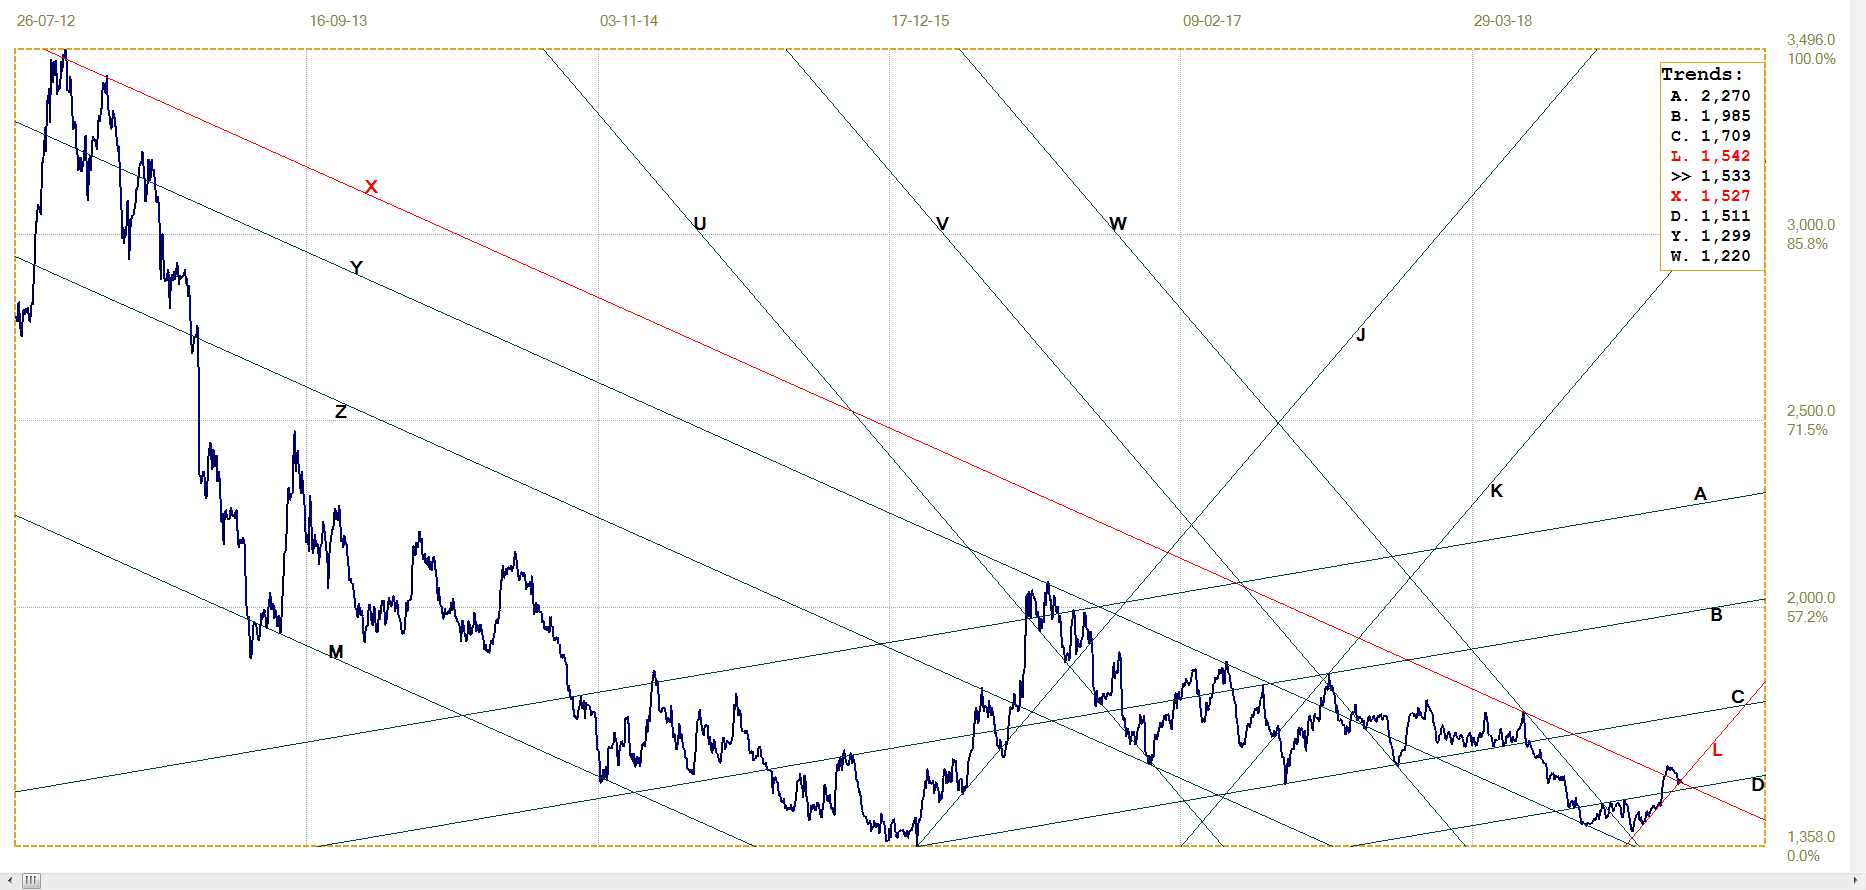
Euro–gold PM fix
Euro gold price – PM fix in Euro, last = €1132.08 (www.kitco.com)
As was the case last week, the combination of a quite steady and range bound price of gold holding a little below the $1300 level and a weaker euro worked to keep the euro price of gold in a tight range along and just above line M (€1124) and just in steep bull channel KL (€1126), with the latter ready to be tested.
The dollar will do as it wishes and should be bearish after the break from its recent pennant. It is more important for gold to extend the late rally of last week and this time break above the $1300 resistance.
Silver Daily London Fix
As so often happens, silver disappointed more than gold. It pulled lower quite close to $15 after seeming ready to challenge $16 not too long ago. The Friday London fix was too early to be affected by the rally in gold and silver during the trading day; a pleasant surprise it was for a rally to happen into and during US trading hours.
Silver dipped back into the support of line X ($15.27), the top of the medium to longer term bear channel from which it had recently broken, and line L ($15.42), the bottom of the new bull channel. The London fix at $15.33 was marginal above the support of line X and a little below the bull channel, but by the close the price was $15.64, which has a good safety margin; and more so if the rally continues this week, perhaps to challenge the $16 barrier.
Silver daily London fix, last = $15.33 (www.kitco.com)
U.S. 10–year Treasury Note
Following the steep spike lower to reach the bottom of bear channel AE (2.56%) for a rebound as steep as the spike lower, the yield consolidated in narrow bull channel VW (2.764%), holding just above line D (2.712%) and failing to challenge line S (2.756%) with any lasting success.
A break from channel VW has to happen soon, unless there happens to be another steep bullish spike early this week. Given the uncertainties in the economy at the moment, compounded by the possible resumption of the shutdown and by political infighting not seen for a long time, the direction of the next move is not easy to anticipate.
Technically, the odds seem to favour a break higher from the current consolidation to resume the bear trend, to be confirmed by a definite break from channel VW and to above lines S and J (2.79%).
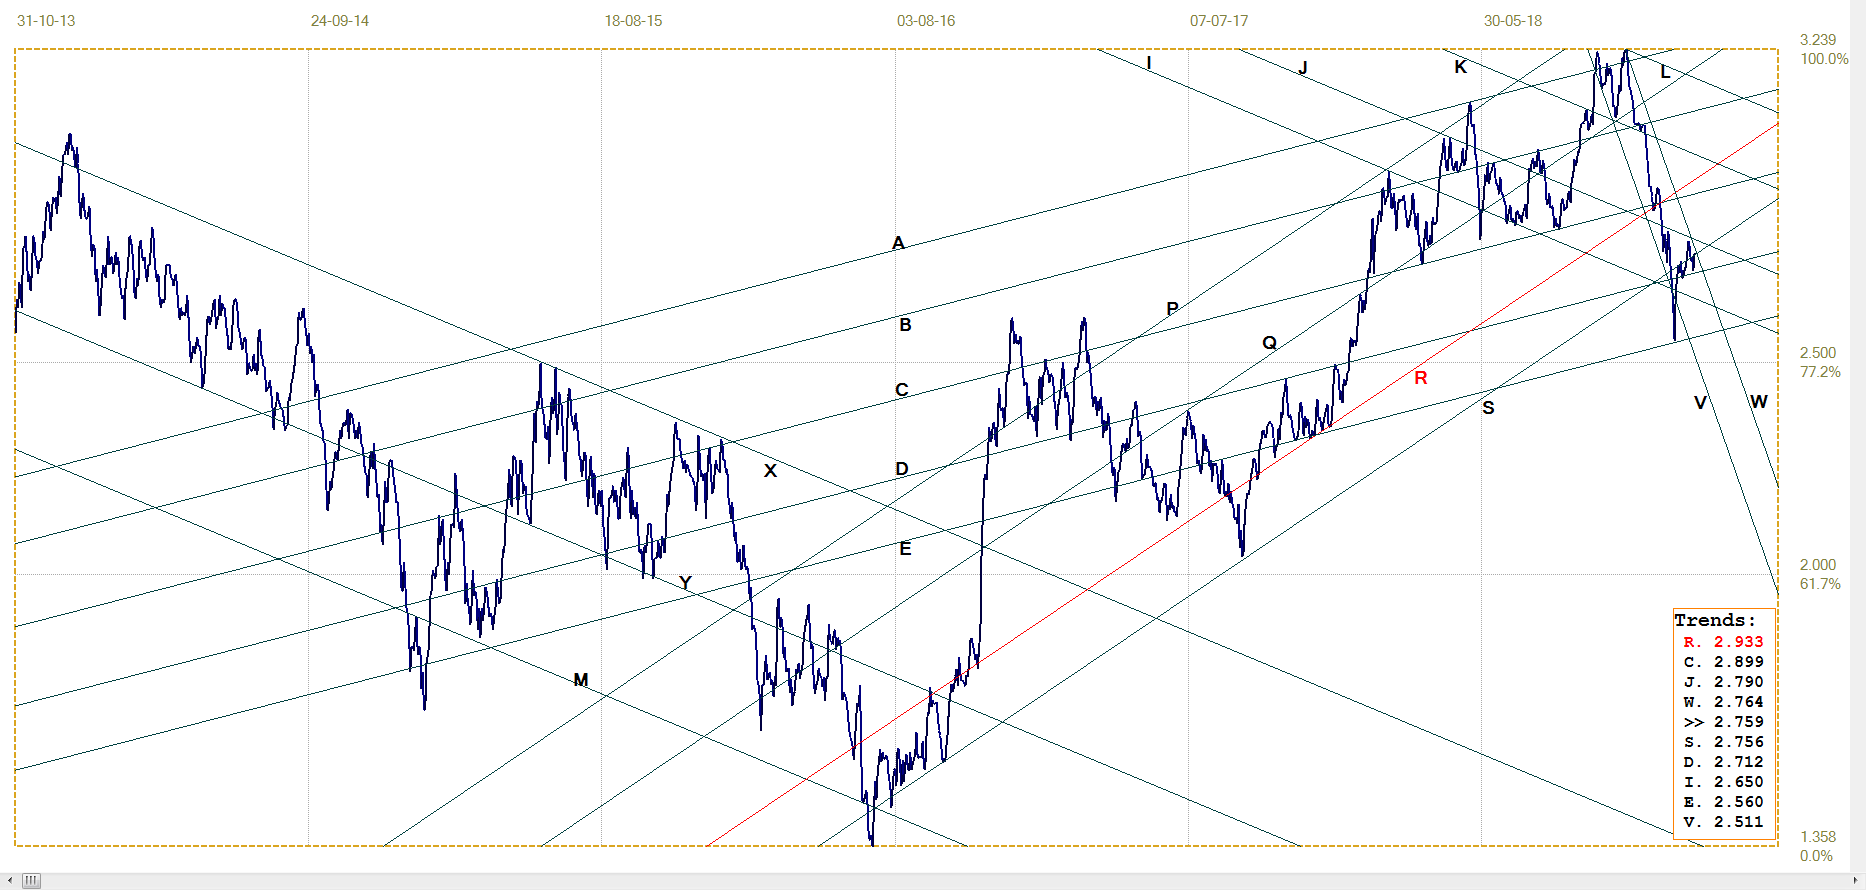
U.S. 10–year Treasury note, last = 2.759% (www.investing.com )
West Texas Intermediate crude. Daily close
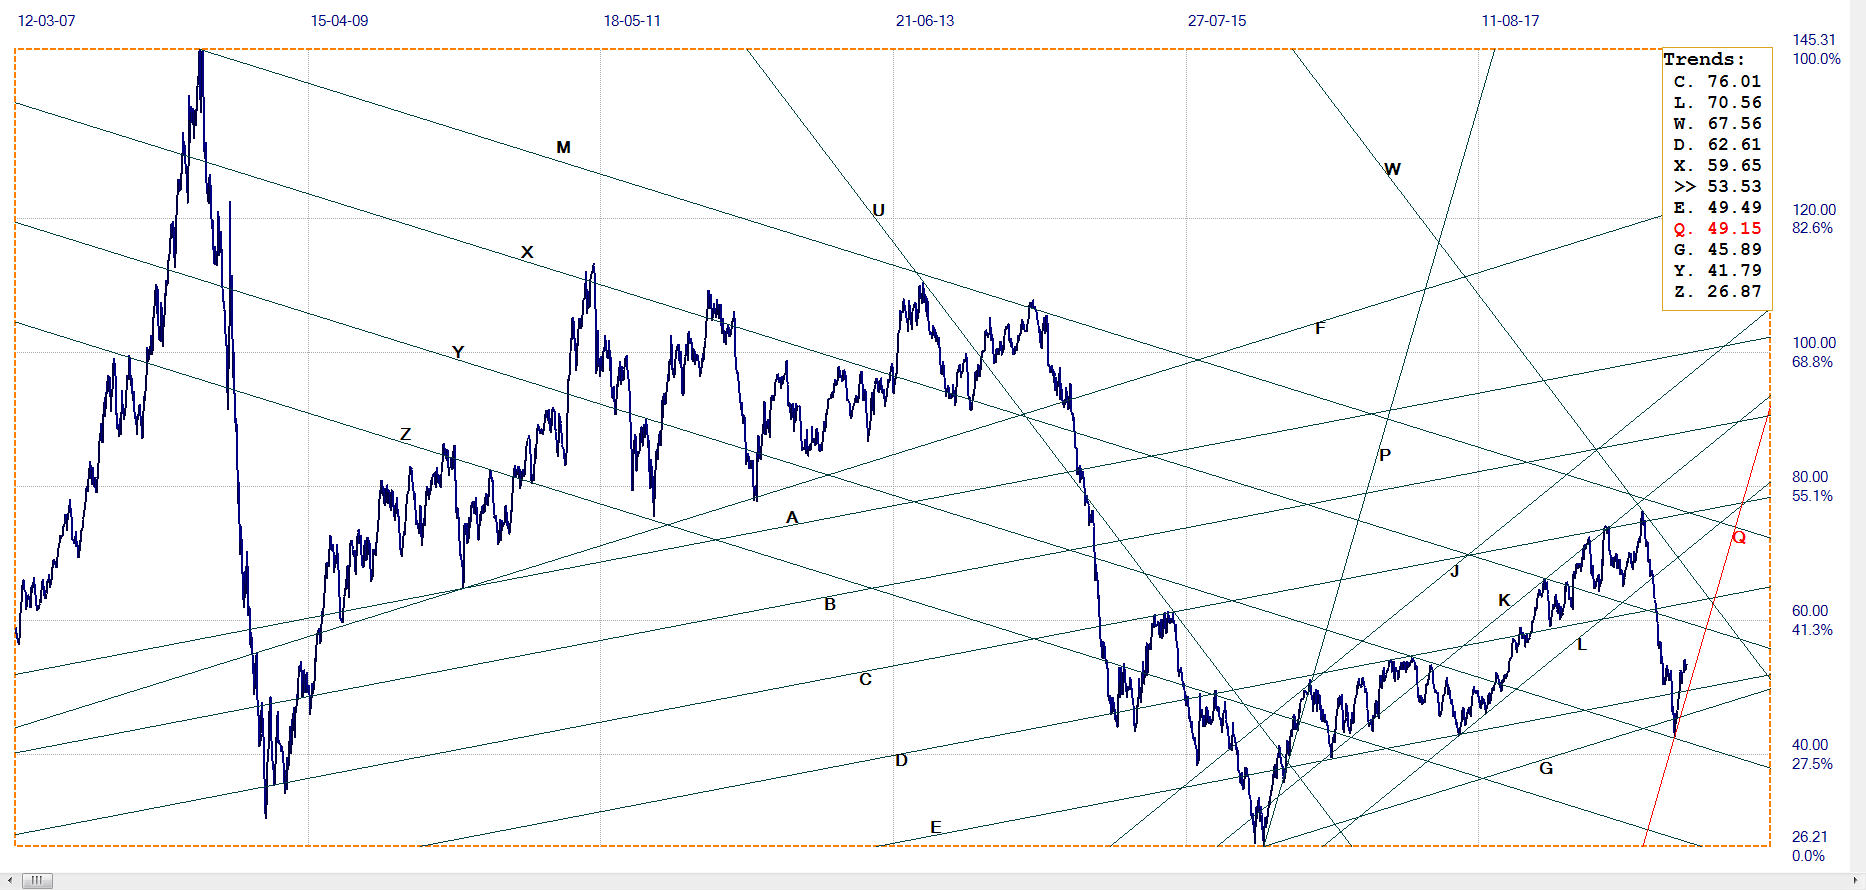
WTI crude – Daily close, last = $53.53 (www.investing.com )
The steep sell-off in crude reversed as steeply as the spike lower and is keeping quite close to the steep support of line Q ($49.15), the bottom of bull channel PQ. The rising trend can continue on strength in the economy, or on reduced demand as producers attempt to support the market and obtain better prices, or of some combination of the two. For the time being and while channel PQ holds, the outlook is bullish.
©2019 daan joubert, Rights Reserved chartsym (at) gmail(dot)com
********


