Gold Price Looking Lower Near-Term


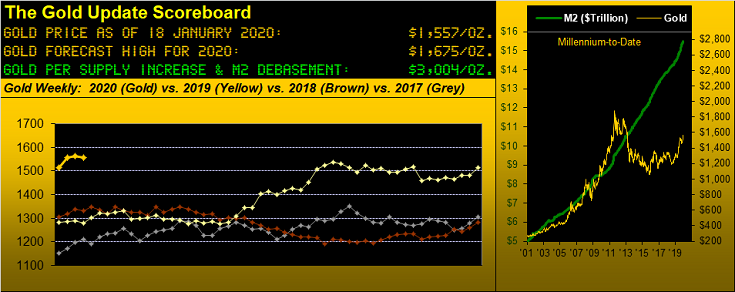
To date in 2020, Gold has been up as much as 6.1% (to 1613) from last year's close (of 1520), the brief spike coming on "nuthin' but GEOPEEE, baby!", such universally-now-known "sell the news" axiom in turn finding Gold now up only 2.5% year-to-date in settling out the week yesterday (Friday) at 1557.
Meanwhile, the stock market as measured by the S&P 500 -- the iconic index obviously oblivious to both geopolitical unrest and lack of earnings growth -- is sprinting merrily along to record-setting upside levels on substantive monetary inflow to now be higher by 3.1% year-to-date. More on that later.
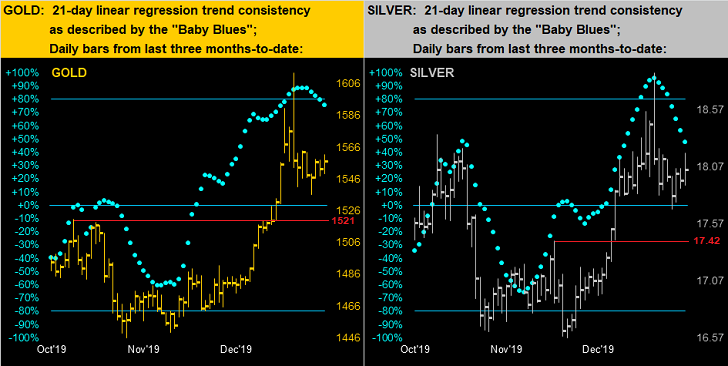
Specific to this week's title of "Gold Looking Lower Near-Term", let's start with a chart normally found deeper down in these missives, that of Gold's "Baby Blues" across the daily trading bars on the left from three months ago-to-date along with same for Silver on the right. Briefly (for our newer readers), the baby blue dots depict the day-to-day stance of the consistency for each market's 21-day linear regression trend. And when -- as is the current case for both Gold and Silver -- those dots curl down below their respective +80% horizontal axis lines, the trader's rule from having observed (indeed comprehensively tested) this phenomenon since time immemorial is to expect still lower prices near-term, i.e. within the ensuing days or weeks. The extent of the downturn is for price to arrive at a recent area of structural support or pricing congestion. For both markets we've thus drawn in a red line "target" price of 1521 for Gold and 17.42 for Silver. 'Course from the "Disclaimer of All Disclaimers Dept." such ensuing direction and duration of price travel doesn't always develop: but if it typically didn't happen in the majority of prior cases, hardly would we bring it to one's attention. Moreover, as we always remain mindful, prudent cash management is paramount to being wrong or even right. Here are the dipping dots:
"But does this change your call for gold to get to 1675 this year, mmb?"
Heavens no, Squire. At this still young point of 2020, having seen 1613 so swiftly trade already (albeit under geopolitical duress) underscores such call -- as we've previously mentioned -- perhaps being conservative for this year. But more immediately with Gold's "Baby Blues" crossing below the +80% axis, such event also effectively occurred twice last year, the resulting downside within 21 trading days (one month) being as much as -37 points (03 July to 09 July) and -55 points (26 August to 18 September) respectively. For Silver such event last year effectively occurred as follows: -0.390 points (28 June to 05 July) and -2.410 points (04 September to 01 October). Again, did we mention prudent cash management? Indeed we did!
Now let's go to Gold's weekly bars from a year ago-to-date. And a fairly marvelous view 'tis! Even should Gold test the aforementioned 1521 level within the construct of the present regression trend's consistency breaking down, this chart's broader parabolic Long trend is fresh with plenty of downside wiggle room for it to be maintained (1470 being the protective price in the new week). 'Course, the ongoing alarm in this graphic is the Gold/Silver ratio remaining in near record high territory at 86.3x. The millennium-to-date average is 65.1x which when geared to Gold being 1557 today puts Silver at 23.92 versus her actual price of 18.04. Got Silver? Oh baby...

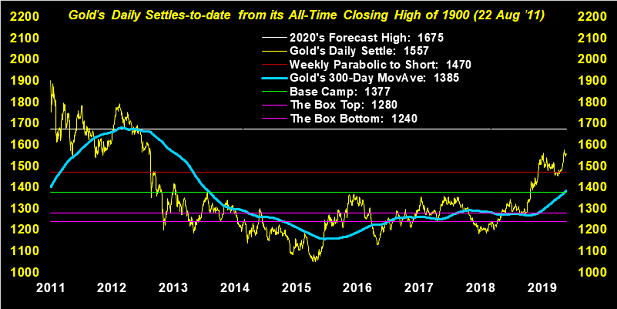
More broadly still, here we've Gold's closing price by the day since the highest ever at 1900 on 22 August 2011. Added to this graphic is the white line drawn for this year's targeted 1675 high. Clearly these last two years have been nothing short of stellar for Gold and nothing short of disastrous for the Shorts. "And how's dat once 20,030 now 8,955 bits**t workin' out fer ya?" Morons perhaps, but ya gotta have 'em to take the other side of the trade:
Next let's segue to the S&P 500 and the Economic Barometer, both of which are booming. At the outset we referred to the S&P's up move as being "substantive". One need only look at moneyflow for such confirmation, per the following graphic. The upper panel charts from one month ago-to-date the cumulative points change of the S&P (red line) and that of its moneyflow (blue line as regressed into S&P points). The lower panel is the difference between the two lines, the suggestion therein being that the S&P (at present 3330) ought indeed be 85 points (+2.6%) higher at 3415 (!) Can "Dow 30,000" be far behind?
'Course, 'tis January and 'twould thus seem that money managers are buying with apparent reckless abandon but without any regard to the stubborn lack of earnings growth. Our "live" price/earnings ratio for the S&P 500 is now at 41.1x (!!!) Insanity! "But the person on the TV said the forward P/E is only 18.7x..." Oh: so earnings therefore are going to more than double this year? Good luck with that: early on in 2019's Q4 Earnings Season, 29 of the S&P 500 constituents have filed their reports: the average year-over-over improvement thus far? +3.5%. That's it. The "Look Ma No Earnings" demise is waitin' in the wings, folks. And as we wrote in our 2020 Outlook, being Short the S&P into the StateSide November election regardless of its winners makes a heckova lotta sense. But that's then and the above moneyflow is now.
A-sizzlin' along with the S&P is the StateSide Econ Baro, this past week's data bringing positive inputs from Housing Starts, Retail (ex-auto) Sales, wholesale inflation and both the New York State Empire and Philadelphia Fed Indexes, the only glaring negative being shrinkage in December's Industrial Production. Yet on balance, the Baro is briskly boppin' upward. But enough so as to more than double earnings? No, as we'll in due course know. Still, being back here in San Francisco, we've the following "local" economic indicators: in order to get a metered parking space amongst hundreds on a nearby street, one has to queue up and wait (as we did for some 15 minutes) for another car to leave; and at the grocer's there is elaborate, expensive, electronic signage announcing "Hiring for positions in all departments". What is it the Fed recently said? That nationwide some 7.3 million available jobs remain unfilled? Here's the Baro:
In the midst of it all this past Wednesday came the Federal Reserve Bank's "Beige Book", its regional analyses supportive of "modest" economic growth notwithstanding trade tensions. Wednesday also brought with it the pomp of the ceremonial "Phase 1" trade signing between China and the US, effectively more of a "we'll see" than a substantive deal as sino-gross domestic product growth succumbed to a 29-year low.
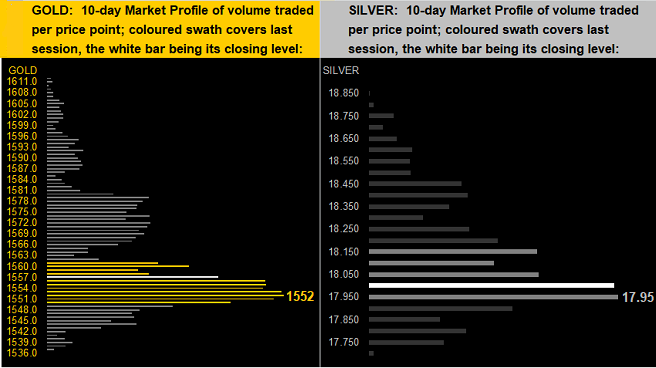
Speaking of low, let's next go to the 10-day Market Profiles for both Gold (below left) and Silver (below right). And in both cases price has been pulling back such as to test the denoted trading support levels of respectively 1552 and 17.95. Again as to the near-term, the aforeshown declining "Baby Blues" are setting the stage for still lower levels... before ultimately turning the corner with Gold 1675 in the year's balance:
Let's then wrap it with the Stack:
The Gold Stack
Gold's Value per Dollar Debasement, (from our opening "Scoreboard"): 3004
Gold’s All-Time High: 1923 (06 September 2011)
The Gateway to 2000: 1900+
Gold’s All-Time Closing High: 1900 (22 August 2011)
The Final Frontier: 1800-1900
The Northern Front: 1750-1800
2020's High: 1613 (08 January)
On Maneuvers: 1579-1750
10-Session “volume-weighted” average price magnet: 1563
Trading Resistance: 1560 / 1572-1579 / 1588-1595
Gold Currently: 1557, (expected daily trading range ["EDTR"]: 18 points)
Trading Support: 1552
10-Session directional range: down to 1536 (from 1613) = -77 points or -4.8%
2020's Low: 1520 (02 January)
The Weekly Parabolic Price to flip Short: 1470
The Floor: 1466-1579
Le Sous-sol: Sub-1466
The Support Shelf : 1454-1434
The 300-Day Moving Average: 1385 and rising
Base Camp: 1377
The 1360s Double-Top: 1369 in Apr '18 preceeded by 1362 in Sep '17
Neverland: The Whiny 1290s
The Box: 1280-1240
Next week is a holiday-shortened one StateSide with a light economic calendar, but an increase in the pace of incoming Q4 earnings ... and is replete with a ratings-challenge for those TV networks praying that folks waste their time watching gavel-to-gavel coverage of the pre-determined Senate trial on impeachment. Better to watch Gold working lower into bargain territory such that later 'twill be working higher!
www.deMeadville.com
www.TheGoldUpdate.com
********

Mark Mead Baillie has had an extensive business career beginning in banking and financial services for two years with Banque Nationale de Paris to corporate research for three years at Barclays Bank and then for six years as an analyst and corporate lender with Société Générale.
For the last 22 years he has expanded his financial expertise by creating his own financial services company, de Meadville International, which comprehensively follows his BEGOS complex of markets (Bond/Euro/Gold/Oil/S&P) and the trading of the futures therein. He is recognized within the financial community of demonstrating creative technical skills that surpass industry standards toward making highly informed market assessments and his work is featured in Merrill Lynch Wealth Management client presentations. He has adapted such skills into becoming the popular author each week of the prolific “The Gold Update” and is known in the financial website community as “mmb” and “deMeadville”.
Mr. Baillie holds a BS in Business from the University of Southern California and an MBA in Finance from Golden Gate University.


