Gold Reaps More Record Ground


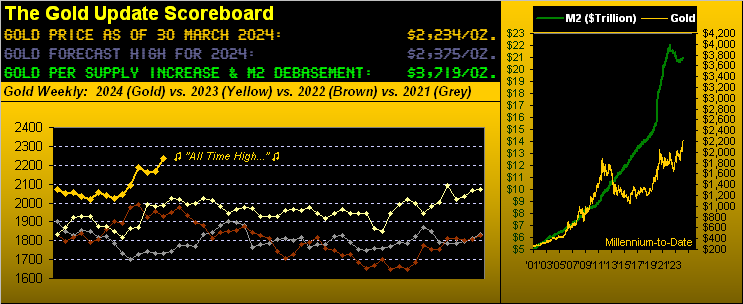
Welcome one and all to the 750th consecutive Saturday edition of The Gold Update. Having missed nary a Saturday since our first missive (20 November 2009) with Gold then 1151, price since has nearly doubled (+94%), toward settling this past shortened trading week on Thursday at the latest All-Time High of 2234. Thus we’ve a milestone price for Gold in synch with this milestone missive.
To be sure across the same stint, Gold supply’s tonnage has increased +23% for which we rightly account in the above Scoreboard valuation of 3719; but the U.S. liquid money supply (“M2”) has far more overwhelmingly increased +147% (that’s 2.5x for those of you scoring at home). ‘Tis reason right there to make sure you own Gold!
So as we turn to Gold’s weekly bars and parabolic trends from one year ago-to-date, let’s again cue Rita Coolidge from back in ’83 with  “All Time High”:
Gold’s +3.1% (+68 points) gain this past week ranks fourth-best on both a percentage and points basis in better than a year (since the week ending 17 March 2023). Moreover, the current 2234 level is -141 points shy of our forecast high for this year of 2375, (a further +6.3% gain from here), to which ’tis reasonable to say — with three quarters remaining in the young year — would seem well within range. Indeed were 2375 to be reached by year-end, ‘twould be a +14.6% gain (from 2023’s close of 2072). Possible? Absolutely! Across the past 49 trading years (from 1975 through 2023), Gold has recorded intra-year gains exceeding +14.6% in 26 of those years.
As to the three notable near-term Gold negatives we herein cited a week ago, price has only been positive. Still, recall then that price (per our Market Values page) was +71 points above our “smooth valuation line”: that deviation is now +116 points which historically is both excessive and generally leads to some natural ebb within Gold’s overall up-flow. Too, Gold’s daily (not weekly) parabolics a week back had flipped to Short, albeit they’ve now returned to Long. But Gold’s “Baby Blues” (per our Market Trends page and as we’ll later below see) were — and still are — in decline.
Now including key precious metal equities and the month of March being in the books, we next go year-over-year with the following percentage tracks wherein we find Agnico Eagle Mines (AEM) +14%, Gold itself +13%, the VanEck Vectors Gold Miners exchange-traded fund (GDX) -2%, the Global X Silver Miners exchange-traded fund (SIL) -9%, both Franco-Nevada (FNV) and Pan American Silver (PAAS) -18%, and cellar-dweller Newmont (NEM) -26%. But as lagging as the equities appear, there is a rather robust appearance in their most recent rises. Notably thereto across the past 32 trading days (since 13 February), whilst Gold is +11%, AEM is +33%.
“Which is the way it’s supposed to be, right mmb?“
Right, dear Squire: live by the equities’ leverage, albeit suffer by it at times within Gold’s overall rich pageant. Here are the tracks:
However: returning to Gold’s firm year-to-date performance (thoroughly so through March), and it being not only month-end but quarter-end as well, here are the BEGOS Markets’ percentage-change standings thus far in 2024. Gold is on the podium with a +7.8% gain, third only to the “Casino 500” (+10.2%) and ever-burgeoning Oil (+16.5%). Note, too, that the Dollar is +3.2%, contra to the conventional wisdom that it is negative-correlated to Gold, (which as you know plays no currency favourites). Still, ’tis proof once again that the Buck gets a bid when interest rates are up. Thus “francly” for the Swiss, ’tis become a complete miss following the Schweizerische Nationalbank’s rate cut as we disclosed a week ago:
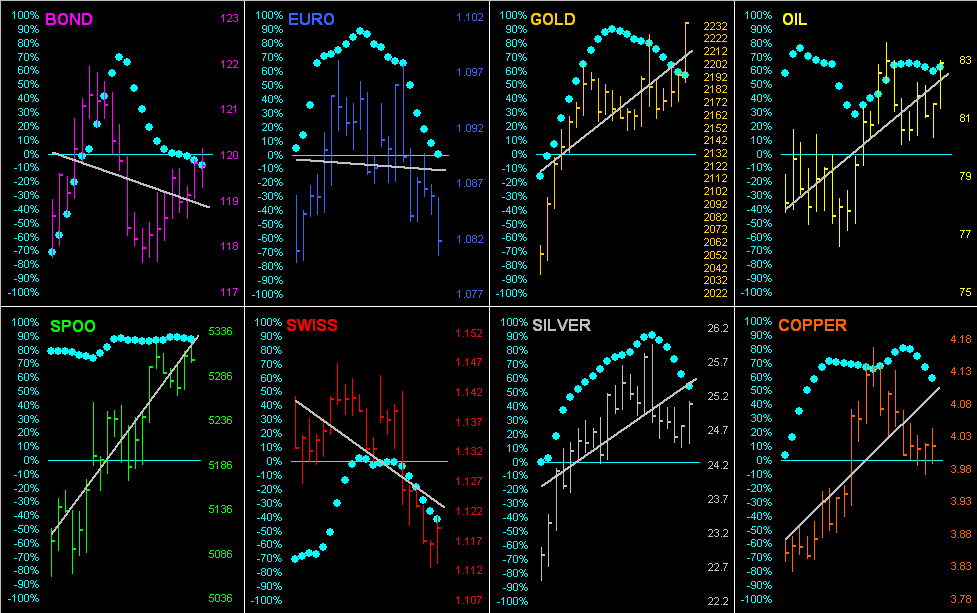
Nearer-term in comparing Gold’s trend to those of all the BEGOS Markets, let’s go ’round their horn for the past 21 trading days (one month). Therein we see the components’ “Baby Blues” depicting the day-to-day consistency of each grey linear regression trendline. And as aforementioned, Gold’s blue dots are dropping, as is the case for every market, except Oil. Oh to be sure, Gold’s trend clearly is up; however as those leftmost several days drop off the chart, the slope of the grey trendline shall become less steep. And as you long-time readers and website followers well know: “Follow the blues instead of the news, else lose your shoes”, (which for you WestPalmBeachers down there means some Gold selling near-term wouldn’t be untoward). Here’s the graphic, (the “Spoo” essentially being the “never go down” S&P 500):
As to the StateSide economy, ’twas another week of rather “split” results for the Economic Barometer: of the 12 incoming metrics, six improved period-over-period, which means six did not so do. We were a bit alarmed to see February’s Personal Spending leap +0.8% (from +0.2%) even as Personal Income slowed to +0.3% (from +1.0%). Paying more these days for the same stuff?
Moreover, yesterday (Friday) brought the “Fed-favoured” Personal Consumption Expenditures data, (which given the holiday shan’t face markets’ reactions until Monday). February’s headline PCE increased +0.3%, the most since September, whilst the Core reading also increased +0.3%, the second-most since September. Thus the trend of inflation across the past five reported months (Oct-Fed) is rising.
Thus in turn, ’tis no wonder that the FinMedia “call” for three FedFunds rate cuts this year is being subtly scaled back to one … or none … (or are rate hikes not done?) Too, the Baro recorded further “contraction” in March’s Chicago Purchasing Managers’ Index as well as a pullback in the Conference Board’s measure of Consumer Confidence. Are you confident? Or is the notion of stagflation becoming an agitation? Here’s our year-over-year Econ Baro view, the “Casino 500” yet to encounter its Waterloo:
Through it all as the economy potentially stagflates sans imminent relief for interest rates — with the three-month annualized yield of the U.S. Treasury Bill (5.2035%) nearly four times higher than that of the “Casino 500” (1.384%) — the Investing Age of Stoopid nonetheless rolls upward in comprehensive ignorance to an S&P 500 lacking both earnings support (the live price/earnings ratio now 46.9x) and monetary coverage (the market capitalization/money supply ratio now 2.2x). Scary continues!
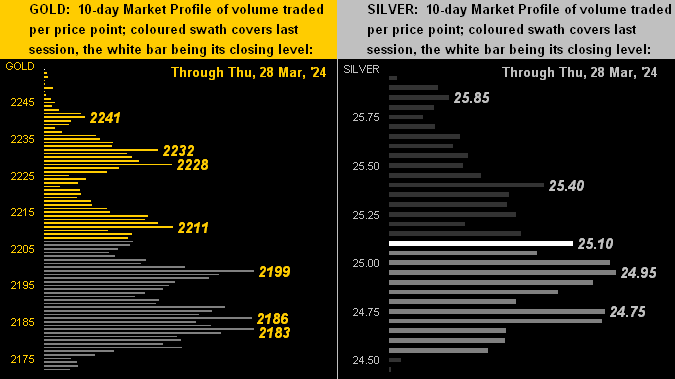
Comforting, however, are the yellow metal’s underlying layers of trading support as we turn to the 10-day Market Profiles for Gold on the left and for Silver on the right. Note: the labeled Gold supports are basis the June contract — inclusive of its +21 points of fresh premium (June Gold having settled at 2255) — as April is now put to rest:
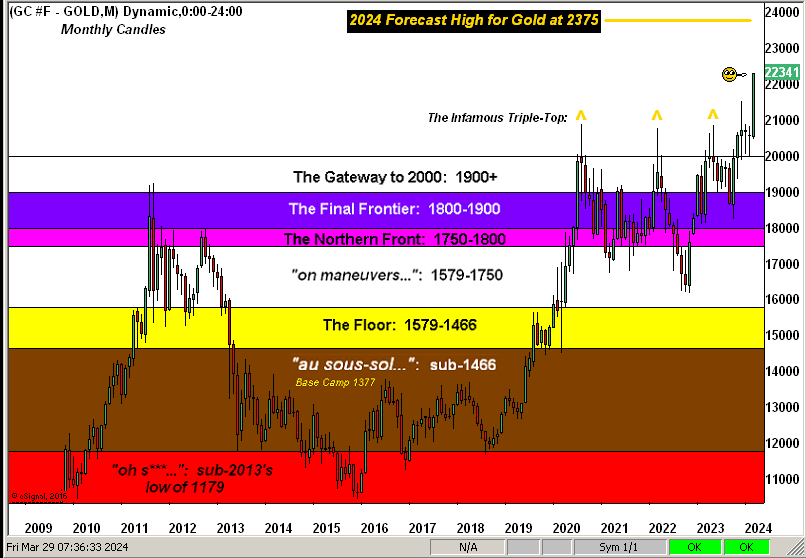
And proudly pointing to Gold’s new All-Time High is the happy guy in our 15-year view by the month of the layered price structure. This year’s Gold goal remains as shown at 2375:
To close — given that the yellow metal is at an All-Time High — nothing could be more appropriate to wrap than with The Gold Stack, with the June contract but one row below debasement valuation:
The Gold Stack
Gold’s Value per Dollar Debasement, (from our opening “Scoreboard”): 3719
JUNE Gold Currently: 2255, (expected daily trading range [“EDTR”]: 30 points)
Trading Support (basis June): 2241 / 2232 / 2228 / 2211 / 2199 / 2186 / 2183
Gold’s All-Time Intra-Day High: 2234 (28 March 2024)
2024’s High: 2234 (28 March)
10-Session directional range: up to 2234 (from 2149) = +85 points or +4.0%
Gold’s All-Time Closing High: 2234 (28 March 2024)
Trading Resistance: (none)
10-Session “volume-weighted” average price magnet (basis June): 2202
The 2000’s Triple-Top: 2089 (07 Aug ’20); 2079 (08 Mar’22); 2085 (04 May ’23)
The Weekly Parabolic Price to flip Short: 2023
2024’s Low: 1996 (14 February)
The 300-Day Moving Average: 1983 and rising
The Gateway to 2000: 1900+
The Final Frontier: 1800-1900
The Northern Front: 1800-1750
On Maneuvers: 1750-1579
The Floor: 1579-1466
Le Sous-sol: Sub-1466
The Support Shelf: 1454-1434
Base Camp: 1377
The 1360s Double-Top: 1369 in Apr ’18 preceded by 1362 in Sep ’17
Neverland: The Whiny 1290s
The Box: 1280-1240
So there we’ve missive No. 750 as magnificently aligned with a Gold All-Time High. Will it get any better? ‘Course ’twill! Just make sure you make your move with Gold!
Cheers!
…m…
www.TheGoldUpdate.com
www.deMeadville.com
and now on “X”: @deMeadvillePro
********

Mark Mead Baillie has had an extensive business career beginning in banking and financial services for two years with Banque Nationale de Paris to corporate research for three years at Barclays Bank and then for six years as an analyst and corporate lender with Société Générale.
For the last 22 years he has expanded his financial expertise by creating his own financial services company, de Meadville International, which comprehensively follows his BEGOS complex of markets (Bond/Euro/Gold/Oil/S&P) and the trading of the futures therein. He is recognized within the financial community of demonstrating creative technical skills that surpass industry standards toward making highly informed market assessments and his work is featured in Merrill Lynch Wealth Management client presentations. He has adapted such skills into becoming the popular author each week of the prolific “The Gold Update” and is known in the financial website community as “mmb” and “deMeadville”.
Mr. Baillie holds a BS in Business from the University of Southern California and an MBA in Finance from Golden Gate University.


