Gold Sellers Neatly Sponged; Trump Rally Nearly Expunged


The ebbing tide which lowers all boats as the great Black Swan paddles past -- displacing to the downside just about everything but the Dollar -- is doing the damage quite similarly to what we witnessed back in the 2008/2009 credit demise. Our BEGOS Markets (Bond / Euro / Gold / Oil / S&P 500) are trading at sufficiently lickety-split and oft illiquid speed such as to challenge the most hardened of seasoned traders. Indeed any of you peeking at the technical study "average true range" may risk passing out. These markets are traveling fiercely fast, and frightfully so.
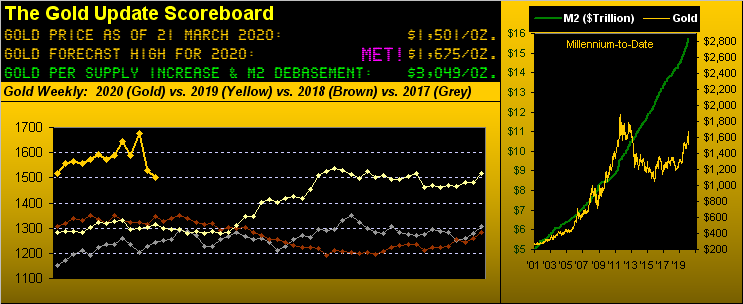
Our prior missive of reasons fivefold for "Why Gold Got Sold" was fairly status quo for this week just passed, Gold itself settling lower still yesterday (Friday) at 1501. And whilst 'tis far too early in the young year to go about patting oneself on the back, so far we've two Gold pricing areas that have essentially held by our not necessarily wise surmise:
■ The first of course -- for which we hope we're proven wrong as the balance of 2020 unfolds (or collapses) -- is the above Gold Scoreboard's forecast high of 1675 which initially traded on 24 February. The 29-point overshoot from there to as high as 1704 on 09 March was brief -- and considering Gold's range high-to-low this year is already 253 points -- stands as a reasonably decent call to this point. Again, we'd love to be wrong;
■ The second as described just a week ago -- Gold then at 1529 -- is the 1490-1466 "support swath", which despite its own 15-point overshoot down to 1451 this past Monday, neatly sponged up Gold's sellers such that price then zoomed back up to the present 1501. But again, the year is young.
Nonetheless, we're back in the thick of Black Suwannee's wake when, to again quote the infamous Al Gore, "Everything that should be Up is Down!" The following two-panel chart is a chilling reminder of a selected two-week period from 2008's demise on the left (that time slice actually seeing the Bond get a modest bid before turning negative into that October's end) compared with the present last two weeks on the right. From panel-to-panel, eerily similar stuff, to be sure:

As for Gold itself in turning to the weekly bars, fairly commensurate with the highlighted 1675 forecast we see the parabolic Trend having since flipped to Short, its second red dot leading the early downside procession. Perhaps a rather funeral-esque way of putting it, but at least the "support swath" as cited has thus far held, price settling the week -1.8%, yet well off the 1451 low. Still, as the great Bonnie Raitt might croon "But it's too soon to tell..."--('89):
Moreover we again see that when Suwannee swims by, cash become king, Gold in turn dented by the Dollar's ding. 'Tis been argued in the past that one cannot take a bar of Gold to the Safeway and buy a stick of butter, (or in this case toilet paper, if one can even find it). Our retort to which remains your being handed change in Silver. But today with the Gold/Silver ratio at an astonishingly high 118.9x, you're gonna need an armoured truck to carry all that change.
Speaking of change, 'tis happening both suddenly and rapidly to the Economic Barometer as the covert COVID consequences begin to spread through the incoming data. And we're just getting started there. The good news is: as swiftly as global economic progress has been halted, when 'tis all clear to "Release the hounds!" reports ought quickly improve. Our admittedly amateurish guess in negotiating 'round all the shameless-media and politically-driven gloom is that this Black Swan shall pass rather fleetingly upon there being more understanding and confidence of the coronavirus data such that the Baro's recovery can be rapid. Either way, here's the year-over-year view of the Econ Baro (blue line) and S&P 500 (red line), the latter profiling a superb impression of El Capitan's southwest face:
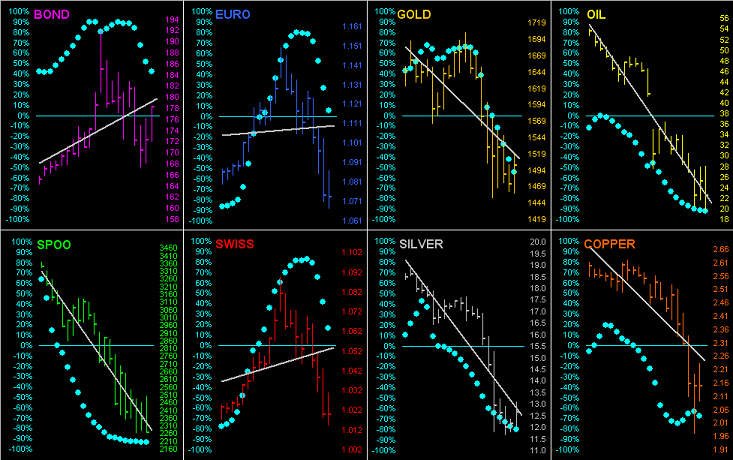
And as it all goes wrong, let's go 'round the horn for the eight components of the BEGOS Markets by their daily bars from one month-ago-to-date. As you regular readers and website devotees know, the baby blue dots in each panel represent the day-to-day consistency of that market's ever-slope-adjusting grey trendline. Key to note in this view is that for every market either its trendline is down and/or its "Baby Blues" are falling. That's a Black Swan, baby:
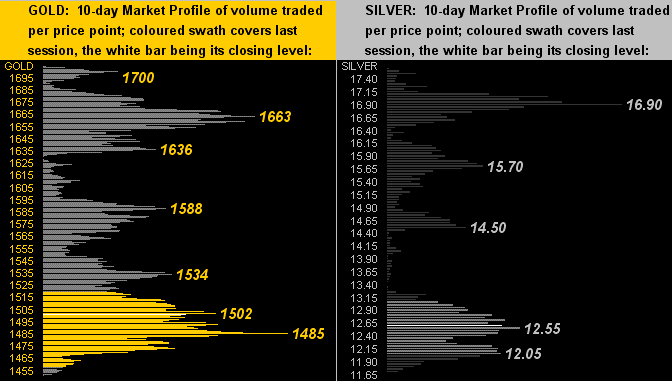
Next we've the 10-day Market Profiles for Gold (below left) and Silver (below right). Starkest for both precious metals is the vast amount of downside distance traveled in just this past fortnight. From high-to-low on their respective profiles, Gold has dropped -14.9% whilst Sister Silver has shed -33.9%. By same time frame, 'tis the yellow metal's largest percentage drop since the 10-day trading period ending 01 July 2013, and for the white metal her worst 10-day plunge since that ending 12 May 2011. Yet as we just wrote in a note to some trading compatriots, the price of Silver (today 12.63) could well quadruple just in returning to her All-Time High of 49.82 (on 25 April, 2011). Ride the "Hi-ho, Silver!" trail via a venerable mining company at triple the leverage could thereby produce a duodecuple! Holy Toledo! Here are the Profiles:
And so to our final graphic, that of the S&P 500's daily closes from mid-year 2016 right through yesterday's settle at 2305, the high en route being 3393 just one month ago. Clearly depicted is the "Trump Rally" -- its late 2018 correction notwithstanding -- to unconscionably earnings-less highs, ultimately to be unraveled by the coronavirus or otherwise. The timing for the present President's re-election is -- well -- untimely. But as herein inferred tongue-in-conspiratorial-cheek on occasion, for the media and opposition to really dump Trump, their best shot failing all else they've already tried would be instilling a stock market crash. And there they've got it, the 2154 line as labeled being the pre-election support shelf from back in 2016, which if touched would fully expunge the Trump rally:
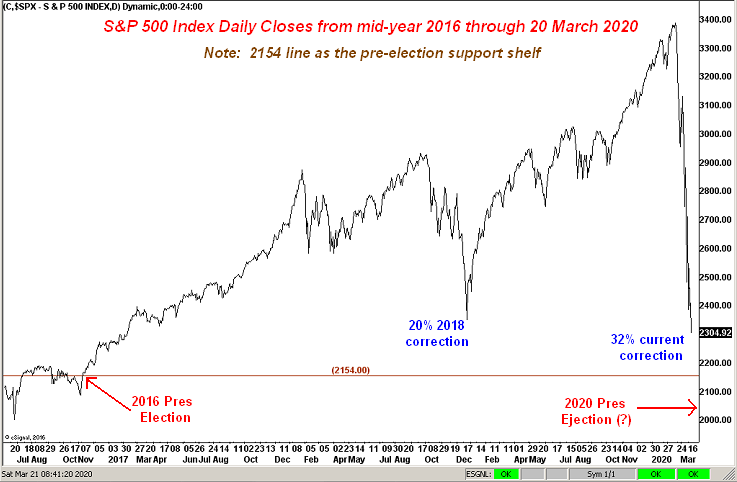
But beyond the political landscape, let's bear (pun intended) in mind that the 2000 "Dot Com Bomb" brought on a -50% correction as did the 2008/2009 "What Credit? Debit!!" A -50% frying again of the S&P would bring 1697, which itself has no structural support quality such that a full -55% run down into the mid-1500s is viable, that area forming the double-top across both the "Dot Com Bomb" and "What Credit? Debit!!" debacles.
"But what do you think, mmb..."
Wishful thinking as it may be, Squire, upon getting this coronavirus corralled, just as swiftly as we're unwinding, so too shall we recover if for no other reason than interest rates are basically zero. 'Twill be good for the stock market even as our "live" price/earnings ratio is at present still a lofty 29.0x and 'twill be good for Gold given the imminent floods of liquidity and quantitative easing. Remember: 'tis conventional wisdom that Gold and the S&P trade inversely to one another; but most broadly, they trade in positive correlation. Want proof? On 21 May in the Year of the Black Swan 2008, the S&P 500 settled at 1391 and Gold settled at 929; today the S&P is 63.1% higher at 2305 and likewise is Gold 63.1% higher at 1501. Wow your friends with that stat at the next "six-feet distance" cocktail party -- if you're able to sneak out to such event. Either way, 'twill pay to go the Gold way!
********

Mark Mead Baillie has had an extensive business career beginning in banking and financial services for two years with Banque Nationale de Paris to corporate research for three years at Barclays Bank and then for six years as an analyst and corporate lender with Société Générale.
For the last 22 years he has expanded his financial expertise by creating his own financial services company, de Meadville International, which comprehensively follows his BEGOS complex of markets (Bond/Euro/Gold/Oil/S&P) and the trading of the futures therein. He is recognized within the financial community of demonstrating creative technical skills that surpass industry standards toward making highly informed market assessments and his work is featured in Merrill Lynch Wealth Management client presentations. He has adapted such skills into becoming the popular author each week of the prolific “The Gold Update” and is known in the financial website community as “mmb” and “deMeadville”.
Mr. Baillie holds a BS in Business from the University of Southern California and an MBA in Finance from Golden Gate University.


