Gold & Silver’s Step Sum And Open Interest


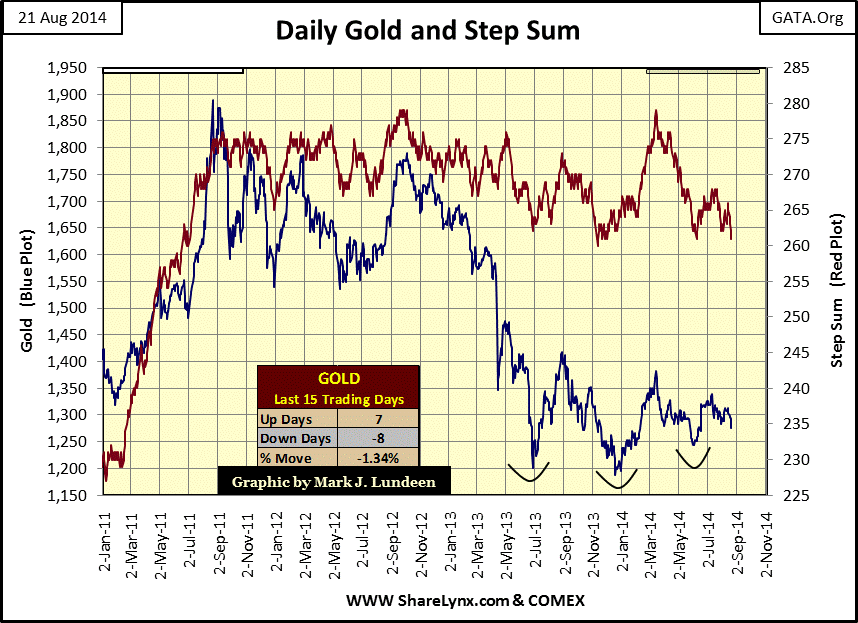
Here are a few charts I hope everyone will find interesting. First is a short term step sum chart for gold. We see gold’s last upsurge (Blue Plot) was terminated three years ago in August 2011. Back then market sentiment (Red Step Sum Plot) was rising along with the price of gold, but since then the two plots have diverged into a thirty-six month bear box. As I noted in last week’s article, usually the price trend is a better predictor of future market trends than the step sum, meaning that it would be no surprise to see the step sum collapse from here, taking the price of gold down with it. But that’s not always the way these boxes resolve themselves. One should expect the unexpected in this crazy market. A big surge in the price of gold sometime before Christmas with the step sum plot moving up briskly along with the price plot should not be ruled out. I wish I could be a little more specific here, but the truth is that in the short term it’s a coin toss how this three year box gets resolved.
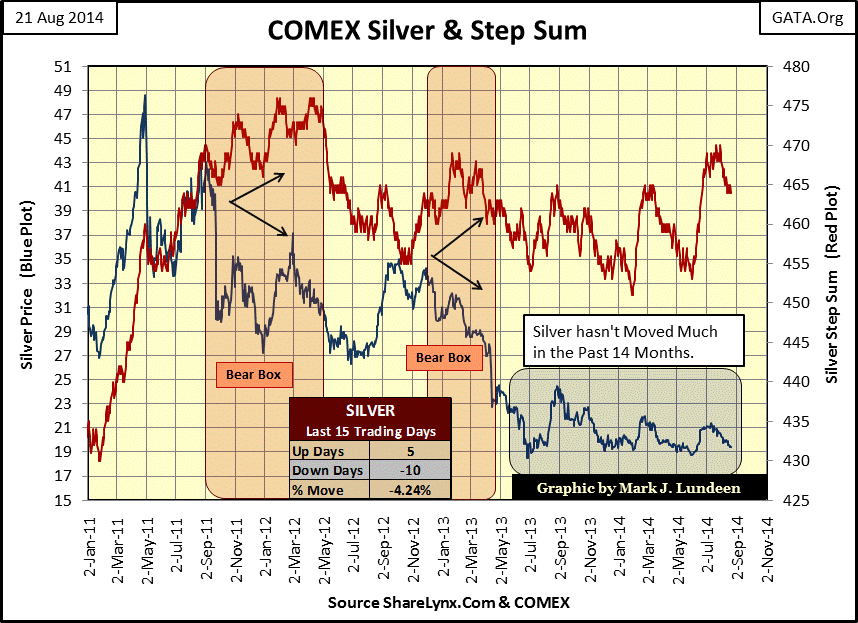
Silver (as well as gold) is currently in a multi-year bear box going back to April 2011, but in the chart below I only noted the two smaller bear boxes that have occurred within the larger, unmarked forty month bear box. The thing that stands out with silver is how tight its trading range has been for the past fourteen months (Blue Plot). But the real question is how much longer can the cartel keep the price of silver from breaking out and moving upward toward its high of April 2011; or will the next big move be down? Also, since the beginning of the year we’ve seen two small up surges in the price of silver occurring with a lot of net-up days in its step sum (Red Plot). That tells me that the price of silver wants to move up, but its daily gains were capped by the shorts. This restricted price action certainly can’t last forever.
Maybe looking at gold and silver’s open interest can give us some insight into what’s happening in the precious metals markets. Looking at gold’s open interest we see two red boxes; the first one shows what happened during the credit crisis when gold declined $300 an ounce. That amounts to a theoretical profit of $30,000 for each 100 ounce contract held short during the entire six month price decline (or a $30,000 loss for each long contract held). But I’m pretty sure that most of those contracts were not that profitable to the shorts (or costly to the longs). After the March to October 2008 decline in gold’s open interest, along with the deep decline in the price of gold, November 2008 offered investors an excellent safe entry point into the gold market. But the setup for gold’s current correction is not so clear cut as its open interest has remained relatively constant for most of the past two years.

In the second red box, we see that gold’s open interest didn’t collapse as it did in 2008. Like its step sum, gold’s open interest is hanging in there and that has to be frustrating for the big banks who are the big shorts in the gold market. I’d love to see gold’s open interest collapse from here – but on rising gold prices! That would be a big positive for gold’s near future price trend.
Let’s have a look at silver’s open interest. Silver, (like gold), saw a huge decline in OI during the credit crisis as the price of silver plummeted from $20 in March to $8.80 in October 2008. The shorts really cleaned up in those seven months. And again, the shorts took home some serious money from late April to December 2011 (first red box), and again in the spring of 2013 (second red box) when the shorts ran the longs out of town as silver plunged from $32 in February to just $19 in June.

But the current rise in OI has occurred during a time when the price of silver has been range bound between $19 and $21. So for the most part, no serious money has been made by the shorts, or lost by the longs in the silver market since last September. But seeing the OI in silver increasing as it has over the past year tells us that there are people willing to take on the big bank shorts; and the longs just might be right this time.
I don’t use leverage, as traders in futures contracts do, but that doesn’t mean I won’t enjoy the show if we see a big spike up in the price of silver as silver’s open interest collapses. When that happens, the big Wall Street banks just got sent to the woodshed for a well-earned whooping. It’s bound to happen one day, so why not one day in 2014?


