Gold, Silver And Stock Market Chart Update


Gold & Silver Charts
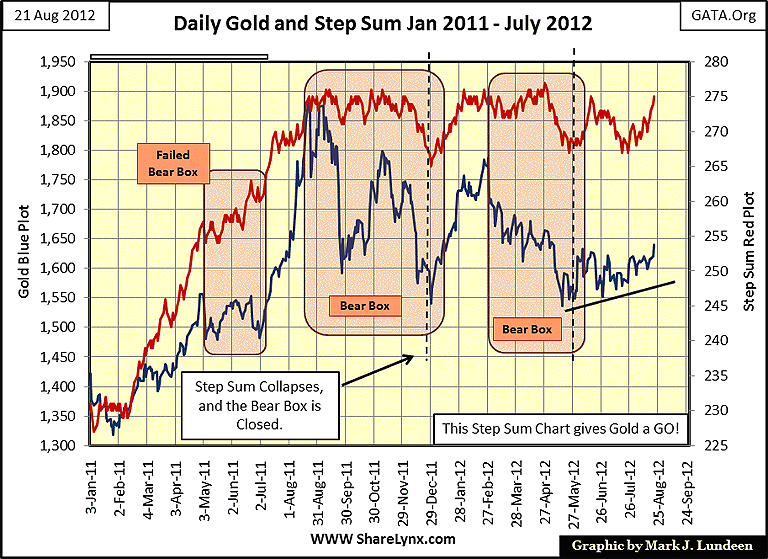
Gold and its step sum look very promising! The price of gold put in a double bottom in mid-May of this year, after falling just a tad below its lows of late last December. Since mid-May, gold has clawed its way higher, and has now broken out its trading range in the first two trading days of this week. Gold's step sum (Red Plot - Left Scale) looks very constructive. It has been in a trading range since August of last year. Should it break above 280, this would be a solid indication that market sentiment is ready to accept much higher gold prices. See gold and its step sum from January 03 - August 31 to understand the potential what this could mean in the months ahead of us.
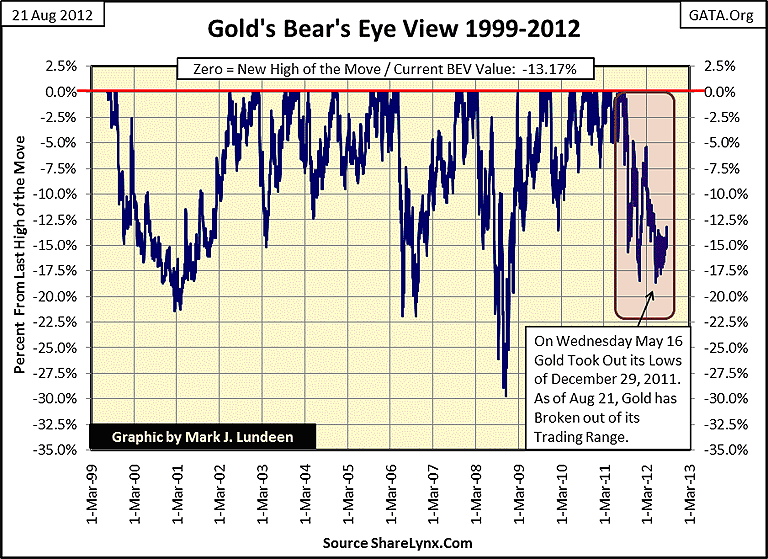
No matter what you hear from the "gold experts" in the media, since 1999, volatility in the gold market has been very tame. The price of gold hasn't once declined by 30% in the past thirteen years. Not shown below is the Bear's Eye View plot for the 1969-80 gold bull market, which saw much more volatility.
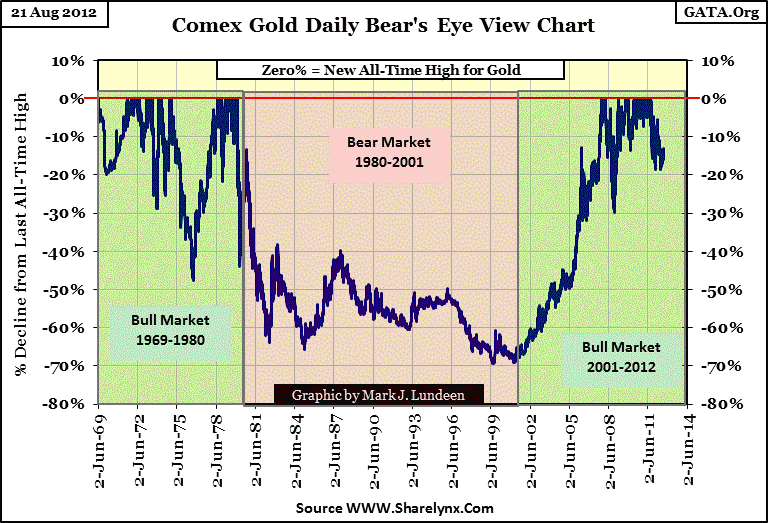
What the heck, here's gold's BEV plot from 1969-2012. There is no comparison between gold's two bull markets where volatility is concerned. If one had turned off the TV, and ignored the frequent calls to panic out of one's position in gold, it has been easy to make money buying (and holding) gold for the past decade.
The media doesn't like gold as the press in 2012, is for the most part an organ for our corrupt establishment, which benefits from inflating the money supply. Rising gold and silver prices risks bring to the public's attention questions Washington and Wall Street would rather not have to answer; questions like why isn't Jon Corzine being prosecuted for stealing $1.5 billion from his clients? And then questions like: "you mean to tell me that all of Social Security's reserves are in NON- NEGOTIABLE US Treasury bonds?" They are. Uncle Sam taxes you once to buy the bond, and tax you again to honor their commitment to the recipients to the Social Security System. No one cares, as long as the media stays quite about it.
So the financial media continues to cover bank and high-tech stocks as if it's still the 1990s, when gold was in a bear market. But since 2000, all this has changed. However, for the media, they will continue to report on the markets as if they still were living in the 1990s, and this isn't going change anytime soon. Gold has been, and will continue to be a long term hold, while financial and high tech stocks will continue to be long term sells for years to come.
What about Apple? Well - what about Apple? Last I heard they sold cell phones that are changing the world. Personally, I know Microsoft and Intel had a better growth story in the 1990s; why their shares would never go down - but their day came and then went all the same. It an old story in the stock market; Apple today, Nokia tomorrow!
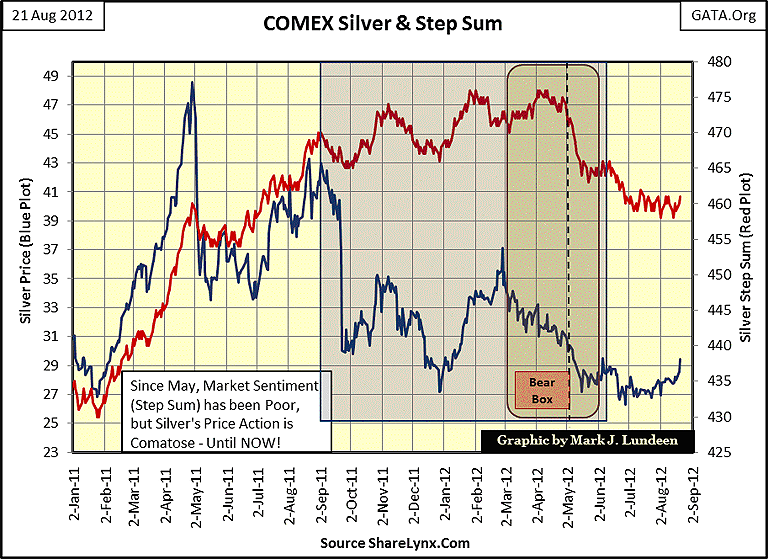
Let's look at silver; like gold, silver has been clawing its way to higher prices since May of this year, and has now broken out of this three month trading range. Its step sum has yet to do so, but that's okay! The price trend is always the more important of the two trends. What the step sum is saying is that market sentiment has yet to recognize that something has changed in the silver market. Geeze Louise, I'd love seeing silver's step sum turn down ahead of the central bankers meeting at Jackson's Hole meeting next month, as long as its price continued to go up.
If silver, and gold, are really entering their next bullish impulse upward to new highs, and I really think they are, the price of silver should receive an upward boost when its step sum begins to turn upward.
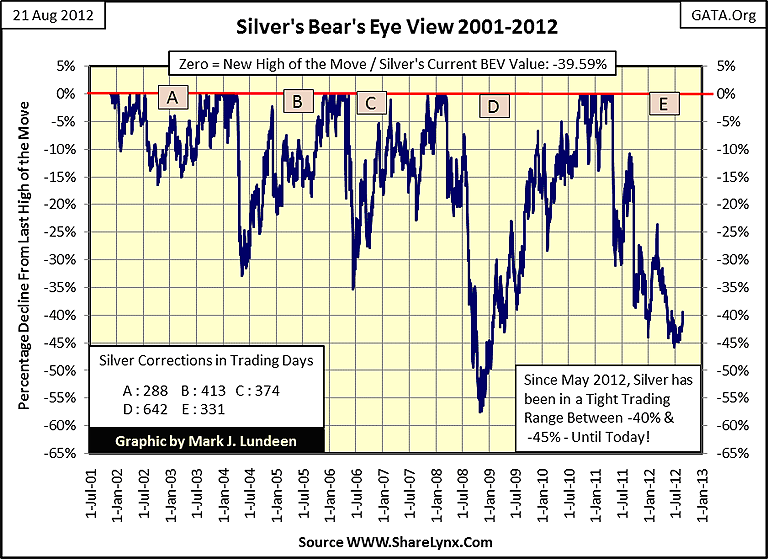
We are now in silver's second deepest price correction since 2001 (letter E below). Note the table in the chart below listing the number of days between BEV Zero's (new highs of the move) for the other four corrections. Correction "E" bottomed on June 28, or day 294 of the current correction when silver declined 45.95% from its last high of the move in April 2011. As of today, it cleared its -40% BEV line, closing with a BEV of -39.59%.
To take out its high of April 2011 in the next few months, 40 BEV points is quite a move, unless you're investing in silver! Look at what the price of silver did from February to April in 2011, (chart above). Yea - it went from $27 to almost $49 an ounce in a little less than three months. Could silver do this again? After decades of market manipulation by the "policy makers" in the financial markets, silver's next move could be breath taking.
Mind you, no guarantees of future performance in the price of anything I write about. Like you, I just take what the market hand me day by day. But historical chart patterns (and past, and current harebrained schemes by Washington and Wall Street) are important in my work. I wouldn't be a bit surprised to see silver finally take out its last all-time high from January 1980 ($50) by Christmas, or even Halloween.
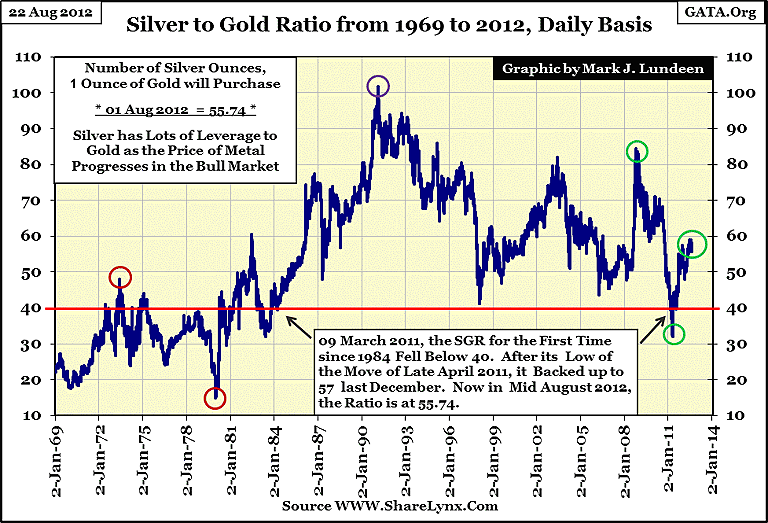
The Silver to Gold Ratio (SGR) also seems to have found a top. It now sports a 55 handle instead of a 58. It's still too early to make any definite claims about market events that may not come about for years, but if gold and silver are going higher, history tells us that silver will outperform gold.
No kidding, in a gold bull market, the big money is in buying silver. From these levels, should the SGR descend to its levels last saw in January 1980 top for gold and silver, for every one dollar of profit seen in gold, silver should return just under six dollars. Can this happen? Sure it can! What's stopping the SGR from falling down to 5 or below, giving silver a $12/$1 advantage to gold? Since 1980, billions of ounces of silver have actually been consumed, and dumped into the world's trash heaps. This silver is gone forever. There is actually more gold available in the world than silver. That is a big change from 1980, when the US Treasury maintained many billions of ounces of silver. Since 2002, the US Treasury, and all of the world's leading government treasuries now have none.
Sometime in the next few years, it seems reasonable that the metal markets will price this fact of the lack of availability of physical silver into its price. In a panic, we may see the unthinkable happen, where the price of silver rises above the price of gold.
Now I realize that this is sounds ridiculous. But what sounds ridiculous in 2012 may become a fact of life in the years to come. I'll tell you what sounded ridiculous in August 1971, that the national debt ($400 billion in 1971) would rise up to sixteen trillion dollars in the next forty-two years, or that the price of gold in 1971 ($43), would rise up to $840 just nine years later. Milton Friedman in 1971 predicted that without US Treasury support, gold would collapse below its Bretton Woods' $35 an ounce peg. That was ridiculous, but only "tin-foil hat gold bugs" call him on it 1971.
I don't know what is going to happen. However, I do recognize that 2000 was twelve years ago, and a totally different world from today, no matter how badly financial media wishes this wasn't so. That plus in the years to come, many things are going to happen that current-economic wisdom believes ridiculous. Believing the price of silver could rise up to, and possibly exceed the price of gold seems like one of those ridiculous ideas that just might happen. With the SGR currently at 55.74, that would give the owners of silver a profit gearing of $55.74:$1 compared to gold. For only $29 dollars for a ticket to ride the Silver-Streak, I'd say it's worth the money to take the trip.
Stock Market Charts
Look at this BEV Chart for the Dow Jones from the bottom of its Credit Crisis low on 09 March 2009 to today. Remember, every time a BEV plot sees a Zero, a new high of the move was made. It appears that the Dow Jones (on a closing price basis) made a new high of the move within the past week - but it didn't.
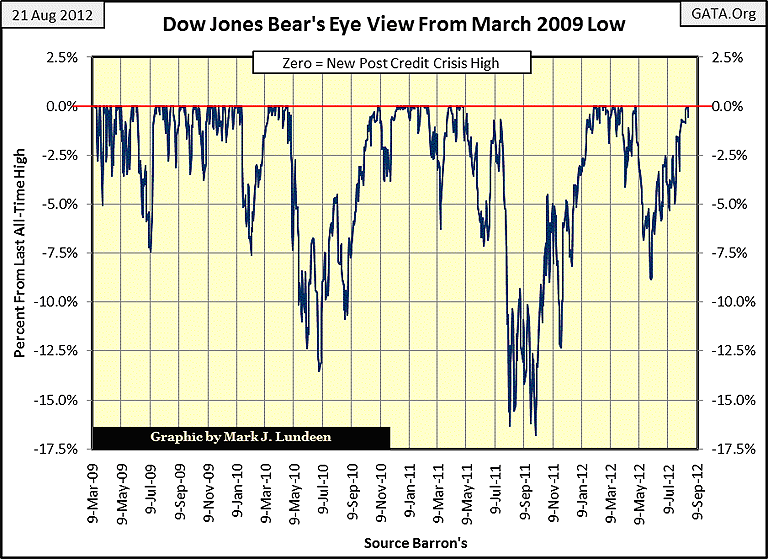
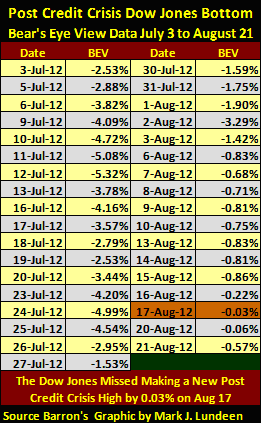
Next is a daily record of Dow Jones BEV values from July 03 to August 21. On August 17, the Dow Jones missed doing so by only 0.03%. This is pathetic.
Now I realize that everything I write in this paragraph will be rendered moot should the Dow Jones in the days, weeks or months ahead of us find the strength to take out its current high of the post credit crisis of May 01 of this year. But financial assets are in a bear market. We live in a world where central banksters wrestle daily with snakes in their vain efforts to keep the world safe from "deflation", which to central bankers means the reserve valuations for their banking systems. Hell, a Big Mac could go for $25, but should the yield for US Treasuries rise up to 5%, the only thing we'd see on CNBC will be flacks for the central banks demanding more Quantitative Easing to get those reserve valuations back up in our "zero inflation" economy.
In bear markets, Mr Bear likes to play his little games with the bulls, and I think we are looking at one of his little games above. We'll know for sure should the Dow Jones continue moving down the weeks ahead of us, in anticipation of the monetary madness that is sure to come from the CB get together at Jackson's Hole next month.
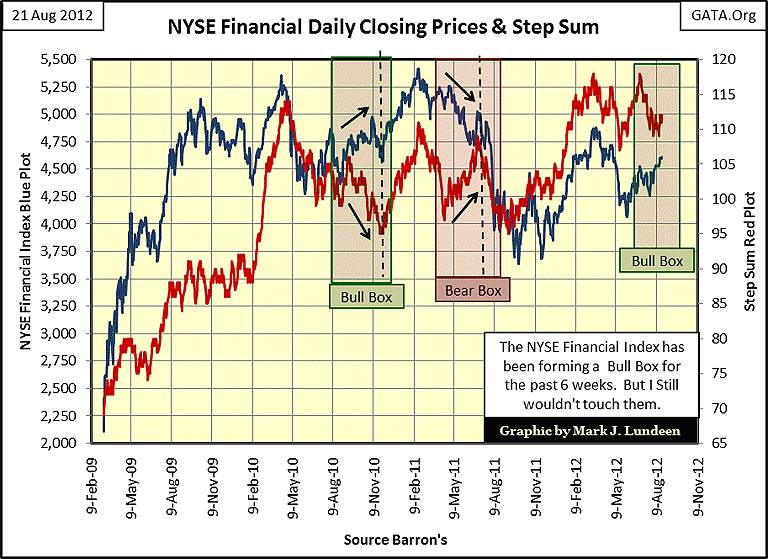
Talk about madness, the NYSE Financial Index is forming a bull box! Should you purchase financial stocks? If you're the money manager controlling President Obama's personal wealth in his blind trust, I'd recommend that you super-charge the president's portfolio with as many shares of JP Morgan and Goldman as his funds will allow, and then double up with margin. This would be illegal, but in our regulated markets - who cares about the law? Just last week, CNBC had a bank analysis predicting a 20% increase in the earnings for bank stocks. What could go wrong? Oh, just about everything, with dozens of financial land mines in each of the world's twenty four time zones. So for us working stiffs, I'm still recommending gold and silver, and leaving the bank stocks to the "professionals."
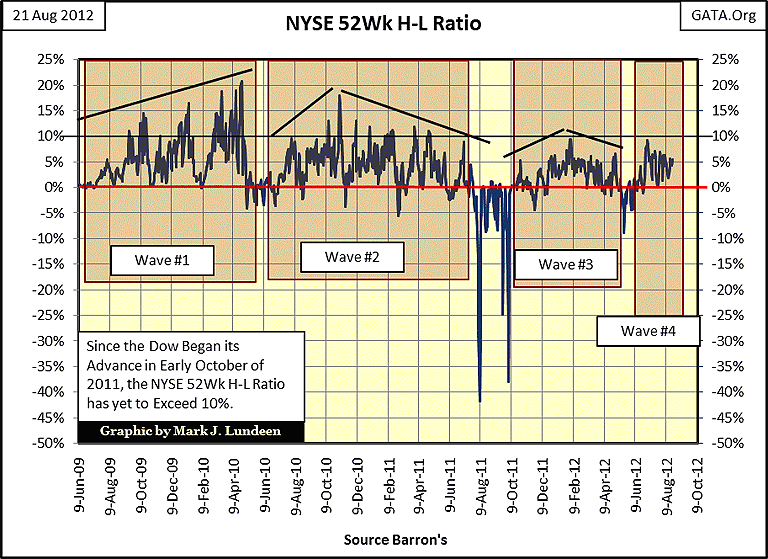
By my reckoning, from the bottom of the credit crisis, we are now in wave #4 in the NYSE 52Wk H-L ratio plot. We still haven't crossed the 10% line since April 2011. Don't expect any excitement in the stock market until this ratio either takes off as it did in waves #1&2, or until it drops like a rock as it did last August-October. I'm a bear, so I expect another repeat of last year's declines in this ratio sometime soon.
Now what would cause that? Actually lots of things, but I keep looking at trading volume. Volume for the Dow Jones hasn't been this low since August 1999, but in 1999, 100 million shares represented rising volume in a bull market. Today, thirteen years later, a million shares is a new low in a dubious "bull market." Then we have to admit that today, 50-70% of daily trading volume is from High Frequency Trading, where the big banks front load their clients buy and sell orders, or for other nefarious reasons honest people couldn't possibly imagine. Back in 1999, HFT was insignificant. Keep that in mind, as not all 100 million share trading days for the Dow Jones are created equal.
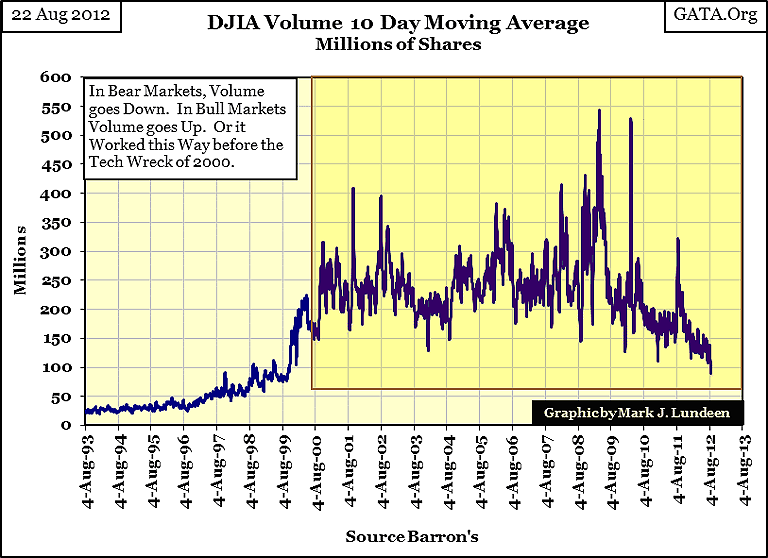
This is an important chart. Note that since 2000, bad markets always see a rise in trading volume. After the top of the high-tech market was in, volume didn't soar to historical highs when the Dow Jones saw a new all-time high in October 2007, but when it fell to its second deepest bear market bottom since 1885 eighteen months later. The latest volume spike occurred just last August, when the Dow Jones saw its last steep decline. Next time the Dow Jones comes under the ministrations of Mr Bear, expect its trading volume to explode as Dr Bernanke monetizes more junk mortgages to keep his banking empire's precious financial assets from "deflating."
Mark J. Lundeen
[email protected]
[email protected]


